

Abstract
Background
The treatment of muscle wasting is accompanied by benefits in other organs, possibly resulting from muscle–organ crosstalk. However, how the muscle communicates with these organs is less understood. Two microRNAs (miRs), miR‐23a and miR‐27a, are located together in a gene cluster and regulate proteins that are involved in the atrophy process. MiR‐23a/27a has been shown to reduce muscle wasting and act as an anti‐fibrotic agent. We hypothesized that intramuscular injection of miR‐23a/27a would counteract both muscle wasting and renal fibrosis lesions in a streptozotocin‐induced diabetic model.
Methods
We generated an adeno‐associated virus (AAV) that overexpresses the miR‐23a∼27a∼24‐2 precursor RNA and injected it into the tibialis anterior muscle of streptozotocin‐induced diabetic mice. Muscle cross‐section area (immunohistology plus software measurement) and muscle function (grip strength) were used to evaluate muscle atrophy. Fibrosis‐related proteins were measured by western blot to monitor renal damage. In some cases, AAV‐GFP was used to mimic the miR movement in vivo, allowing us to track organ redistribution by using the Xtreme Imaging System.
Results
The injection of AAV‐miR‐23a/27a increased the levels of miR‐23a and miR‐27a as well as increased phosphorylated Akt, attenuated the levels of FoxO1 and PTEN proteins, and reduced the abundance of TRIM63/MuRF1 and FBXO32/atrogin‐1 in skeletal muscles. It also decreased myostatin mRNA and protein levels as well as the levels of phosphorylated pSMAD2/3. Provision of miR‐23a/27a attenuates the diabetes‐induced reduction of muscle cross‐sectional area and muscle function. Curiously, the serum BUN of diabetic animals was reduced in mice undergoing the miR‐23a/27a intervention. Renal fibrosis, evaluated by Masson trichromatic staining, was also decreased as were kidney levels of phosphorylated SMAD2/3, alpha smooth muscle actin, fibronectin, and collagen. In diabetic mice injected intramuscularly with AAV‐GFP, GFP fluorescence levels in the kidneys showed linear correlation with the levels in injected muscle when examined by linear regression. Following intramuscular injection of AAV‐miR‐23a∼27a∼24‐2, the levels of miR‐23a and miR‐27a in serum exosomes and kidney were significantly increased compared with samples from control virus‐injected mice; however, no viral DNA was detected in the kidney.
Conclusions
We conclude that overexpression of miR‐23a/27a in muscle prevents diabetes‐induced muscle cachexia and attenuates renal fibrosis lesions via muscle–kidney crosstalk. Further, this crosstalk involves movement of miR potentially through muscle originated exosomes and serum distribution without movement of AAV. These results could provide new approaches for developing therapeutic strategies for diabetic nephropathy with muscle wasting.
Keywords: Exosome, Crosstalk, Insulin signalling, pSMAD2/3, microRNA
Introduction
Muscle wasting is an independent index for mortality and morbidity in almost every chronic kidney disease (CKD) patient.1, 2, 3 It is also an acknowledged risk factor in other types of catabolic conditions, such as diabetes, heart failure, and cancer.4, 5, 6 Diabetes is the leading cause of CKD, which is responsible for about 30% of all end‐stage renal disease cases in the United States and other Western societies.7, 8 Although therapeutic approaches to glycaemic control and recently developed renoprotective drugs are partially effective against the symptoms of diabetic nephropathy, this disorder is still a major cause of increased mortality in diabetic patients.7
Earlier, we found that insulin deficiency and insulin resistance lead to the down‐regulation of the insulin and IGF‐1 signalling pathways that are critical for induction of muscle wasting in catabolic disease.9, 10 Akt, also known as protein kinase B, is a serine/threonine‐specific protein kinase that plays a central role in regulating muscle mass. In general, up‐regulation of the IGF‐1/insulin/Akt pathway increases protein synthesis, decreases protein degradation, and, therefore, antagonizes muscle wasting.
Myostatin (also known as growth differentiation factor 8) is a negative regulator of muscle mass. It is an important member of the transforming growth factor‐β (TGF‐β) superfamily that regulates cell proliferation, differentiation, and death.11 The Small body size and Mothers Against Decapentaplegic Homologue 2 and 3 (SMAD2 and SMAD3) proteins are transcription factors that are phosphorylated in response to TGF‐β and myostatin; they up‐regulate the expression of various fibrosis‐related genes.12 In CKD, increased TGF‐β in kidney leads to activation of SMAD2/3, which causes proliferation of myofibroblast, accumulation of extracellular matrix proteins, and eventually kidney fibrosis. In skeletal muscle, activation of SMAD2/3 by myostatin inhibits myoblast differentiation into mature muscle fibres.13 In contrast, pharmacological inhibition of myostatin markedly enhances satellite cell function as well as decreases the rate of protein degradation and increases protein synthesis in skeletal muscles.14
MicroRNAs (miRs) have emerged as key regulators of metabolic homoeostasis, suggesting that they may provide effective treatment for diabetes mellitus and its complications.15, 16 These small non‐coding RNAs target important pathway components for insulin signalling, TGF/myostatin cascade, and inflammation.17 Earlier, we found 22 miRs which are altered in a muscle atrophy model of CKD mouse, including a decrease in miR‐23a.15 miR‐23a is located in a cluster with miR‐27a and miR‐24‐2 (miR‐23a∼27a∼24‐2) on chromosome 8 (chromosome 19 in human). The precursor miR is processed into individual miRs‐miR‐23a, miR‐27a, and miR‐24‐2—which target different sets of mRNAs. We recently reported that expression of miR‐23a/27a mimics resistance exercise to prevent CKD‐induced muscle atrophy by altering the abundance of multiple proteins.18 In addition, we showed that miR‐23a was decreased in the skeletal muscle of diabetic rats consistent with the muscle atrophy seen during diabetes mellitus.19 Other groups have reported that ectopic expression of miR‐23a protects against dexamethasone‐induced skeletal muscle atrophy in part by targeting the 3′‐UTR of atrophy‐inducing two E3 ubiquitin ligases, TRIM63/MuRF1, and FBXO32/atrogin‐1.20
In this study, we explore the possibility that exosomes, small (30‐120 nm) extracellular vesicles, facilitate the crosstalk between muscle and kidney. We began by testing the hypothesis that overexpression of miR‐23a/27a in skeletal muscle of STZ‐induced diabetic mice would lead to attenuation of muscle loss. During the course of our experiments, we found less fibrosis lesions in the kidneys of diabetic mice overexpressing miR‐23a/27a in skeletal muscle. This led us to test whether miR‐23a/27a‐containing exosome released from skeletal muscle could affect the fibrotic process in the kidney by down‐regulating the TGFβ/SMAD cascade. Finally, we used adeno‐associated virus (AAV)‐green fluorescent protein (GFP) to test whether miR‐23a~27a~24‐2 expressed in skeletal muscle could be transported by circulating exosomes to kidney.
Methods
Animals and diabetic mice model
The mice (C57BL/6J) were purchased from Jackson Laboratories (Bar Harbour, ME, USA) and bred in the Department of Animal Resources at Emory University.21 Diabetic mice were produced by STZ (Pfanstiehl Lab, Waukegan IL, USA) injection by using a 2‐day protocol in which 150 mg/kg (prepared fresh in 0.1 M citrate buffer, pH 4.0) was given by intra‐peritoneal injection for 2 consecutive days. The control mice were injected with vehicle only. The experiments are performed in male mice because, in our hands, female mice resist diabetes after injection of STZ. Mice (C57BL/6J, 6–8 weeks) were randomly assigned into four groups: control/AAV‐GFP (control), control/AAV‐miR‐23a∼27a∼24‐2, diabetes/AAV‐GFP, and diabetes/AAV‐miR‐23a∼27a∼24‐2 (n = 12/group). The muscle and kidney were harvested 12 weeks after the second STZ injection (Table 1). Muscle grip function was measured by using a mouse grip strength metre with dual computerized sensors to detect and record the grip force (Columbus Instruments, Columbus, OH).22 The technicians were blinded to the grip‐strength measurements. Blood urea nitrogen (BUN) was measured with a BUN Kinetic Procedure Kit (Thermo Electron, Louisville, CO). Serum creatinine was measured with a Serum Creatinine detection kit (KBO2‐H1; Arbor Assays, Ann Arbor, MI).
Table 1.
Muscle and body weight
| Control + miR‐ctrl | Control + miR‐23/27 | Diabetes + miR‐ctrl | Diabetes + miR‐23/27 | |
|---|---|---|---|---|
| Body weight (g) | 22.7 ± 1.1 | 21.6 ± 1.9 | 19.6 ± 1.5# | 20.7 ± 1.1*, # |
| aTA (mg) | 45.9 ± 3.9 | 47.5 ± 5.1 | 36.1 ± 6.1# | 43.5 ± 2.9* |
| Soleus (mg) | 8.9 ± 0.9 | 9.5 ± 0.6 | 6.2 ± 0.5# | 7.9 ± 0.9*, # |
| bEDL (mg) | 9.5 ± 0.9 | 9.9 ± 0.8 | 7.1 ± 0.4# | 8.5 ± 0.9*, # |
| Gastrocnemius (mg) | 123 ± 12.2 | 125 ± 10.1 | 88 ± 11.1# | 112 ± 10.4* |
| Glucose (mg/dL) | 99.5 ± 4.8 | 106 ± 5.4 | 306 ± 19.1# | 276 ± 9.9# |
All data are presented as mean ± s.e.; n = 9.
TA, tibialis anterior.
EDL, extensor digitorum longus.
p < 0.05 vs. control.
p < 0.05 vs. diabetes.
Production of high titre adeno‐associated virus
The miR‐23a~27a~24‐2 was cloned into cis‐plasmid pTR‐UF5 vector (pTR‐miR‐23a~27a~24‐2) with CMV promoter by Emory Integrated Genomics Core. Two controls were prepared. The miR‐mimic control and GFP gene were each cloned into the pTR‐UF5 vector to produce the two AAV‐controls. Cells transfected with either control showed the same miR expression, so to facilitate tracking, we used AAV‐GFP for the experiment control virus. The AAV was produced and tittered by the Viral Vector Core of the Emory by using three plasmid system: pTR‐miR‐23a~27a~24‐2 or pTR‐GFP, pAAV2/9 (p5E18‐VD2/9, AAV trans‐plasmid containing AAV rep and cap genes), and pDF6 (adenovirus helper plasmid). The stock virus titres for AAV‐miR‐23 were 3.4 × 10¹⁴ and 6.5 × 10¹⁴ for AAV‐control. Fifteen microlitres of viral preparation (1010) was injected into TA muscle over 5 min by using a Hamilton syringe with 30 gauge needle.21 Only left legs of the mouse were injected with recombinant AAV (rAAV).
Western blot and antibodies
Equal amounts of protein from TA muscle or whole kidney were used for western blot.23, 24 Protein bands were scanned and quantified by using the Li‐cor Odyssey infrared scanning system (Li‐COR Biosciences, Lincoin, Nebraska). Primary antibodies are listed in supporting information.
Exosome isolation, NanoSight measurement, and in vivo imaging
Serum was 5× diluted with phosphate‐buffered saline (PBS) and cell debris, and organelles were eliminated by centrifugation at 1000g for 10 min, 4 °C. The supernatant fraction was further centrifuged at 16 000g for 30 min. The second supernatant was sterile filtered through a 0.22‐μm filter. Exosomes were pelleted at 120 000g for 90 min at 4 °C (L8‐70 M ultracentrifuge, Beckman‐Coulter, Indianapolis IN). Finally, the exosome pellets were re‐suspended in 100 to 400‐μL PBS. Protein content was quantitated by using a Bradford protein assay. Exosome concentration and size (Figure S3) were measured with NanoSight instruments, which performs nanoparticle tracking analysis (NanoSight NS300, Malvern Instruments, Inc. Westborough, MA). In vivo exosome distribution imaged was taken with the Bruker Small Animal Optical Imaging System (In‐Vivo Xtreme II; Billerica, MA).
Quantitative PCR
Total RNAs from muscle and kidney were extracted by using Tri‐Reagent (Molecular Research Inc., Cincinnati, OH). Exosomal RNA was isolated by using miRNAeasy kit (217004, Qiagen Sciences, Germantown, MD) and quantified by using a NanoDrop spectrophotometer (Thermo Scientific, Wilmington, DE). For mRNA expression, total RNA (1–2 μg) was reverse transcribed by using a Thermoscript RT‐PCR kit (Invitrogen Carlsbad, CA). Real‐time quantitative PCR (qPCR) was performed with the SYBR Green PCR reagent (Bio‐Rad, Hercules, CA) and the following PCR parameters: 94 °C for 2 min and 40 cycles at 94 °C for 15 s, 55 °C for 30 s, and 72 °C for 30 s with final extension at 72 °C for 10 min.22, 25 The Cq (threshold cycle) was defined as the number of cycles required for the fluorescence signal to exceed the detection threshold. Individual mRNA expression was standardized to 18S gene, and expression was calculated as the difference between the threshold values of the two genes (ΔΔcq). Melting curve analysis was always performed during real‐time qPCR to analyse and verify the specificity of the reaction. Primers for mRNA are listed in Table 2. For miR, RNA was reverse transcribed by using a universal cDNA synthesis kit II (Exiqon 203301, Wobum, MA); the primers were purchased from Exiqon. Real‐time qPCR was performed with the ExiLENT SYBR green master mix (Exiqon 203421). Expressions of individual miR‐23a‐3p, miR‐27a‐3p, and miR‐24‐3p were standardized to the mouse U6 mRNA and calculated as the difference between the threshold values of the two genes (ΔΔcq). The expression of individual miRs in serum exosomes was normalized to miR‐103a.
Table 2.
Primer sequences
| Name | Sequence | Amplicon | Code | |
|---|---|---|---|---|
| FBXO32/Atrogen‐1 | Forward | GCAGAGAGTCGGCAAGTC | 142 | NM_026346 |
| Reverse | CAG GTC GGT GAT CGT GAG | |||
| TRIM63/MuRF‐1 | Forward | AGTGTCCATGTCTGGAGGTCGTTT | 139 | DQ229108 |
| Reverse | ACTGGAGCACTCCTGCTTGTAGAT | |||
| Myostatin | Forward | GACAGTGTCAGCGTGTGGGTT | 74 | NM_001112698 |
| Reverse | CCAACACCATCACCTCCTT | |||
| AAV‐ITR | Forward | CGAGGTGACAGAGACCACAA | 280 | X93167.1 |
| Reverse | CTGGAGTCAAGCCAGACACA | |||
| 18S | Forward | CCA GAG CGA AAG CAT TTG CCA AGA | 101 | X00686 |
| Reverse | TCG GCA TCG TTT ATG GTC GGA ACT | |||
| GAPDH | Forward | CACCATCTTCCAGGAGCGAG | 101 | NM‐008084 |
| Reverse | CCTTCTCCATGGTGGTGAAGAC |
Muscle and kidney histology
Tissues were fixed in 3.7% formaldehyde/PBS (pH 7.4) and dehydration, paraffinization, and section at Histology Lab of Department of Medicine. Masson Trichromatic staining was performed with a Masson modified IMEB stain kit (K7298, IMEB inc. San Marcos, CA). Images were visualized with an Olympus 1× 51 inverted microscopes and captured by DP73‐1‐51‐17MP colour camera. Collagen area (blue colour) in kidney was measured by using the CellSens Dimension 1.9 with count and measure full Software (Olympus, Melville, NY, USA) and calculated from 10 individual fields.
For immunohistology: muscles were embedded in Tissue Freezing Media (TBS; Fisher, Pittsburgh, PA, USA) in isopentane cooled in dry ice. Cross sections (10 mm) from the midbelly of different muscles mounted on gelatin‐coated slides were fixed in 4% paraformaldehyde for 10 min. Tissue was permeabilized in 0.05% Triton X‐100 (in PBS) for 10 min and quench‐fixed in 50‐mM NH4Cl for another 10 min. Samples were blocked with 5% bovine serum albumin for 1 h, followed by incubation overnight with primary antibody. Sections were subsequently washed and incubated for 60 min with FITC‐labelled anti‐rabbit IgG (111‐095‐144; diluted 1:100; Jackson Immuno Research Lab, West Grove, PA). Nuclei were stained by DAPI. Images were visualized with an Olympus 1X51 inverted fluorescence microscope and captured by DP73‐1‐51‐17MP colour camera. Muscle fibre cross‐sectional area was determined in TA muscles by using an anti‐laminin antibody (1:50 dilution; Sigma‐Aldrich), and at least 500 individual myofibres per muscle were measured.
Primary muscle satellite cell culture
Satellite cells were isolated from the hind limb muscles of 4‐month‐old mice. A Skeletal Muscle Dissociation Kit (130‐098‐305; MACS, Miltenyi Biotec, Inc. Auburn, CA) was used to dissociate mouse skeletal muscle tissue into cell suspensions, and a Satellite Cell Isolation Kit (130‐104‐267, MACS) was used to isolate satellite cells. Isolated satellite cells were passaged a maximum of 5 times. Cells were cultured in Ham's F‐10 Nutrient Mixture medium (Invitrogen) with 20% fetal bovine serum, 100‐u/mL penicillin, and 100‐μg/mL streptomycin (growth medium). Myotube differentiation was inhibited by the addition of 5‐ng/ml human β‐fibroblast growth factor (Atlanta Biologicals, Atlanta, GA) to the media. Fibroblast growth factor was removed for 2 days before the experiments. Immunohistochemistry was used to assess the cell purity. Satellites were stained with anti‐eMyHC or anti‐α‐smooth muscle actin (Sigma) to identify purification and contaminating fibroblasts which were minimal.18
Luciferase reporter assay and transfection26
Effectene transfection reagent was used for transfection (Qiagen, Valencia, CA). Firefly and Renilla luciferase activities were measured by dual‐luciferase assays (Promega) by using TD‐20/20 Luminometer (Turner designs, Sunnyvale, CA). The luciferase report vectors (pMIR‐REPORT Luciferase) were purchased from Applied BIOSYSTEMS (Waltham, MA), and constructs were made by Emory Integrated Genomics Core. miR‐23a/27a mimic (RIDIAN mmu‐miR‐23a/27aa‐3p) and miR‐23a/27a inhibitor (sh‐miR‐23a/27a, RIDIAN mmu‐miR‐23a/27ab‐3p‐hairpin inhibitor) were purchased from GE Healthcare Dharmacon Inc (Chicago, IL).
Statistical analysis
Data were presented as mean ± SEM. To identify significant differences between two groups, comparisons were made by using the paired t‐test. When multiple treatments were compared, ANOVA was performed with a post‐hoc analysis by the Student–Newman–Keuls test. The relationship between muscle and kidney GFP intensity was calculated by linear regression modelling. Differences with p values <0.05 were considered significant.
Results
Exogenous miR‐23a/27a ameliorates diabetic‐induced loss of muscle mass
To overexpress miR‐23a and miR‐27a, a rAAV that encodes the miR‐23a~27a~24‐2 precursor miR (AAV‐miR‐23a~27a~24‐2) was developed; an AAV encoding GFP (AAV‐GFP) was used as a control virus. AAV‐miR‐23a~27a~24‐2 (1010 virus genomes) was injected into the left tibialis anterior (TA) muscle of control mice and mice with STZ‐induced diabetes. Diabetic mice had a blood glucose level that was 3 times higher than the value for control mice (Table 1). Visualization of GFP in the TA muscle of control mice was used to confirm that muscle injection with AAV was successful (Figure 1A). The amount of GFP protein was significantly increased 1 week after AAV‐GFP injection (Figure 1B). In mice injected with rAAV‐miR‐23a~27a~24‐2, the expression of miR‐23a‐3p was increased 7.3‐fold in the muscle of control mice and 4.6‐fold in diabetic mice after rAAV transduction (Figure 1C). The expression of miR‐27a also increased in TA muscle transduced with rAAV‐miR‐23a~27a~24‐2 of both control and diabetic mice. As seen in our earlier study,18 there was no statistical difference in the level of miR‐24‐2 in TA muscle of mice injected with AAV‐miR‐23a∼27a∼24‐2. The intervention of AAV‐miR‐23a∼27a∼24‐2 in TA muscle ameliorated the diabetes‐induced decrease of muscle weights (Table 1). Interestingly, in un‐injected muscle, the muscle weights of soleus muscle (slow‐twitch, red fibre), extensor digitorum longus muscle (fast‐twitch, white fibre), and gastrocnemius muscles were also significantly improved by injection of AAV‐miR‐23a∼27a∼24‐2 in TA muscles of diabetic mice vs. control mice. Grip strength, a broad measurement of muscle function, was decreased in the diabetic mice cohort relative to controls; provision of AAV‐miR‐23a∼27a∼24‐2 to diabetic mice increased their muscle grip capacity compared with AAV‐GFP treated diabetic mice (Figure 1D). These data indicate that exogenous miR‐23a/27a attenuates diabetes‐induced muscle mass loss and improves muscle function.
Figure 1.
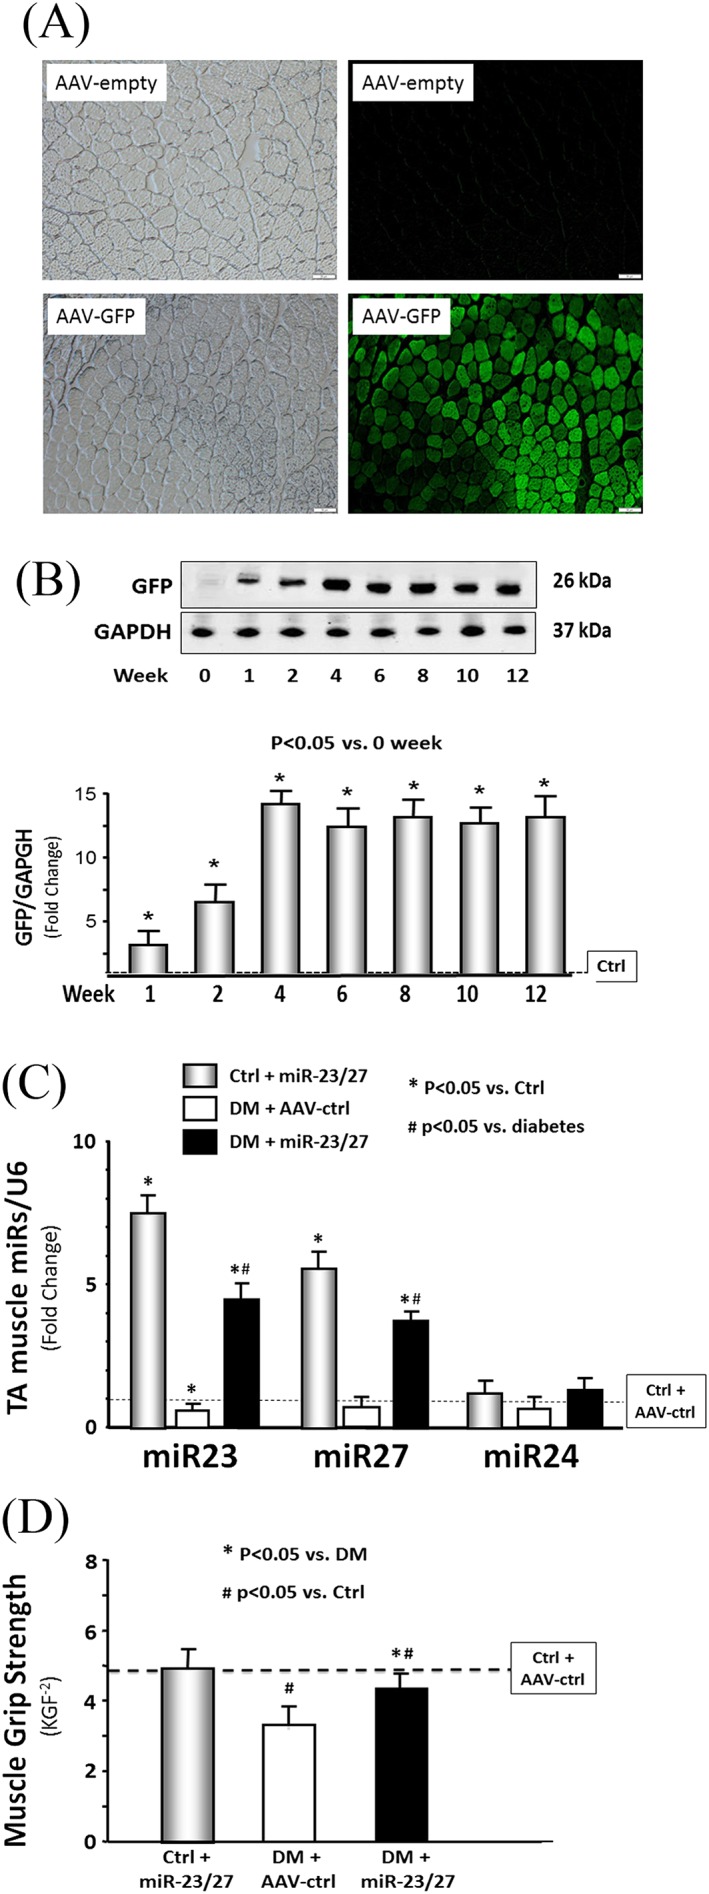
Recombinant adeno‐associated virus (AAV)‐23a~27a~24‐2 increased the microRNA (miR)‐23a/27a expression in the muscle of diabetic mice. (A) Shown are representative frozen cross sections from tibialis anterior (TA) muscles transduced with AAV in normal control mice. (right column) Fluorescence microscopy images to detect green fluorescent protein (GFP) expression; (left column) bright‐field microscopic imagines of muscle cross section. (top row) Microscopy images in mice with AAV‐Empty (no insert in AAV expression vector) transduction. (bottom row) Microscopy images in mice with AAV‐GFP transduction. (B) The time course of GFP protein abundance was measured by western blotting in TA muscle lysates from normal mice after AAV‐GFP transduction. (C) Total RNA was extracted from TA muscle of control plus AAV‐GFP (AAV‐ctrl), control plus AAV‐miR‐23a/27a, diabetes (DM) plus AAV‐ctrl, and DM plus AAV‐miR‐23a/27a mice. The expressions of miR‐23a‐3p, miR‐27a‐3p, and miR‐24‐2 were assayed by real‐time quantitative polymerase chain reaction. The bar graph shows miR from the TA muscle of each group of mice compared with levels in control mice + AAV‐ctrl (represented by a line at one‐fold). Results are normalized to U6 (bars: mean ± s.e.; n = 9/group; * p < 0.05 vs. diabetes and # p < 0.05 vs. control). (D) Hind limb muscle function in each group of mice was assessed by the grip strength. The bar graph shows grip strength from each group of mice compared with levels in control mice (represented as a dashed line at one‐fold). KGF−2 = kilogram force/100; bars: mean ± s.e.; n = 9/group; * p < 0.05 vs. diabetes and # p < 0.05 vs. control.
Exogenous miR‐23a/27a prevents muscle atrophy and improves protein anabolic signalling
To investigate whether increasing miR‐23a/27a in muscle ameliorates diabetes‐induced reduction in muscle fibre size, the cross‐sectional area (CSA) of muscle fibres was measured in frozen sections of TA muscles. Differences in the overall size distribution of muscle fibres from control, diabetic, and diabetic AAV‐23a∼27a∼24‐2‐injected muscles are shown in Figure 2A. There is no statistical difference of the muscle CSAs between control plus AAV‐ctrl (3190 ± 153 μm2) and control plus AAV‐miR‐23a/27a (3210 ± 146 μm2)‐treated mice. Statistical analysis of the muscle fibre CSA distribution data from the three cohorts indicates that diabetes reduces the CSA of muscle fibres and provision of miR‐23a∼27a∼24‐2 attenuates that reduction.
Figure 2.
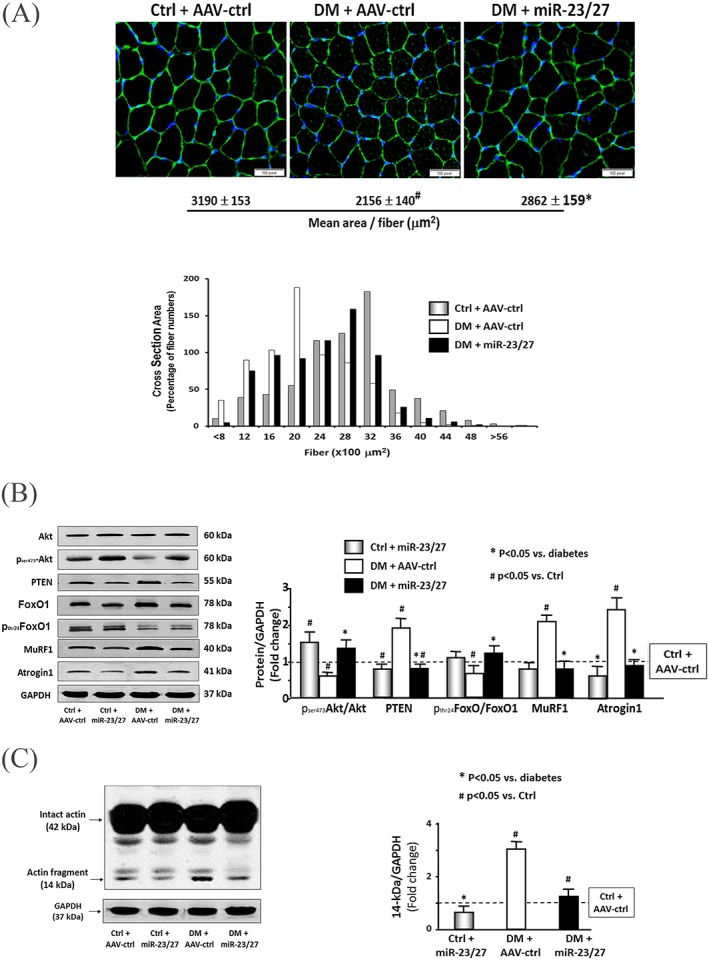
Exogenous microRNA (miR)‐23a/27a improved muscle metabolic‐related proteins and attenuated diabetes‐induced actin breakdown. (A) A representative CSA of tibialis anterior (TA) muscle of control plus adeno‐associated virus (AAV)‐green fluorescent protein (AAV‐ctrl), control plus AAV‐miR‐23a/27a, diabetes (DM) plus AAV‐ctrl, and DM plus AAV‐miR‐23a/27a mice are compared. Cryosections of TA muscles were immunostained with anti‐laminin antibody. The average of cross‐section area is shown at the bottom of images. The frequency distribution of fibre CSA in control (grey bar), diabetes (open bar), and diabetes plus miR‐23a/27a (black bar) mice is presented as per cent cross‐section area of fibres. Data: mean ± s.e.; n = 9/group; * p < 0.05 vs. diabetes and # p < 0.05 vs. control. (B) The metabolic‐related proteins Akt, p‐Akt, PTEN, FoxO1, pFoxO1, TRIM63/MuRF1, and FBXO32/atrogin‐1 were measured by western blotting in different groups of mice. The bar graph shows the fold change of the each protein band or ratio (phospho‐protein to total protein) compared with levels in control mice (represented by a line at one‐fold). Results are normalized to glyceraldehyde 3‐phosphate dehydrogenase (GAPDH; bars: mean ± s.e.; n = 9/group; * p < 0.05 vs. diabetes and # p < 0.05 vs. control). (C) The myofibrillar protein breakdown was measured by actin cleavage by using western blotting in different groups of mice. Cleaved actin (14 kDa) was detected by an antibody against the c‐terminal 11 amino acids of actin. The bar graph shows the fold change of the 14‐kDa actin band compared with levels in control mice (represented by a line at one‐fold). Results are normalized to GAPDH (bars: mean ± s.e.; n = 12/group; * p < 0.05 vs. diabetes and # p < 0.05 vs. control).
We also examined proteins that are related to IGF‐1 signalling pathway because of their roles in regulating muscle protein turnover. Diabetes decreased Akt phosphorylation (pAkt), whereas PTEN, an antagonist of Akt activation and negative regulator of muscle mass, was increased 1.8‐fold in diabetic muscle compared with controls. Consistent with these findings, the level of phosphorylated FoxO1 was decreased in diabetic mice (Figure 2B). Two FoxO1 transcriptional‐regulated proteins, TRIM63/MuRF1 and FBXO32/atrogin‐1, were significantly increased. All of these responses were attenuated in the muscles of diabetic mice injected with AAV‐miR‐23a∼27a∼24‐2 (Figure 2B). Diabetes also increases the production a 14‐kDa peptide of actin that is cleaved by activated caspase‐3; this peptide fragment serves as a marker for myofibrillar protein degradation in catabolic diseases.21, 27, 28 Consistently with our earlier reports, diabetes increased the amount of this 14‐kDa actin fragment three‐fold compared with normal mice, and rAAV‐miR‐23a∼27a∼24‐2 reduced the appearance of the actin fragment (Figure 2C). Because fibrosis can lead to a reduction in muscle strength, we also tested for evidence of muscle fibrosis by Masson's trichrome staining of muscle cross sections. No significant collagen deposition was seen in diabetic muscle, regardless of whether they were injected with AAV‐miR‐23a∼27a∼24‐2 or not (Figure S1). These results suggest that exogenous miR‐23a/27a‐mediated up‐regulation of Akt phosphorylation, inhibition of E3 ubiquitin ligases, and attenuation of the diabetes‐induced myofibrillar protein degradation contribute to the improvement in muscle proteostasis.
Exogenous miR‐23a/27a suppresses myostatin signalling
Increased expression of myostatin is often associated with loss of muscle mass in chronic wasting conditions (e.g., diabetes or CKD).14, 29 As expected, the mRNA expression of myostatin, TRIM63/MuRF1, and FBXO32/atrogin‐1 mRNA were increased in the muscle of diabetic mice (Figure 3A). Similarly, the protein abundance of myostatin, phosphorylation of SMAD2/3, and signalling proteins downstream of myostatin were also increased (Figure 3B). Ectopic expression of the miR‐23a∼27a∼24‐2 precursor significantly suppresses the increase in both myostatin mRNA and protein in diabetic mice (Figure 3A and B). Provision of the miR‐23a/27a precursor normalized the amounts of phosphorylated SMAD2/3 in diabetic muscle.
Figure 3.
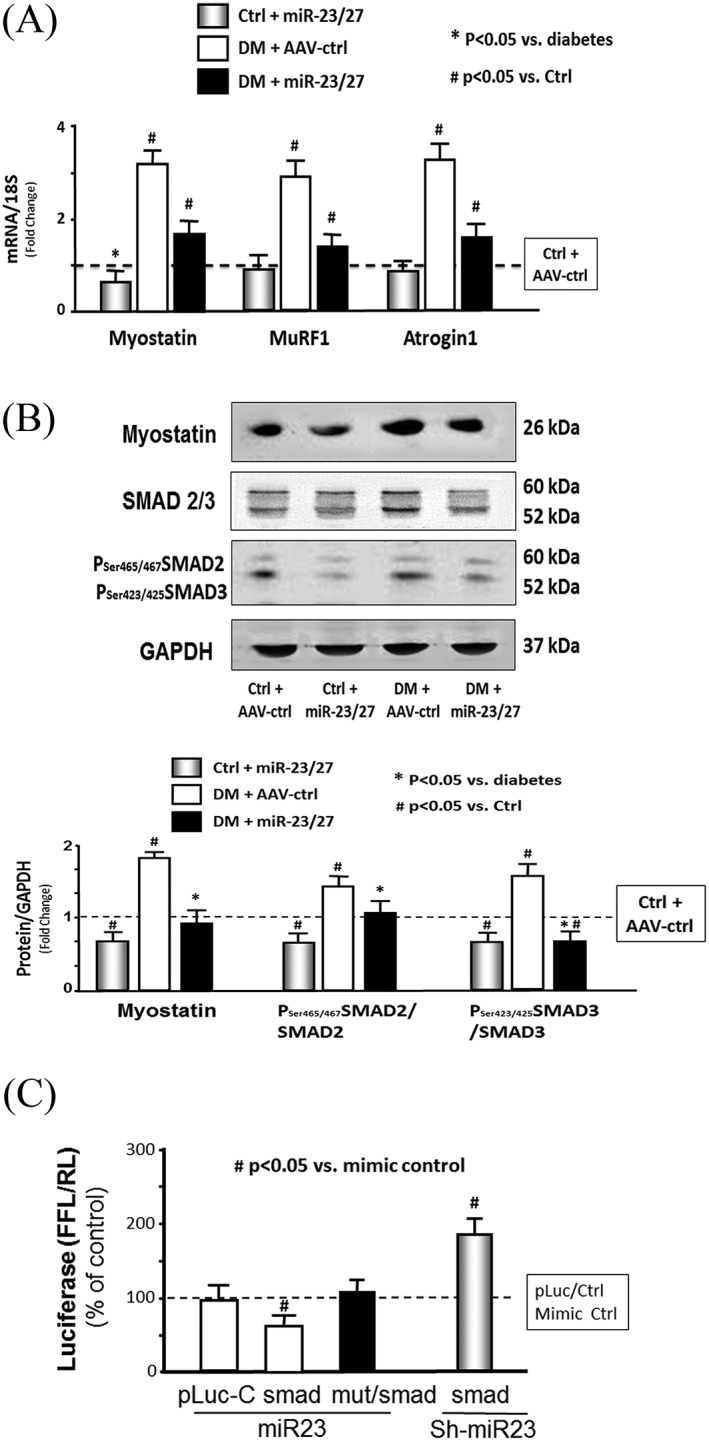
Exogenous microRNA (miR)‐23a/27a repressed myostatin miR and protein. (A) Total RNA was extracted from tibialis anterior (TA) muscle of control plus adeno‐associated virus (AAV)‐green fluorescent protein (AAV‐ctrl), control plus AAV‐miR‐23a/27a, diabetes (DM) plus AAV‐ctrl, and DM plus AAV‐miR‐23a/27a mice. The expressions of myostatin, TRIM63/MuRF1, and FBXO32/atrogin‐1 were assayed by real‐time quantitative polymerase chain reaction. The bar graph shows myostatin expression from the TA muscle of each group of mice compared with levels in control mice (represented by a line at one‐fold). Results are normalized to 18S (bars: mean ± s.e.; n = 9/group; * p < 0.05 vs. diabetes and # p < 0.05 vs. control). (B) Myostatin, SMAD 2/3, and phosphorylated SMAD 2/3 (pSer465 or pSer223 SMAD2/3) were measured by western blotting in TA muscle lysates from different group mice. The bar graph shows total myostatin (left group) or the ratios of each phospho‐SMAD to total SMAD protein. The fold change of the each protein band or ratio is compared with levels in control mice (represented by a line at one‐fold). All band densities were normalized to density of glyceraldehyde 3‐phosphate dehydrogenase (bars: mean ± s.e.; n = 9/group; * p < 0.05 vs. control and # p < 0.05 vs. chronic kidney disease). (C) miR‐23a/27a binding on 3′‐UTR of SMAD‐3 and inhibition of SMAD3 translation. Muscle progenitor cells (myotubes) were transfected with pLuc‐ctrl, pMIR‐SMAD3/1227–1303 (SMAD) with miR‐23‐mimic (miR‐23) or miR‐23‐inhibitor (sh‐miR‐23). Luciferase activity in myotubes that received the pLuc‐ctrl with control mimic was designated as the 100% (presented by a horizontal line in the graph). The other bars show the response of the myotubes to miR‐23 or sh‐miR‐23 expressed as a per cent of the control. Triplicate determinations were made in each condition, and each experiment was repeated a total of three times; the firefly luciferase results were normalized by renilla luciferase activity. Data: mean ± s.e. (n = 9; # p < 0.05 vs. mimic‐ctrl).
While analysing the SMAD2/3 data, we noted that both the phosphorylation and amount of SMAD3 protein were increased by diabetes (Figure 3B). An in silico analysis of the 3′‐UTR of SMAD3 predicted a highly conserved binding site for miR‐23a. To experimentally confirm that miR‐23a interacts with the SMAD3 mRNA, the miR‐23a SMAD3 target site (1267 to 1273 nt) was cloned into a 3′‐UTR luciferase reporter construct (pLUC‐SMAD3) and transfected into muscle satellite cells. When transfected cells were incubated with a mouse miR‐23a mimetic (mmu‐miR‐23a), luciferase activity was decreased, and the response was blocked by mutating the miR‐23a binding site. Incubation of transfected cells with an miR‐23a inhibitor (mmu‐miR‐23a–hairpin inhibitor) produced an increase in luciferase activity (Figure 3C). These results are consistent with the observed decrease in SMAD3 protein abundance in muscle injected with AAV‐miR‐23a∼27a∼24‐2 (Figure 3B) and suggest that miR‐23a overexpressed by the virus ameliorates diabetes‐induced muscle atrophy, in part, by suppressing myostatin and SMAD3 expression.
Overexpression of miR‐23a/27a in muscle attenuates renal fibrosis lesions
In both patients and experimental animals, renal fibrosis lesion is a consequence of diabetes.30, 31 During the study, we noted that the BUN of diabetic mice was increased, indicating that they had renal damage. Curiously, the BUN of diabetic mice following intramuscular injection of AAV‐miR‐23a∼27a∼24‐2 was significantly reduced (Figure 4A, left). In diabetic mice, serum creatinine was also decreased in overexpressing miR‐23‐27 mice compared with control AAV treatment (Figure 4A, right). Consistent with the elevated BUN, Masson's trichrome staining of kidney paraffin sections of diabetic mice revealed that collagen deposition was increased (Figure 4B). This was accompanied by elevated amounts of αSMA, fibronectin, vimentin, collagen4α1, and collagen1α1 (Figure 4C), as well as TGF‐β, total, and phosphorylation of SMAD2 and SMAD3 (pSMAD2 and pSMAD3) (Figure 4D). Moreover, the increases in collagen staining and fibrosis‐related proteins were significantly attenuated in diabetic mice receiving the intramuscular injection of AVV‐miR‐23a∼27a∼24‐2, relative to untreated diabetic mice (Figure 4B and C). Both total SMAD3 levels and phosphorylation of SMAD3 were reduced in diabetic mice provisioned with miR‐23a/27a. Exogenous miR‐23a/27a also decreased the ratio of pSMAD2/3 to total SMAD2/3 (Figure 4D). These findings suggest that overexpression of miR‐23a/27a in muscle somehow ameliorates kidney fibrosis lesions in diabetic mice.
Figure 4.
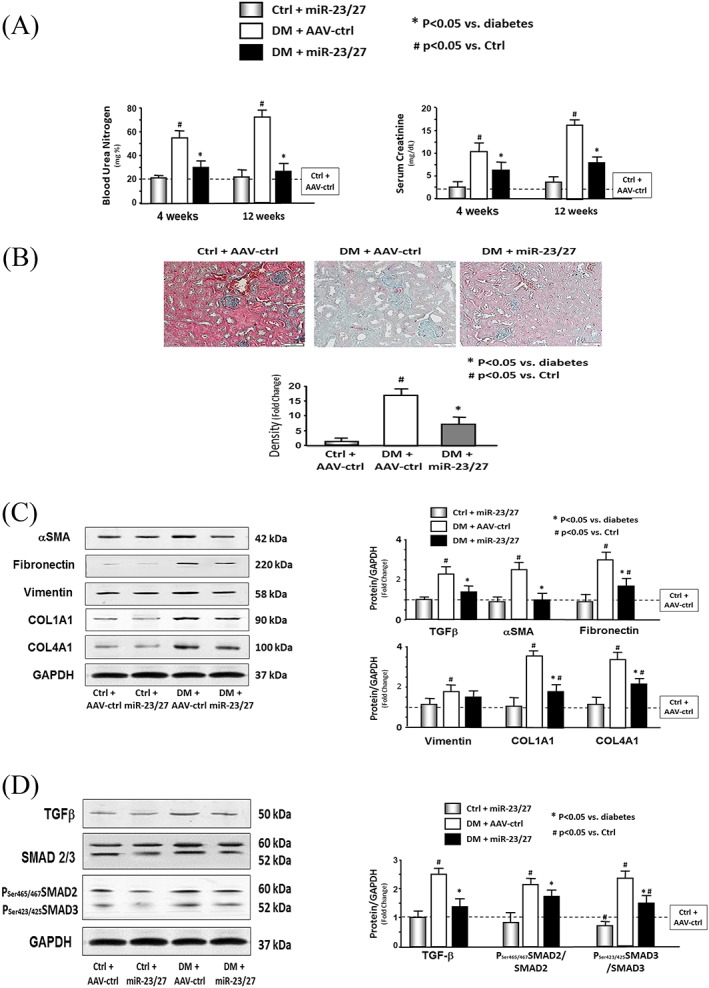
Exogenous microRNA (miR)‐23a/27a ameliorated kidney fibrosis. (A) Blood urea nitrogen (BUN) and serum creatinine were measured at different time periods by using BUN kinetic procedure kit or serum creatinine detection kit in serum of control plus adeno‐associated virus (AAV)‐green fluorescent protein (AAV‐ctrl), control plus AAV‐miR‐23a/27a, diabetes (DM) plus AAV‐ctrl, and DM plus AAV‐miR‐23a/27a mice. The bar graph shows the BUN (left) and creatinine (right) levels in each group compared with levels in control mice (represented by a line at one‐fold) (bars: mean ± s.e.; n = 6/group; * p < 0.05 vs. diabetes and # p < 0.05 vs. control). (B) Shown are representative Masson's trichrome staining of paraffin‐sections from kidneys of different groups of mice. The bar graph shows collagen amount (blue colour) measured by the CellSens Dimension 1.9 software. Results show the fold change compared with control levels defined as one‐fold (bars: mean ± s.e.; n = 6/group; * p < 0.05 vs. control). (C) The fibrosis‐related protein αSMA, fibronectin, vimentin, collagen 1α1, and collagen 4α1 were measured by western blotting in kidney lysates from different groups of mice. The bar graph shows the fold change of the each protein band compared with levels in control mice (represented by a line at one‐fold) (bars: mean ± s.e.; n = 9/group; * p < 0.05 vs. diabetes and # p < 0.05 vs. control). (D) The protein fibrosis‐related protein TGFβ, SMAD2/3, and phospho‐SMAD2/3 were measured by western blotting in kidney lysates from different group mice. The bar graph shows the fold change of the each protein band compared with levels in control mice (represented by a line at one‐fold) (bars: mean ± s.e.; n = 9/group; * p < 0.05 vs. diabetes and # p < 0.05 vs. control).
Evidence of muscle–kidney cross talk
Transfer of miRNA or siRNA between cells has been reported to occur via exosomes.32 Exosomes stabilize small RNAs and facilitate their intercellular transfer to neighbouring muscle and other organs.33 To investigate the possibility that miRs (e.g. miR‐23a/27a) are processed, packaged into exosomes, and released from transduced skeletal muscle, we evaluated serum exosomes in control and diabetic mice with or without muscle injection of rAAV‐miR‐23a∼27a∼24‐2. The size of exosomes was confirmed by using NanoSight (NS300, Malvern Instruments, Inc. Westborough, MA) measurement (Figure S3). The expression of miR‐23a and miR‐27a, but not miR‐24‐2, in RNA isolated from serum exosomes was increased in both control and diabetic mice with muscular injection of rAAV‐miR‐23a∼27a∼24‐2 (Figure 5A). Consistent with a crosstalk model, the levels of mature miR‐23a and miR‐27a were also increased in the kidneys (Figure 5B). To test whether muscle‐derived exosomes are taken up by renal cells, we injected AAV‐GFP into the TA muscle of normal mice. After 2 weeks, GFP fluorescence was evaluated in the kidney, muscle, and other organs. The GFP intensity was sharply increased in both kidneys and was also visible in the non‐injected muscle, heart, liver, and lung (Figure 6A). The increase in the fluorescence intensity in kidney correlated with an increase GFP signal in the injected TA muscle (Figure 6B). This relationship was analysed by linear regression, and a significant correlation was found (r = 0.596; p < 0.001). In addition, the amount of GFP protein was increased in TA muscle, serum exosomes, and kidney in a time‐dependent manner after AAV‐GFP injection (Figure 6C). Fluorescence microscopy of frozen kidney sections suggested that the increase in GFP was predominantly localized to the interstitium, with little fluorescence specifically localized to glomeruli (Figure S2). To test whether the appearance of GFP or overexpression of miR‐23a/27a in kidney was simply due to viral escape from the injected muscle, the presence of virus inverted terminal repeat (ITR) sequences was measured in muscle, isolated serum exosome, and kidney 1 week after intramuscular injection of AAV‐GFP. ITR sequences were significantly increased in the muscle of AAV transduced mice but were not changed in DNA isolated from exosomes and kidney (Figure 6D). These results suggest that miR‐23a/27a produced in muscle could be delivered via exosome to the kidney, where they influence the fibrosis process.
Figure 5.
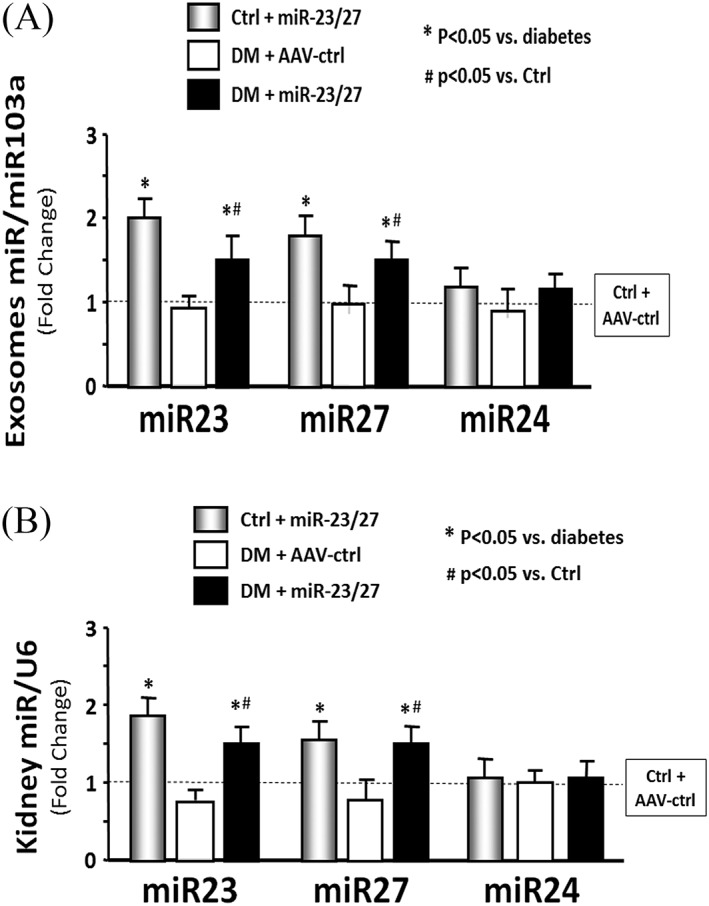
Intramuscular injection of adeno‐associated virus (AAV)‐23a~27a~24‐2 increased serum‐derived exosome size. (A) Total RNA was isolated from serum‐derived exosomes of control plus AAV‐green fluorescent protein (AAV‐ctrl), control plus AAV‐miR‐23a/27a, diabetes (DM) plus AAV‐ctrl, and DM plus AAV‐miR‐23a/27a mice. The expressions of miR‐23a‐3p, miR‐27a‐3p, and miR‐24‐2 were assayed by real‐time quantitative polymerase chain reaction. The bar graph shows miR expression from the exosomes of each group of mice compared with levels in control mice (represented by a line at one‐fold). Results are normalized to miR‐103a (bars: mean ± s.e.; n = 6/group; * p < 0.05 vs. diabetes and #p < 0.05 vs. control). (B) Total RNA was isolated from whole kidney of different groups of mice. The expressions of miR‐23a‐3p, miR‐27a‐3p, and miR‐24‐2 were assayed by real‐time quantitative polymerase chain reaction. The bar graph shows miR expression from the exosomes of each group of mice compared with levels in control mice (represented by a line at one‐fold). Results are normalized to U6 (bars: mean ± s.e.; n = 6/group; * p < 0.05 vs. diabetes and #p < 0.05 vs. control).
Figure 6.
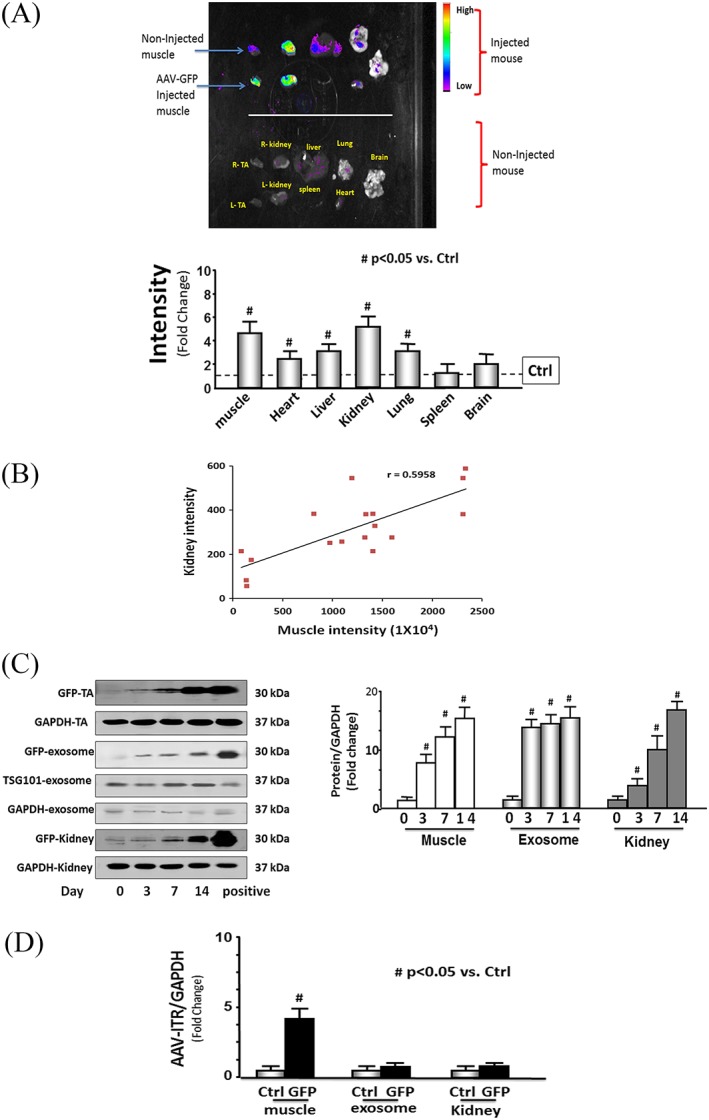
Evidence of muscle‐kidney cross talk. (A) The green fluorescent protein (GFP) distribution was determined in different organs 2 weeks after intramuscular injection of adeno‐associated virus (AAV)‐GFP in normal mice. Each organ was removed from the mice that received intramuscular injection of AAV‐GFP only in the left tibialis anterior (TA) muscle (top) and those that did not receive any injection (non‐injection) control (bottom) and the images acquired by using a Bruker small animal optical imaging system (in‐vivo Xtreme II). The bar graph shows GFP intensity from the each organ of the AAV‐GFP‐injected mice compared with levels in organs from the non‐injected control mice (represented by a line at one‐fold) (bars: mean ± s.e.; n = 3/group; * p < 0.05 vs. non‐injected controls). (B) The intensity of muscle GFP was correlated with the intensity of kidney GFP after intramuscular injection of different titres of AAV‐GFP (from 107 to 1012) into TA muscles of normal mice. The images were taken 1 week after injection by using the in‐vivo Xtreme camera system. The increase of muscle GFP intensity and the increase of kidney GFP intensity were examined by linear regression (r = 0.596; p < 0.001). Each point represents one animal (n = 17). (C) The GFP protein was measured by western blotting in kidney and muscle lysates from intramuscular AAV‐GFP‐injected normal mice at different times after injection. The muscle and kidney from GFP‐positive mice (C57BL/6J‐nnnnn(CAG‐EGFP)10sb/J) were used as the positive control. The bar graph shows the fold change of the GFP protein band (normalized to GAPDH) from muscle (left) and kidney (right) at 3, 7, and 14 days post injection in the injected mice compared with levels in non‐injected mice (day 0) (bars: mean ± s.e.; n = 6/group; # p < 0.05 vs. control). (D) The DNA was isolated from muscle and kidney from intramuscular injection of AAV‐GFP in normal mice and assayed for AAV‐virus inverted terminal repeat (ITR) by quantitative polymerase chain reaction. The level of the AAV‐ITR gene was used to identify the presence of virus. The bar graph compares the ITR levels in muscle, serum exosomes, and kidney, expressed as a fold change from levels comparable samples from non‐injected control mice. Results are normalized to glyceraldehyde 3‐phosphate dehydrogenase DNA (bars: mean ± s.e.; n = 6 and # p < 0.05 vs. controls).
Discussion
This study provides evidence that exogenous miR‐23a/27a can attenuate diabetes‐induced muscle loss and improve muscle function by up‐regulating the insulin signalling pathway and inhibiting the myostatin cascade. We also found that muscle‐derived miR‐23a/27a can reduce kidney fibrosis as illustrated by lower levels of extracellular matrix protein expression and that the mechanism includes down‐regulation of SMAD3. These results support a rationale for developing new strategies to simultaneously treat multiple complications of diabetes in muscle, kidney, and perhaps other organs.
In our study, delivery of the miR‐23a∼27a∼24‐2 precursor RNA by AAV produces both miR‐23a and miR‐27a, both of which target mRNAs that encode proteins which are relevant to the atrophy and fibrosis processes. miR‐23 targets TRIM63/MuRF1 and FBXO32/atrogin‐1, PTEN, caspase‐7, SMAD3, and RAS GTPase‐activating protein SH3 domain‐binding protein 2 (G3BP2), whereas miR‐27 targets FoxO1, SMAD2, SMAD4, and myostatin.18, 20, 34, 35, 36 We found that miR‐23a is lower in diabetic skeletal muscle, compared with controls. The decrease in miR‐23a contributes to the well‐documented increase in expression of TRIM63/MuRF1 and FBXO32/atrogin‐1 E3 ubiquitin ligases as well as dysfunctional insulin signalling (i.e., increased PTEN and decreased Akt phosphorylation).18 Furthermore, the decline in miR‐23a contributes to the observed increase in SMAD3 seen in diabetic muscle, a finding consistent with other reports that miR‐23a targets SMAD3 in chondrocytes.36 This finding is notable because Zhang et al. found that increased SMAD2/3 signalling leads to inhibition of Akt phosphorylation, activation of caspase‐3, and the ubiquitin‐proteasome system, responses that are linked to the muscle atrophy process.12, 28 Other miRs, such as miR‐328, have been linked to Inhibits renal tubular cell epithelial‐to‐mesenchymal transition in pressure‐induced renal fibrosis.37 However, there is no current evidence that altering the levels of miR‐23/27 has an influence on pressure‐related tubular fibrosis or renal epithelial‐to‐mesenchymal transition. Our finding that provision of miR‐23a to the muscle of diabetic mice via AAV‐miR‐23a∼27a∼24‐2 reversed these changes further supports the conclusion that a decrease in miR‐23a in muscle is a substantial contributing factor to the loss of muscle mass during diabetes.
The mechanism(s) responsible for the reduction of miR‐23a in skeletal muscle would include increase packaging of miR‐23a/27a into exosomes. We previously reported that miRs, including miR‐23a, are selectively packaged into exosomes which are released from cultured myotubes.19, 38 Our findings of increased miR‐23a and miR‐27a in exosomes and kidney following injection of AAV‐miR‐23a∼27a∼24‐2 into the TA muscle further support a model in which miRs are released into the circulation in exosomes (and perhaps other microvesicles) from muscle. Our data also indicate that circulating exosomes containing miR‐23a/27a are taken up by various organs including kidney. Exosomes are ideal vehicles for transporting miRs because they stabilize miR and are less immunogenic and cytotoxic than other viral or liposome‐based gene delivery vehicles.39, 40 In the case of miR‐23a/27a, this leads to an increase in the levels of these miRs and a concurrent decrease in the expression of SMAD3, its downstream signalling, and proteins associated with fibrosis. Studies with AAV‐GFP and measurements of viral ITR support this model. The fact that ITR‐DNA is not present in exosomes or kidney suggests that the virus does not travel to the other organs. This is strong evidence that the increased levels of miR‐23a/27a in kidney therefore results from miR movement from muscle to kidney, and not AAV redistribution.
Diabetic kidney disease is characterized by increased glomerular mesangial hypertrophy, matrix deposition, enhanced interstitial fibrosis, etc.41 We used AAV‐GFP to identify into which parts of the kidney the muscle‐derived exosomes localized. The predominant localization of the GFP label was to interstitial areas. While fluorescence was seen overlapping with glomeruli, there was no specific tendency to localize to these structures (Figure S2). Because diabetic nephropathy is largely a glomerular disease, determining strategies to improve miR delivery to glomeruli will require future study.
Our previous study found that miR‐23 expression was increased in skeletal muscle following resistance exercise in CKD mice and adenovirus‐mediated overexpression of miR‐23 and miR‐27 ameliorated muscle atrophy.18 Some investigators report that miR‐23 or miR‐27 is increased in skeletal and cardiac muscle in humans and rodents after exercise.42, 43 In contrast, miR‐23a is decreased in human muscle after extended bed rest.44 One study found that miR‐23 can reduce skeletal muscle atrophy by inhibition of TRIM63/MuRF1 and FBXO32/atrogin‐1.20 However, the opposing conclusion can also been found that miR‐23 is decreased in skeletal muscle following acute endurance exercise in healthy adults,45 or overexpression of miR‐23 does not inhibit muscle atrophy.46 The discordant findings could be due to different exercise models and experimental conditions. To proceed to clinical use, there is a need to further study the off‐target impact of miR‐23a/27a. Boon et al. reported that miR‐23b blocks cell cycle progression, whereas miR‐27b was shown to reduce endothelial cell repulsive signals In cultured cells.47 Given the basic processes that could be impacted, further in vivo studies are needed to confirm these effects in normal and disease conditions.
Although the evidence provided appears to rule out a virus‐mediated transfer of GFP, and presumably miR‐23a/27a, from muscle to kidney, this possibility cannot be totally excluded. There are reports of intracellular transfer of viral nucleic acid (e.g. DNA or RNA) via exosomes.48 Thus, it is possible that miR‐23a∼27a∼24‐2 precursor RNA, rather than mature miR‐23a and miR‐27a, are packaged into exosomes and transferred to the kidney, where, following uptake, the precursor is processed in renal tissues.
An additional important observation in this study is that the apparent uptake and expression of GFP are higher in kidney than other non‐muscle organs (Figure 6B). There are several possible explanations for this phenomenon. First, the AAV rep/cap trans‐plasmid that we used is pAAV2/9, which containing contains the replicase gene from AAV2 but the capsid gene from AAV9. In general, the tissue tropism for AAV‐9 is lung, liver, muscle, heart, and central nervous system. It is possible that kidney has a strong preference for AAV‐2/9, which would explain why the GFP signal is so strong in kidney relative to the other organs. Second, the kidneys have a very high blood flow. In humans, the kidneys receive 25% of cardiac output, which has 1.1‐L/min blood go through kidney in a 70‐kg adult male (total blood volume is 5.5 L). If, as we suggest, miR‐23a/27a is carried by exosomes, there will be a very high passage rate through the kidneys. Confirmation of the mechanism responsible for the enrichment of GFP and miR‐23a/27a will require additional experiments.
In summary, increasing the levels of miR‐23a and miR‐27a in muscle via AAV‐miR‐23a∼27a∼24‐2 ameliorated diabetes‐induced skeletal muscle atrophy by up‐regulating IGF1/PI3K/Akt signalling pathway and down‐regulating myostatin cascade (Figure 7). In addition, overexpression of miR‐23a and miR‐27a led to increased circulation of these miRs in exosomes, which appear to be taken up by myofibres in other muscles as well as cells in the kidneys where they had similar beneficial effects on the atrophy process and renal fibrosis, respectively. Our findings provide evidence for the existence of a beneficial cross‐talk system between skeletal muscle and other organs including kidneys. They also suggest that maintaining muscle mass provides renoprotective effects as well.
Figure 7.
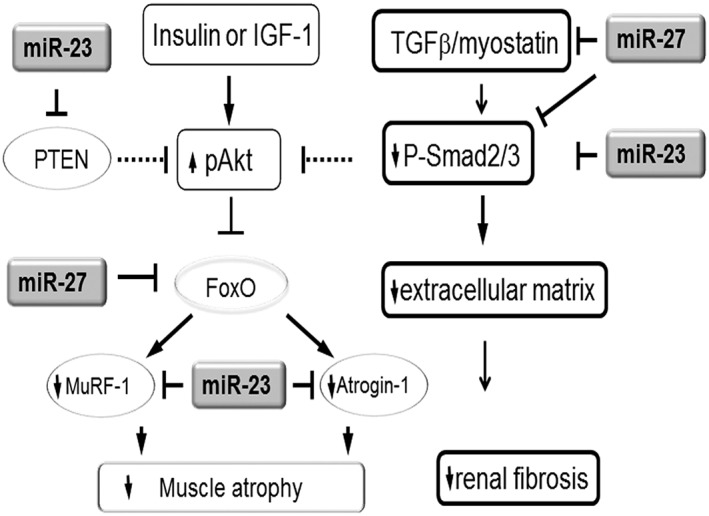
Simplified schematic showing the potential strategy for muscle‐derived miR‐23a/27a to attenuate muscle atrophy and renal fibrosis. In diabetes, the insulin/IGF‐1 signalling is down‐regulated. In a normally functioning insulin/IGF‐1 signalling pathway, miR‐23 targets the 3′‐UTR of PTEN resulting in a decrease in PTEN protein amount. The decrease in PTEN will result in increased phosphorylation of Akt, inactivation of FoxO, and inhibition of the pro‐atrophic E3 ubiquitin ligases TRIM63/MuRF1 and FBXO32/atrogin‐1 leading to blockade of muscle atrophy. Furthermore, miR‐23 directly targets MuRF1 and atrogin‐1. The decreased levels of MuRF1 and atrogin‐1 resulting from exogenous overexpression of miR‐23 and miR‐27 in a diabetic animal therefore block diabetes‐induced muscle atrophy. The decrease in kidney fibrosis in diabetic animals receiving exogenous miR‐23 and miR‐27a may result from the influence of miR‐27a and miR‐23a on the TGFβ cascade. The TGFβ/myostatin cascade is down‐regulated by miR‐23a and miR‐27a through influences on SMADs. MiR‐23a directly inhibits SMAD3 and miR‐27a directly inhibits SMAD2, the consequence of which is decreased production of extracellular matrix and decreased renal fibrosis. In addition, miR‐27a directly inhibits myostatin, which inhibits SMAD2 in a post‐transcription manner resulting in additional up‐regulation of pAkt and prevention of diabetic muscle atrophy.
Funding
Research reported in this publication was supported by the National Institute of Arthritis and Musculoskeletal and Skin Diseases (NIAMS) of the National Institutes of Health under award number R01 AR060268 and American Heart Association Discover and Innovation grant (17IBDG33780000) to X.H.W and the National Institutes of Health grant R01 DK095610 (to S.R.P.), VA MERIT grant I01‐BX001456 (to S.R.P.), and Jangsu Province Science Foundation of China grants BK20161071 and BK20161599 (to A. Z). This research project was also supported in part (production of AAV virus) by the Viral Vector Core of the Emory Neuroscience NINDS Core Facilities grant, P30NS055077, and in part (AAV virus and luciferase constructs) by the Emory Integrated Genomics Core (EIGC), which is subsidized by the Emory University School of Medicine and is one of the Emory Integrated Core Facilities under National Institutes of Health award number UL1TR000454.
Conflict of interest
None declared.
Ethical standard statements
(1) The authors certify that they comply with the ethical guidelines for publishing in the Journal of Cachexia, Sarcopenia, and Muscle.49 (2) All animal studies were approved by the Institutional Animal Care and Use Committee of Emory University (protocol 2002853) and were performed in accordance with the ethical standards laid down in the 1964 Declaration of Helsinki and its later amendments.
Supporting information
Figure S1. Shown are representative Masson's Trichrome staining of paraffin‐sections from TA muscle from control plus AAV‐GFP, control plus AAV‐miR‐23a/27a, diabetes plus AAV‐GFP and diabetes plus AAV‐miR‐23a/27a mice. The bar graph show collagen amount (blue color), measured by the CellSens Dimension 1.9 with count & measure Software, from the muscle of each group of mice as a fold change relative to controls as 1‐fold (Bars: mean ± s.e.; n = 6/group; * = p < 0.05 vs. control).
Figure S2. Shown are representative frozen sections of kidney from normal control mice that had muscles transduced with AAV‐GFP. The right panel shows fluorescence microscopy to detect GFP expression in the kidney section; the left panel is a bright‐field microscopic image of the same field (bar: 100 um).
Figure S3. Exosomes were isolated from the serum of control mouse. The exosome size and concentration was measured by NanoSigth Instruments. The bar graphs show size (nanometer diameter) of exosomes from serum of 3 of mice (Bars: mean ± s.e.; n = 3/group).
Acknowledgements
Dr Xiaonan Wang is the guarantor of this work and, as such, had full access to all the data in the study and takes responsibility for the integrity of the data and the accuracy of the data analysis. We thank Dr Takayuki Akimoto (The University of Tokyo, Tokyo, Japan) for providing the luciferase 3′UTR vectors,20 Dr Darin Falk from University of Florida, and Penn Vector Core of University of Pennsylvania for the AAV constructs. The content is solely the responsibility of the authors and does not necessarily reflect the official views of the NIH, the Department of Veterans Affairs, or the US Government.
Zhang, A. , Li, M. , Wang, B. , Klein, J. D. , Price, S. R. , and Wang, X. H. (2018) miRNA‐23a/27a attenuates muscle atrophy and renal fibrosis through muscle‐kidney crosstalk. Journal of Cachexia, Sarcopenia and Muscle, 9: 755–770. 10.1002/jcsm.12296.
References
- 1. Avram MM, Mittman N. Malnutrition in uremia. Semin Nephrol 1994;14:238–244. [PubMed] [Google Scholar]
- 2. Griffiths RD. Muscle mass, survival, and the elderly ICU patient. Nutrition 1996;12:456–458. [DOI] [PubMed] [Google Scholar]
- 3. Windsor JA, Hill GL. Risk factors for postoperative pneumonia. The importance of protein depletion. Ann Surg 1988;208:209–214. [DOI] [PMC free article] [PubMed] [Google Scholar]
- 4. Wang XH, Mitch WE. Mechanisms of muscle wasting in chronic kidney disease. Nat Rev Nephrol 2014;10:504–516. [DOI] [PMC free article] [PubMed] [Google Scholar]
- 5. Song YH, Li Y, Du J, Mitch WE, Rosenthal N, Delafontaine P. Muscle‐specific expression of IGF‐1 blocks angiotensin II‐induced skeletal muscle wasting. J Clin Invest 2005;115:451–458. [DOI] [PMC free article] [PubMed] [Google Scholar]
- 6. Silva KA, Dong J, Dong Y, Schor N, Tweardy DJ, Zhang L, et al. Inhibition of Stat3 activation suppresses caspase‐3 and the ubiquitin‐proteasome system, leading to preservation of muscle mass in cancer cachexia. J Biol Chem 2015;290:11 177–11 187. [DOI] [PMC free article] [PubMed] [Google Scholar]
- 7. Reutens AT, Atkins RC. Epidemiology of diabetic nephropathy. Contrib Nephrol 2011;170:1–7. [DOI] [PubMed] [Google Scholar]
- 8. Shahbazian H, Rezaii I. Diabetic kidney disease; review of the current knowledge. J Renal Inj Prev 2013;2:73–80. [DOI] [PMC free article] [PubMed] [Google Scholar]
- 9. Wang X, Hu Z, Hu J, Du J, Mitch WE. Insulin resistance accelerates muscle protein degradation: activation of the ubiquitin‐proteasome pathway by defects in muscle cell signaling. Endocrinology 2006;147:4160–4168. [DOI] [PubMed] [Google Scholar]
- 10. Price SR, Bailey JL, Wang X, Jurkovitz C, England BK, Ding X, et al. Muscle wasting in insulinopenic rats results from activation of the ATP‐dependent, ubiquitin‐proteasome proteolytic pathway by a mechanism including gene transcription. J Clin Invest 1996;98:1703–1708. [DOI] [PMC free article] [PubMed] [Google Scholar]
- 11. Han HQ, Mitch WE. Targeting the myostatin signaling pathway to treat muscle wasting diseases. Curr Opin Support Palliat Care 2011;5:334–341. [DOI] [PMC free article] [PubMed] [Google Scholar]
- 12. Massague J, Seoane J, Wotton D. Smad transcription factors. Genes Dev 2005;19:2783–2810. [DOI] [PubMed] [Google Scholar]
- 13. Kornegay JN, Bogan DJ, Bogan JR, Dow JL, Wang J, Fan Z, et al. Dystrophin‐deficient dogs with reduced myostatin have unequal muscle growth and greater joint contractures. Skelet Muscle 2016;6:14. [DOI] [PMC free article] [PubMed] [Google Scholar]
- 14. Zhang L, Rajan V, Lin E, Hu Z, Han HQ, Zhou X, et al. Pharmacological inhibition of myostatin suppresses systemic inflammation and muscle atrophy in mice with chronic kidney disease. FASEB J 2011;25:1653–1663. [DOI] [PMC free article] [PubMed] [Google Scholar]
- 15. Wang XH, Hu Z, Klein JD, Zhang L, Fang F, Mitch WE. Decreased miR‐29 suppresses myogenesis in CKD. J Am Soc Nephrol 2011;22:2068–2076. [DOI] [PMC free article] [PubMed] [Google Scholar]
- 16. Zhang Y, Wang JH, Zhang YY, Wang YZ, Wang J, Zhao Y, et al. Deletion of interleukin‐6 alleviated interstitial fibrosis in streptozotocin‐induced diabetic cardiomyopathy of mice through affecting TGFbeta1 and miR‐29 pathways. Sci Rep 2016;6:23010. [DOI] [PMC free article] [PubMed] [Google Scholar]
- 17. Wang XH. MicroRNA in myogenesis and muscle atrophy. Curr Opin Clin Nutr Metab Care 2013;16:258–266. [DOI] [PMC free article] [PubMed] [Google Scholar]
- 18. Wang B, Zhang C, Zhang A, Cai H, Price SR, Wang XH. MicroRNA‐23a and microRNA‐27a mimic exercise by ameliorating CKD‐induced muscle atrophy. J Am Soc Nephrol 2017;28:2631–2640. [DOI] [PMC free article] [PubMed] [Google Scholar]
- 19. Hudson MB, Woodworth‐Hobbs ME, Zheng B, Rahnert JA, Blount MA, Gooch JL, et al. miR‐23a is decreased during muscle atrophy by a mechanism that includes calcineurin signaling and exosome‐mediated export. Am J Physiol Cell Physiol 2014;306:C551–C558. [DOI] [PMC free article] [PubMed] [Google Scholar]
- 20. Wada S, Kato Y, Okutsu M, Miyaki S, Suzuki K, Yan Z, et al. Translational suppression of atrophic regulators by microRNA‐23a integrates resistance to skeletal muscle atrophy. J Biol Chem 2011;286:38 456–38 465. [DOI] [PMC free article] [PubMed] [Google Scholar]
- 21. Wang XH, Hu J, Du J, Klein JD. X‐chromosome linked inhibitor of apoptosis protein inhibits muscle proteolysis in insulin‐deficient mice. Gene Ther 2007;14:711–720. [DOI] [PMC free article] [PubMed] [Google Scholar]
- 22. Hu L, Klein JD, Hassounah F, Cai H, Zhang C, Xu P, et al. Low‐frequency electrical stimulation attenuates muscle atrophy in CKD—a potential treatment strategy. J Am Soc Nephrol 2015;26:626–635. [DOI] [PMC free article] [PubMed] [Google Scholar]
- 23. Zhou Q, Du J, Hu Z, Walsh K, Wang XH. Evidence for adipose‐muscle cross talk: opposing regulation of muscle proteolysis by adiponectin and fatty acids. Endocrinology 2007;148:5696–5705. [DOI] [PubMed] [Google Scholar]
- 24. Su Z, Robinson A, Hu L, Klein JD, Hassounah F, Li M, et al. Acupuncture plus low‐frequency electrical stimulation (Acu‐LFES) attenuates diabetic myopathy by enhancing muscle regeneration. PLoS One. 2015;10:e0134511. [DOI] [PMC free article] [PubMed] [Google Scholar]
- 25. Su Z, Hu L, Cheng J, Klein JD, Hassounah F, Cai H, et al. Acupuncture plus low‐frequency electrical stimulation (Acu‐LFES) attenuates denervation‐induced muscle atrophy. J Appl Physiol 1985; 2015:jap 00175 2015. [DOI] [PMC free article] [PubMed] [Google Scholar]
- 26. Du J, Klein JD, Hassounah F, Zhang J, Zhang C, Wang XH. Aging increases CCN1 expression leading to muscle senescence. Am J Physiol Cell Physiol 2014;306:C28–C36. [DOI] [PMC free article] [PubMed] [Google Scholar]
- 27. Workeneh BT, Rondon‐Berrios H, Zhang L, Hu Z, Ayehu G, Ferrando A, et al. Development of a diagnostic method for detecting increased muscle protein degradation in patients with catabolic conditions. J Am Soc Nephrol 2006;17:3233–3239. [DOI] [PubMed] [Google Scholar]
- 28. Du J, Wang X, Miereles C, Bailey JL, Debigare R, Zheng B, et al. Activation of caspase‐3 is an initial step triggering accelerated muscle proteolysis in catabolic conditions. J Clin Invest 2004;113:115–123. [DOI] [PMC free article] [PubMed] [Google Scholar]
- 29. Zhang L, Pan J, Dong Y, Tweardy DJ, Garibotto G, Mitch WE. Stat3 activation links a C/EBPdelta to myostatin pathway to stimulate loss of muscle mass. Cell Metab 2013;18:368–379. [DOI] [PMC free article] [PubMed] [Google Scholar]
- 30. Mauer SM, Steffes MW, Ellis EN, Sutherland DE, Brown DM, Goetz FC. Structural‐functional relationships in diabetic nephropathy. J Clin Invest 1984;74:1143–1155. [DOI] [PMC free article] [PubMed] [Google Scholar]
- 31. Ziyadeh FN, Goldfarb S. The renal tubulointerstitium in diabetes mellitus. Kidney Int 1991;39:464–475. [DOI] [PubMed] [Google Scholar]
- 32. Pan Q, Ramakrishnaiah V, Henry S, Fouraschen S, de Ruiter PE, Kwekkeboom J, et al. Hepatic cell‐to‐cell transmission of small silencing RNA can extend the therapeutic reach of RNA interference (RNAi). Gut 2012;61:1330–1339. [DOI] [PubMed] [Google Scholar]
- 33. Robbins PD, Morelli AE. Regulation of immune responses by extracellular vesicles. Nat Rev Immunol 2014;14:195–208. [DOI] [PMC free article] [PubMed] [Google Scholar]
- 34. Fuchs H, Theuser M, Wruck W, Adjaye J. miR‐27 negatively regulates pluripotency‐associated genes in human embryonal carcinoma cells. PLoS One. 2014;9: e111637. [DOI] [PMC free article] [PubMed] [Google Scholar]
- 35. Chae DK, Ban E, Yoo YS, Kim EE, Baik JH, Song EJ. MIR‐27a regulates the TGF‐beta signaling pathway by targeting SMAD2 and SMAD4 in lung cancer. Mol Carcinog 2017;56:1992–1998. [DOI] [PubMed] [Google Scholar]
- 36. Zhao B, Li H, Liu J, Han P, Zhang C, Bai H, et al. MicroRNA‐23b targets Ras GTPase‐activating protein SH3 domain‐binding protein 2 to alleviate fibrosis and albuminuria in diabetic nephropathy. J Am Soc Nephrol 2016;27:2597–2608. [DOI] [PMC free article] [PubMed] [Google Scholar]
- 37. Chen CH, Cheng CY, Chen YC, Sue YM, Liu CT, Cheng TH, et al. MicroRNA‐328 inhibits renal tubular cell epithelial‐to‐mesenchymal transition by targeting the CD44 in pressure‐induced renal fibrosis. PLoS One 2014;9: e99802. [DOI] [PMC free article] [PubMed] [Google Scholar]
- 38. Fry CS. Tiny transporters: how exosomes and calcineurin signaling regulate miR‐23a levels during muscle atrophy. Focus on “miR‐23a is decreased during muscle atrophy by a mechanism that includes calcineurin signaling and exosome‐mediated export”. Am J Physiol Cell Physiol 2014;306:C529–C530. [DOI] [PubMed] [Google Scholar]
- 39. Valadi H, Ekstrom K, Bossios A, Sjostrand M, Lee JJ, Lotvall JO. Exosome‐mediated transfer of mRNAs and microRNAs is a novel mechanism of genetic exchange between cells. Nat Cell Biol 2007;9:654–659. [DOI] [PubMed] [Google Scholar]
- 40. O'Loughlin AJ, Woffindale CA, Wood MJ. Exosomes and the emerging field of exosome‐based gene therapy. Curr Gene Ther 2012;12:262–274. [DOI] [PubMed] [Google Scholar]
- 41. Reidy K, Kang HM, Hostetter T, Susztak K. Molecular mechanisms of diabetic kidney disease. J Clin Invest 2014;124:2333–2340. [DOI] [PMC free article] [PubMed] [Google Scholar]
- 42. Fernandes T, Hashimoto NY, Magalhaes FC, Fernandes FB, Casarini DE, Carmona AK, et al. Aerobic exercise training‐induced left ventricular hypertrophy involves regulatory MicroRNAs, decreased angiotensin‐converting enzyme‐angiotensin ii, and synergistic regulation of angiotensin‐converting enzyme 2‐angiotensin (1‐7). Hypertension 2011;58:182–189. [DOI] [PMC free article] [PubMed] [Google Scholar]
- 43. Camera DM, Ong JN, Coffey VG, Hawley JA. Selective modulation of microRNA expression with protein ingestion following concurrent resistance and endurance exercise in human skeletal muscle. Frontiers in physiology 2016;7:87. [DOI] [PMC free article] [PubMed] [Google Scholar]
- 44. Rezen T, Kovanda A, Eiken O, Mekjavic IB, Rogelj B. Expression changes in human skeletal muscle miRNAs following 10 days of bed rest in young healthy males. Acta Physiol (Oxf) 2014. [DOI] [PubMed] [Google Scholar]
- 45. Russell AP, Lamon S, Boon H, Wada S, Guller I, Brown EL, et al. Regulation of miRNAs in human skeletal muscle following acute endurance exercise and short‐term endurance training. J Physiol 2013;591:4637–4653. [DOI] [PMC free article] [PubMed] [Google Scholar]
- 46. Wada S, Kato Y, Sawada S, Aizawa K, Park JH, Russell AP, et al. MicroRNA‐23a has minimal effect on endurance exercise‐induced adaptation of mouse skeletal muscle. Pflugers Arch 2014. [DOI] [PubMed] [Google Scholar]
- 47. Boon RA, Hergenreider E, Dimmeler S. Atheroprotective mechanisms of shear stress‐regulated microRNAs. Thromb Haemost 2012;108:616–620. [DOI] [PubMed] [Google Scholar]
- 48. Sampey GC, Saifuddin M, Schwab A, Barclay R, Punya S, Chung MC, et al. Exosomes from HIV‐1‐infected cells stimulate production of pro‐inflammatory cytokines through trans‐activating response (TAR) RNA. J Biol Chem 2016;291:1251–1266. [DOI] [PMC free article] [PubMed] [Google Scholar]
- 49. von Haehling S, Morley JE, Coats AJS, Anker SD. Ethical guidelines for publishing in the Journal of Cachexia, Sarcopenia and Muscle: update 2017. J Cachexia Sarcopenia Muscle 2017;8:1081–1083. [DOI] [PMC free article] [PubMed] [Google Scholar]
Associated Data
This section collects any data citations, data availability statements, or supplementary materials included in this article.
Supplementary Materials
Figure S1. Shown are representative Masson's Trichrome staining of paraffin‐sections from TA muscle from control plus AAV‐GFP, control plus AAV‐miR‐23a/27a, diabetes plus AAV‐GFP and diabetes plus AAV‐miR‐23a/27a mice. The bar graph show collagen amount (blue color), measured by the CellSens Dimension 1.9 with count & measure Software, from the muscle of each group of mice as a fold change relative to controls as 1‐fold (Bars: mean ± s.e.; n = 6/group; * = p < 0.05 vs. control).
Figure S2. Shown are representative frozen sections of kidney from normal control mice that had muscles transduced with AAV‐GFP. The right panel shows fluorescence microscopy to detect GFP expression in the kidney section; the left panel is a bright‐field microscopic image of the same field (bar: 100 um).
Figure S3. Exosomes were isolated from the serum of control mouse. The exosome size and concentration was measured by NanoSigth Instruments. The bar graphs show size (nanometer diameter) of exosomes from serum of 3 of mice (Bars: mean ± s.e.; n = 3/group).