

Abstract
The high performance and small size of MEMS based scanners has allowed various optical imaging techniques to be realized in a small form factor. Many such devices are resonant scanners, and thus their linear and nonlinear dynamic behaviors have been studied in the past. Thin-film piezoelectric materials, in contrast, provide sufficient energy density to achieve both large static displacements and high-frequency resonance, but large deformation can in turn influence dynamic scanner behavior. This paper reports on the influence of very large stroke translation of a piezoelectric vertical actuator on its resonant behavior, which may not be otherwise explained fully by common causes of resonance shift such as beam stiffening or nonlinear forcing. To examine the change of structural compliance over the course of scanner motion, a model has been developed that includes internal forces from residual stress and the resultant additional multi-axis coupling among actuator leg structures. Like some preceding vertical scanning micro-actuators, the scanner of this work has four legs, with each leg featuring four serially connected thin-film PZT unimorphs that allow the scanner to generate larger than 400μm of vertical displacement at 14VDC. Using an excitation near one or more resonances, the input voltage can be lowered, and complementary multi-axis rotations can be also generated, but change of the resonant frequencies with scanner height needs to be understood to maximize scanner performance. The presented model well predicts the experimental observation of the decrease of the resonant frequencies of the scanner with the increase of a dc bias voltage. Also, the effects of the magnitude and uniformity of residual stress across the scanner structure on the natural frequencies have been studied.
1. Introduction
Optical imaging is one of the many fields that have benefited from miniaturized integrated systems based on microelectro-mechanical system (MEMS) technology. For instance, MEMS based scanners that can provide large scan range with high dynamic bandwidth in small form factors have made substantial impact in various applications, such as biomedical imaging [1–3], portable projectors [4–5], and high-resolution displays [6–7].
Many of the MEMS scanners in these applications are designed to be operated at resonance to meet high performance requirements such as large and fast deflection [2–7]. Better performance near resonance can also allow low voltage input or non-hermetic packaging. For proper resonant mode operation, the dynamic behavior of a device such as mode coupling and resonant frequencies needs to be characterized.
Due to their large energy densities, thin-film piezoelectric materials have potential to achieve similar performance to resonant optical scanners under static conditions, or to dramatically reduce voltage requirements during resonant operation. Static and resonant operation may even be mixed, targeting resonant motion in certain axes to complement specific static translations or rotations. To find the best operating strategy for large deflection scanning actuators capable of static or resonant operation, it is necessary to understand the influence of large translations or rotations on actuator dynamics.
This paper reports the experimental observation and modeling of the shift of the natural frequency, due to dc bias voltage, of a large displacement piezoelectric microscanner that has symmetric serpentine springs, one of the common spring designs in MEMS devices. The micro-scanner in this work was previously designed to be incorporated into endoscopic microscopes for real-time in vivo deep into-tissue scanning for early diagnosis of mucosal diseases [8–9]. Early detection of colorectal cancer, for example, requires an endoscope compatible scanning mechanism to enable a deep (400~500μm) optical sectioning with a resolution of 5 μm at least at 4 Hz [10]. Earlier, it was reported that the prototype micro-scanners similar to shown in figure 1 could closely meet the high performance requirements for this application (> 400 μm in displacement, > 100 Hz in natural frequency, < 5 mm in diameter in size) [11]. This scanner is actuated by four PZT bending legs where each leg provides vertical translation for one corner of its central rectangular-shaped scanning stage, allowing a three-axis (vertical translation in z-axis, rotation about x- and y-axis) motion for the stage.
Figure 1.

Optical images of prototype actuators, and definitions of legs and beams.
Due to its symmetric design, these scanners are sensitive to non-ideal fabrication outcomes that cannot be perfectly eliminated, such as dimensional variation and non-uniform residual stress. This problem can be solved by using a differential drive [9] with feedback control, or limiting actuation to individual frequencies where a combination of different modes produces a desired motion, such as pure vertical motion [12]. Resonant mode operation in one or more axes is often advantageous because large displacement can be obtained at even lower voltage, but the coupling of different vibration modes and shift of natural frequencies as static deflections and operating conditions change need to be characterized and understood.
The shift of the resonant frequencies of MEMS devices is not uncommon, and it has been a topic of interest for the researchers in the MEMS community. For example, the variation of the natural frequency of electrostatic actuators due to a peak-to-peak and dc bias voltage has been reported with a model that includes of nonlinear electrostatic force to explain the behaviors [13–14]. Actuators that use the electrostatic force generated by asymmetric comb-drive designs and thus can tune their resonance by a dc bias have been developed [15–16]. Detailed beam models were also presented to describe nonlinearities related to the stiffening and softening of the springs of electrostatic resonators [17–19]. Using beam models, Soma et al. proposed a method to measure residual stress on electrostatically actuated microbeams using frequency shift curves experimentally obtained at different dc bias voltages [20]. Among piezoelectric MEMS devices, vibration energy harvesters that can tune the resonance frequency by a preload [21] or nonlinear strain stiffening effect [22] have been developed.
An electrothermal actuator that has a similar design to the device of this work also showed a trend of decreasing resonant frequency with the increase of a bias voltage [1], and the authors stated that the shift was due to the temperature dependent property of Young’s modulus and the stiffness change of the bimorphs, although no model was provided for the shift. A more pronounced decrease of the resonant frequencies as the offset voltage increases has been observed from the thin-film PZT micro-scanner of this work. The findings of the aforementioned studies on similar behaviors, such as frequency-dependent material properties and stiffened beams, could have caused the phenomena, but the shift observed here is too large to be solely explained by them, as some cases the natural frequency decreased more than 30%.
Instead of associating nonlinearities only with a single element such as a beam as in some of the previous work, a nonlinear change of the structural compliance during the motion of an actuator can be considered. For example, [23] investigated the variation of the rotation-mode resonant frequency of a two-axes piezoelectric actuator that can perform an active vertical (z-axis direction) and passive rotational (about y-axis) scan simultaneously with its inner and outer frames connected by a set of short cantilevers. In that paper, the coupling of the resonance of the inner frame with the lateral compliance of the outer frame as a function of the outer frame’s vertical motion was modeled. Similar to many other works mentioned above, that model also assumed perfect symmetric spring structures and neglected the residual stress.
Relating nonlinearities to structural behavior at large displacements, this paper analyzes how the stiffness of the scanner changes in multiple directions due to fabrication-related non-idealities as its position changes and then examines its effect on the resonant frequencies. Building on the authors’ previous work [9] that analyzed static behavior or linear dynamics about a single operating point [12], the stiffness of the legs of the micro-scanner are modeled in multiple axes to capture coupled motion in different directions. The non-idealities taken into consideration in the presented model include non-uniform residual stress on the beams and an asymmetrically perturbed stage. Varying initial deflections of the sample devices shown in figure 1 illustrates fabrication asymmetries. While stiffer beams and stage (figure. 1(d)) show little and relatively uniform initial deflections, uneven residual stress can cause individual legs to bend differently (figure 1(a)–(c)) and thus produce non-ideal motion of the stage. When the stage has finite stiffness, it can also be bent asymmetrically under the influence of residual stress (figure 1(c)). The residual stress in the device is developed during fabrication when the scanners undergo different high-temperature deposition and etching processes, such as during the deposition of SiO2 via low pressure chemical vapor deposition (LPCVD) and tetraethyl orthosilicate (TEOS) chemical vapor deposition (CVD) (figure 2(b)). The PZT film deposited by the sol-gel technique is sintered at high temperature (>650°C) (figure 2(c)). The gold and electrode layers also have intrinsic stress (figure 2(c)). The silicon etching steps shown in figure 2(e) and figure 2(f) are also exothermal processes, which can locally alter stress distributions. Detailed fabrication steps are described in [9, 24].
Figure 2.
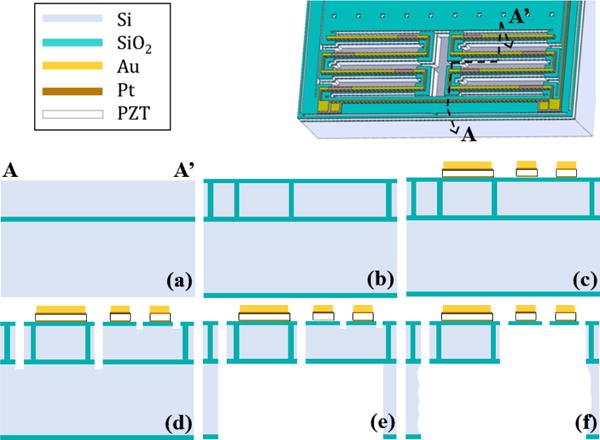
Fabrication process: (a) silicon-on-insulator wafer; (b) trench formation and refilling with SiO2 for encapsulation of silicon scanner structure; (c) deposition and patterning of electrodes, PZT, and Au; (d) front-side deep reactive ion etching (DRIE) to define moving structure; (e) back-side DRIE for release; (f) XeF2 release
2. Modeling
The conceptual vertical motion of a thin-film lead-zirconate-titanate (PZT) vertical micro-stage is shown in figure 3. Such stages can be designed to emphasize pure vertical translation, or to produce multi-axis motion through differential actuation of legs or resonance selection or both. As can be visualized from figure 3, the stiffness of the stage changes as the stage moves in the z-axis direction. In particular, the stiffness in the x-axis direction changes the most as an x-axis direction force on the stage would generate a torsional loading on the beams if the stage is at non-0V-position. The further the stage is away from its 0V-position, the larger the torsional loading the beams experience. A structural model that include this torsional loading has been developed. This section describes the development of the model that starts from the deflection analysis of a single beam.
Figure 3.

Schematic showing out-of-plane actuation (not drawn to scale).
2.1. Deflection of Single Beam
For the stage designs shown in figure 1, four cascading beams form a leg, and the four legs support the stage. To model the mechanical structure of the scanner, beams are used as a building block. The schematic of the cross-section of a beam is presented in figure 4 with the thickness information of each layer in table 1.
Figure 4.

Schematic of cross-section of beam (not drawn to scale)
Table 1.
Layer thicknesses
| Layer Materials | Thickness |
|---|---|
| Au / Ti | 1 μm / 50 nm |
| Pt | 0.1 μm |
| PZT | 0.8 μm |
| Pt / Ti | 80 nm |
| SiO2 | 0.2 μm |
Assuming PZT isotropy in the plane and perfect clamping condition, the piezoelectric in-plane stress is approximated by [8, 25]
| (1) |
where e31,eff and d31,eff are effective electro-active piezoelectric stress and strain coefficient, respectively, YPZT the Young’s modulus of the PZT measured at zero electric field, and E3 the applied electric field across the PZT film. The use of thin-film allows to apply high electric field to the PZT, but high electric field causes nonlinear responses. The piezoelectric coefficients, e31,eff and d31,eff, include nonlinear electroactive and piezoelectric behaviors, and they can be experimentally extracted as a ratio of stress and strain to electric field, respectively. Thus, they are considered to vary as a function of the applied voltage.
The top gold layer shown in figure 4 splits the beam into two segments, upward bending and downward bending, as it changes the location of neutral bending axis. A free body diagram of a beam is shown in figure 5. Mact,up and Mact,dn represent the actuation moments generated by the PZT film, and Mres,up and Mres,dn the moment by the residual stress developed during the fabrication process in the upward bending and downward bending segment, respectively. Following the Euler-Bernoulli beam bending analysis for a single beam reported in [9], the moment experienced by a piezoelectric unimorph with bend-up/bend-down segments under external force, FZ, and moment M along its length can be expressed:
| (2) |
where
Equation (2) can be integrated along the beam length to find the deflection of a beam, and the torsional displacement can be expressed as:
| (3) |
Then, with equations (2) and (3), one can map the external force and moments, T, M, Fz, the applied voltage, V, and effective residual moments, Mres,up and Mres,dn, to the vertical and angular displacements of a beam at its tip, z, θ, ϕ if all the geometrical parameters and the piezoelectric coefficient are known.
Figure 5.

Free body diagram of beam (not drawn to scale)
2.2. Deflection of Single Leg
2.2.1. Vertical and Angular Displacements
Figure 6 shows the reaction forces and moments between a single leg of the scanner and the stage. The horizontal force, Fx, exists due to residual stress and is included because it generates an additional torsional loading on the beams and thus effectively changes their torsional stiffness. Three-dimensional analysis of the deflections of multiple beams connected in series quickly becomes considerably complicated. Thus, the following assumptions were made with the intention to develop a model that is not too complex to analyze but has important coupling terms, reasonably approximated, to adequately capture the stiffness change that occur during the motion.
Figure 6.

Definitions of the angles and displacements of a leg, and effective external forces and moments applied to its tip (not drawn to scale).
Assumption 1
Beams can be twisted by a torsion, but the effect of the twist on the vertical deflection of each beam is neglected.
Assumption 2
The short beams, also referred to as connectors in figure 1, that connect two longer beams, are too rigid to be bent or twisted, but they can rotate as beams are twisted (i.e. they are assumed to be rigidly connected to the beams).
Assumption 3
In calculating the torsion applied to each beam by the horizontal force, Fx, the rotation of each connector is assumed to be small. (e.g. Fx·z4p·cos(φ3) ≈ Fx·z4p and Lt·Fx·sin(φ4) ≈ 0, where z4p is the vertical deflection of beam 4)
Assumption 4
In calculating the torsion applied to each beam by the vertical force, Fz, the rotation of each connector is assumed to be small. (e.g. Lt·Fz·cos(φ4) ≈ Lt·Fz)
Assumption 5
When beams are actuated, they bend such that the angle of each end is small, and thus the vertical force, Fz, is assumed to be applied to each end of the beam in the perpendicular direction to its base angle. (e.g. in calculating z4p, the force that cause beam 4 deflect, Fz·cosθ3 is approximated by Fz)
In the following analysis, the translational and angular displacements of the beams are expressed using local coordinates. The deflections of beams 1 and 3 are expressed in the x1-y1-z1 coordinates, and those of beams 2 and 4 in the x2-y2-z2 coordinates shown in figure 6. They are chosen such that the vertical displacement and slope of each beam are both positive as it moves upward. The end of a beam without the top gold layer is referred to as the base of a beam and the other end as the tip.
Using the assumptions and definitions above, the forces and moments at the tip of each beam due to the external forcing at the end of leg j, Fx,j, Fz,j, Mj, and Tj (j=A, B, C, D), can be approximated as follows for the deflection calculation of the individual beams:
| (4) |
| (5) |
| (6) |
where i = 1, 2, 3, 4, and zip,j is the vertical deflection of single beam i of leg j.
As the last term in equation (6) indicates, the magnitude of the torsion changes along the beam length because it is a function of the vertical displacement of the beams, so this equation can be integrated to find an expression for the torsional displacement, φ, of a beam of leg j under the external forces and moments, Fx,j, Fz,j, Mj, and Tj. Because of Assumption 1, the torsional displacement is not coupled with vertical displacement of a beam, and thus one can find the vertical displacement, z, and slope, θ, of a beam under the loading conditions expressed in equations (4) and (5) by simply using the mapping function between the force/moment and displacements obtained in Section 2.1.
Then, deflections of individual beams can be added together to express the vertical and angular displacements, zj, θj, and φj, of leg j as a function of the external forcing, Fx,j, Fz,j, Mj, Tj, applied voltage, Vj, and effective residual moment on all the segments.
| (7) |
| (8) |
| (9) |
where j=A, B, C, D, and Mres,j’s is the effective residual stress applied on each segment of the leg j (i.e. Mres,up,1, j, Mres,dn,1, j, Mres,up,2, j, Mres,dn,2, j, Mres,up,3, j, Mres,dn,3, j, Mres,up,4, j, Mres,dn,4, j, where the subscripts k, i, j refer to segment, beam, and leg in the notation Mres,k,i,j, respectively). In this analysis, these angular and vertical displacements are expressed in the local coordinates of each leg’s beam 4. Due to the coupling between bending and twisting, functions f1, f2, f3 that map the external forcing, applied voltage, and effective residual moments on all the segments to a displacement in each direction are nonlinear.
2.2.2. Horizontal Displacement
To obtain an expression for the tip displacement of leg j in the x-axis direction under the same loading conditions, it is key to capture the stiffness change in the x-axis direction as the legs deflect. Because of their low aspect-ratio cross-section, the bending stiffness of beams in the x-axis direction is much higher than other directions, so the deflection of the beams in the x direction by the horizontal force, Fx, is small and neglected. What is more significant is the motion of the tip of each beam due to its twist. One way to find the tip displacement of a leg in the x-axis direction using the obtained vertical and angular displacements of the beams is to define a vector from the base of beam 1 to the tip of beam 4, which can be expressed as follows:
| (10) |
where is the physical vector representing the position of the tip of beam 1 relative to its base (the origin in figure 6) with respect to Frame 1, the x1-y1-z1 coordinate. Subscripts 1, 2, 3, 4 before and after the symbol ‘/’ in equation (10) refer to the position of the tip of beam 1, 2, 3, 4, while subscripts 1t, 2t, 3t, 4t refer to the position of the tip of connector 1, 2, 3, 4. Each vector in equation (10) can be rewritten using directional cosine matrices and body-fixed frames. For example,
| (11) |
where, for i=1, 2, 3, 4,
, and Frame i is fixed on the base of beam i, while Frame it on the tip of beam i. L and Lt is the length of the beam and connector, respectively. zip is the vertical deflection of beam i alone, different from zi, which is the vertical position of the tip of beam i measured from the base of beam 1. As an approximation, the length of connector is ignored and small angle assumptions are used in the analysis. Rewriting each term in equation (10) using equation (11), the x-component of is the displacement of the tip of the leg in the x-axis direction expressed in terms of vertical and angular displacements of all beams of leg j, φi,j, θi,j, and zi,j, with respect to the x1-y1-z1 coordinates, and its sign can be reversed to express it in the x2-y2-z2 coordinates, the local coordinates used for the deflection calculation of beam 4, or leg j.
Then, using equations (7)–(9), the horizontal displacement of the tip of leg j can also be written as a function of the external forcing terms, applied voltage, and effective residual moments on all the segments within leg j as follows, using the same notation as before:
| (12) |
2.3. Stage Motion
Now the coupling between legs can be included through the equations describing the motion of the stage. Based on the free body diagram of the stage (figure 7), the dynamic equation in the standard 2nd order mass-spring-damper form, assuming decoupled damping, is
| (13) |
| (14) |
| (15) |
| (16) |
where m, Jφ, and Jθ are the mass and rotational inertias in the θ and φ direction of the stage, respectively, and g is the gravitational acceleration. The stage can be initially tilt due to residual stress on the legs. If so, the horizontal forces, Fx, j, also exerts moments on the stage.
Figure 7.
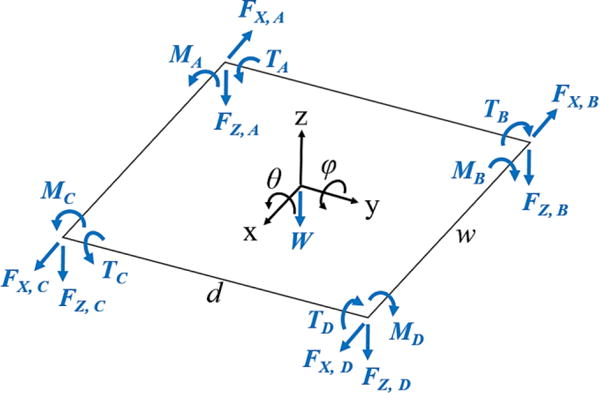
Free body diagram of the stage with definitions of reaction forces and moments (not drawn to scale)
Since the stage and legs are physically connected, the following geometric constraints exist:
| (17) |
where n=1 for j=A, C, and n=2 for j=B, D,
m=1 for j=C, D, and m=2 for j=A, B.
Nonlinear equations (13)–(16) along with (7)–(9), (12), and (17) describe the motion of the stage. One way to find the resonance of the stage at a given AC voltage input is to find its static position at the dc bias voltage using the above nonlinear equations, and then consider a linear behavior about the equilibrium position. In other words, if the effective residual moments and input voltage on each leg are prescribed, one can numerically find static displacements of the stage, , and reaction forces and moments between the legs and stage, , using equations (7–9,12–17), which then can be linearized to construct a linear dynamic model. The eigenvalues of the linear model can be used to obtain the nominal resonant frequencies of the scanner at a given offset voltage.
Linearizing the leg equations (7)–(9) and (12) about the equilibrium states found using the nonlinear equations above, they become:
| (18) |
The linearized stage equations (13)–(16) is
| (19) |
where
and
where Fx,j,e is horizontal reaction force between the stage and leg j at equilibrium (j=A, B, C, D),
n=1 for j=A, C, and n=2 for j=B, D,
m=1 for j=C, D, and m=2 for j=A, B,
q=1 for j=A, D, and q=2 for j=B, C,
φe=stage tilt angle in the φ direction at equilibrium. The additional stiffness term, Ke, exists because the horizontal forces Fx,j,e, apply moments on the tilt stage.
Geometrical constraint equation (17) becomes
| (20) |
Now that all the equations are linear, rewriting equation (19) using equations (18) and (20) and assuming a single input (i.e. same voltage on all legs) gives
| (21) |
where
Equation (21) can also be written in the state-space form:
| (22) |
Equations (21) & (22) describe the dynamic motion of the stage about an equilibrium position at a bias voltage. Different bias voltages result in different equilibrium positions, producing different values of K and Gvoltage in equation (21) and different values of Asys and Bsys in equation (22). Computing the eigenvalues of Asys gives the damped natural frequencies of the scanner, and the pairing of an eigenvalue with the right mode or state can be done by exciting one state at a time and drawing bode plots.
In order to study the effects of the observed non-ideal mass property, such as the case of an asymmetrically deformed stage as shown in figure 1(c), on stage dynamics, the change in the location of the rotational center of the stage mass can be also included in the model. When the rotational center is offset by doff and woff in the positive y-axis and x-axis direction, respectively, from the geometrical center of ideal stage, d, in the equations above, can be replaced with (d + doff) for the terms associated with legs A and C or with (d − doff) for the terms associated with legs B and D; w replaced with (w + woff) for the terms associated with legs A and B or with (w − woff) for the terms associated with legs C and D. The rotational inertias can be estimated using the parallel axis theorem.
3. Simulation Studies on Effects of Non-uniformity
With the model developed in Section 2, the effects of dc bias voltage and asymmetries on the system’s resonant frequencies can be studied. First, an ideal case with the absence of residual stress, thus perfect symmetry, is simulated, and the resonant frequencies are plotted in figure 8. For the simulation purpose, experimentally observed 3% damping ratio was used for the results in this section. The values of d31,eff was extracted from the experimental measurements that will be presented in the next section. If a system is linear and its structural stiffness does not change as a function offset voltage, all the resonant frequencies should be constant, showing straight lines in figure 8. However, the model shows a drastic change of the natural frequency in the x-axis direction as the bias voltage increases, and this is because the stiffness in the horizontal direction decreases due to large vertical stroke of the stage. In this ideal case, the simulation result shows that the natural frequencies of other direction do not change much.
Figure 8.

Simulated shift of resonant frequencies as Vbias changes in the ideal case (no residual stress & perfect symmetry)
Often, the stage of the fabricated samples is tilt in most cases because of residual stress acting on the leg structure having compliance for large deformations, adding another source of non-uniformity. To first examine the impacts of non-identical initial deflection of the legs on the resonance behavior, different combinations of uniform and non-uniform residual stress were applied to each leg. Simulation runs with different initial stage heights and tilt angles produced similar trends to the ideal case. They showed that the resonant frequencies in the x- and φ-mode, compared to the z- and θ-mode, notably decrease as the bias voltage increases (i.e. the stage height increase), regardless of the uniformity or the magnitude of residual stress on the device.
For instance, figure 9 shows the simulation results generated when all the legs are under nominal uniform residual stress producing an initial stage height of 160μm with legs B and D applied with additional residual stress to vary initial stage tilting in the θ direction. The frequencies associated with the x-direction and φ direction decrease as the 0V height of the stage increases, although the change in the x-direction is less than the ideal case because the stage is away from the zero-height position due to residual stress. While the change in the resonant frequencies associated with the z-direction and θ direction is very small, it was found that their trend depends on the initial tilting direction of the stage.
Figure 9.
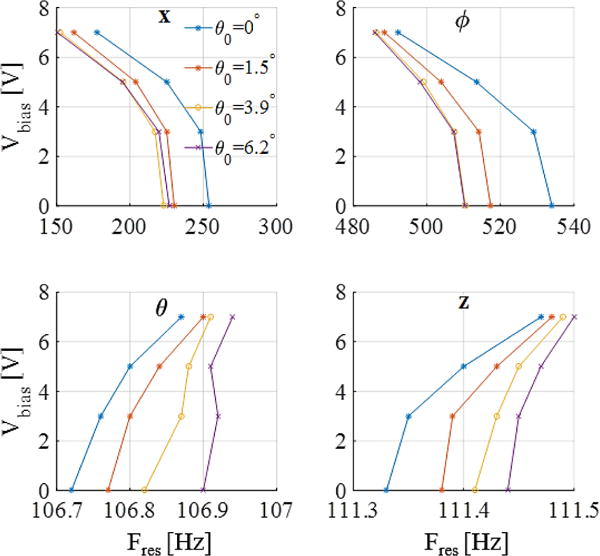
Effects of asymmetry from non-uniform residual stress on bending legs: simulated resonant frequency shift as non-uniform residual stress increases initial stage tilt in θ direction (z0=160 μm)
It is not easy to measure every mode of the stage motion, and in this work only vertical motion of the four corners of the stage was measured. Thus, the contribution of the four modes to the measured vertical motion is of interest. The vertical displacement of each corner of the stage has the following relationship with the states (x, φ, θ, z) of the stage:
| (23) |
where j=A, B, C, D, n=1 for j= A, C, n=2 for j=B, D, m=1 for j=C, D, and m=2 for j=A, B.
The linearization of (23) imparts:
| (24) |
where φe and xe are the equilibrium position of the stage at a bias voltage and other notations are the same as (23). Using (22) and (24), experimental measurements, or the superpositioned results of different resonant modes, can be predicted.
Figure 10 describes expected effects of two aforementioned types of non-uniformity on the vertical motion of one of the stage corners. When there is perfect symmetry (uniform residual stress and uniform mass distribution) and all the legs produces the same actuation moments, only the z-mode is excited (figure 10(a)). While non-uniform residual stress on bending legs causes large frequency shifts (figure 10(c)), a mass-wise unbalanced (asymmetrically bent) stage more effectively excites higher modes (figure 10(b)). When both of these non-uniformities are in effect, even at small nominal magnitudes, large shifts in higher-order mode resonant frequencies can be expected over large stage displacements (figure 10(d)).
Figure 10.

Simulated effects of unevenly bent legs and stage on frequency response of the stage motion
4. Experimental Illustration
It was found that frequency responses of sample devices observed to be subject to fabrication non-uniformity (figure 1(c)) exhibited the trends expected from the simulation results shown in figure 10: appearance and shifts of the resonant frequency of higher-order modes as bias voltage changes. Figure 11 shows experimentally measured vertical displacements of the four stage corners of a representative device using Keyence’s LK-G32 laser displacement sensor while a 6Vpp sinusoidal input signal was swept over 0 to 800 Hz with a step of 5 Hz at different dc bias voltages (3Voff, 5Voff, 7Voff). The measurements were taken after poling the PZT at 10V for 5mins. Additionally, due to uneven initial deflections of bending beams, tilt stage, and non-uniform motion produced from each leg, the frequency responses of the legs are quite different from one another.
Figure 11.

Experimental frequency response with constant 6Vpp and varying dc voltages, showing the measurements taken at the top left (TL), top right (TR), bottom left (BL), and bottom right (BR) corner of the stage
In order to evaluate the model developed in the previous section, some parameters were estimated using the experimental data, while others were tuned to find the best fit to the measured frequency response. The deflection of each leg at low frequency was used to estimate the value of effective electro-active piezoelectric strain coefficient, d31,eff. The differences in the amplitude on the legs at each bias voltage are captured by adjusting the d31,eff values for each leg. The static position of the stage at 0V, the magnitude and frequency of each resonant peak were used to estimate the residual stress on each leg and the location of the rotational center of the stage. After the values of d31,eff and effective residual moments were found, the damping coefficients were manually tuned to find the best match with the experimental results.
The frequency response from the model is presented in Figure 12. The model captures well the magnitude and frequency of the 1st and 2nd peaks as well as the frequency shift of the 2nd peak. It estimates the overall trend of each leg reasonably well, although 3rd and 4th peaks are not pronounced in the model. It was found that the magnitude and frequency of higher order modes are sensitive to the magnitude of the residual stress on all beams. Thus, one likely main contribution to discrepancies between model and experiment lies in the difficulty finding a close combination of residual stresses on all beams to the actual case. Here, an equivalent residual moment, same on all legs, needed to produce the initial position of the stage was first found, and then it was varied manually among the legs to match the trend. Also, it was presented that non-uniform payload notably affects higher-order modes. The rotational center of the stage likely had moved in z-axis direction as well after it was bent, which was not included in the current model and might have contributed to the discrepancies.
Figure 12.

Model prediction of the experimental results with constant 6Vpp and varying dc voltages, showing the measurements taken at the top left (TL), top right (TR), bottom left (BL), and bottom right (BR) corner of the stage
Furthermore, the magnitude of the piezoelectric strain coefficient is observed to be different among all the beams, but for simplicity they are lumped into one value for each leg (i.e. all the beams within a leg are simulated with the same values). Unmodeled hysteresis of PZT produces imperfect sine waves, which means that the scanner was excited at multiple frequencies simultaneously. All these could change the magnitude of coupling terms, affecting the resonant frequencies and peak magnitudes.
5. Conclusions
The nonlinear dynamic behavior of a previously developed thin-film PZT scanner for early cancer detection in endomicroscopy has been studied. In spite of its small footprint (3.2mm by 3.2mm), this scanner had demonstrated more than 400 μm of out-of-plane displacement under 15VDC. An AC sinusoidal excitation can be used to make the input voltage even lower and to avoid producing unwanted motion that can be generated from a single DC voltage input due to residual stress-induced deflections, which is important for successful image registration. In order to take advantages of these benefits of the AC operation, the experimentally observed shift of resonant frequencies of the scanner due to a dc bias voltage needs to be understood.
The residual stress in the bending beams affects the resonant frequency of the scanner. However, it was found that the stiffness change in the beams due to residual stress alone is not substantial enough to explain the large shift in the measured resonant frequencies as the input bias voltages changes. One can notice that the lateral stiffness of the scanner considerably decreases as the scanner moves vertically from its nominal zero-voltage position. Based on this insight, a hypothesis was formulated that the change of the lateral stiffness of the scanner based on its vertical position along with non-ideal fabrication outcomes has dominant effects on its resonant frequencies. Thus, a model has been developed that accounts for the stiffness change in multiple directions during the motion of the stage and thus the coupling between the position of the stage and its resonant frequencies. The model also incorporates the effects of residual stress and its varying magnitude across the whole scanner structure.
The simulation studies have shown a noticeable decrease in the natural frequencies in x- and φ-directions as the stage moves up, regardless of the initial 0V position of the stage. In comparison, the natural frequencies in z- and θ-directions change more inconsiderably, but their trends change depending on the initial 0V position of the stage (i.e. more depend on the residual stress). Using the residual stress and piezoelectric coefficients extracted from the experimental measurements, the model adequately predicts the experimentally observed natural frequencies of the stage at each dc bias voltage.
Non-uniform residual stress and dimensional variations developed from the fabrication processes cause asymmetries in MEMS structures, which generate unintended internal stresses. For a device designed to generate a large motion, these stresses can significantly change its dynamic characteristics. The model presented in this work effectively describes the nonlinear dynamic behavior of a piezoelectric scanner by accounting for the effects of unintended internal stresses on the structural compliance. Measured residual stress on each beam and the addition of the characterized frequency-dependent piezoelectric properties and its hysteresis behavior can improve the model.
This model will be used to drive the piezoelectric scanner in a lissajous scanning pattern in prototype endo-microscopic imaging systems for vertical cross-sectional imaging of tissue. For a robust control of the stage motion or the scanning pattern, embedded sensing elements can be characterized and used with a feedback control scheme.
Acknowledgments
The authors would like to thank the National Science Foundation and the National Institutes of Health for their support of this work (Award CMMI: 1334340 and Award R01 CA142750, respectively). The authors acknowledge the support and assistance of the Lurie Nanofabrication Facility at the University of Michigan, Radiant Technologies, and the US Army Research Laboratories in the fabrication of prototype devices. The authors also thank Dr. Choong-Ho Rhee and Dr. Zhen Qiu for their help in fabrication of the prototype devices.
References
- 1.Zhang X, et al. A non-resonant fiber scanner based on an electrothermally-actuated MEMS stage. Sensors and Actuators A: Physical. 2015;233:239–245. doi: 10.1016/j.sna.2015.07.001. [DOI] [PMC free article] [PubMed] [Google Scholar]
- 2.Li H, et al. Integrated monolithic 3D MEMS scanner for switchable real time vertical/horizontal cross-sectional imaging. Optics express. 2016;24(3):2145–55. doi: 10.1364/OE.24.002145. [DOI] [PMC free article] [PubMed] [Google Scholar]
- 3.Naono T, et al. A large-scan-angle piezoelectric MEMS optical scanner actuated by a Nb-doped PZT thin film. Journal of Micromechanics and Microengineering. 2013;24(1):015010. [Google Scholar]
- 4.Davis WO, et al. Trajectory precision of micromachined scanning mirrors for laser beam scanning pico-projector displays. Proc SPIE. 2012;8252:825203–1. [Google Scholar]
- 5.Freeman M, et al. Scanned laser pico-projectors: seeing the big picture (with a small device) Optics and Photonics News. 2009;20(5):28–34. [Google Scholar]
- 6.Baran U, et al. Resonant PZT MEMS scanner for high-resolution displays. Journal of microelectromechanical systems. 2012;21(6):1303–10. [Google Scholar]
- 7.Yalcinkaya AD, et al. Two-axis electromagnetic microscanner for high resolution displays. Journal of Microelectromechanical Systems. 2006;15(4):786–94. [Google Scholar]
- 8.Qiu Z, et al. Large displacement vertical translational actuator based on piezoelectric thin films. Journal of Micromechanics and Microengineering. 2010;20(7):075016. doi: 10.1088/0960-1317/20/7/075016. [DOI] [PMC free article] [PubMed] [Google Scholar]
- 9.Choi J, et al. A three-degree-of-freedom thin-film PZT-actuated microactuator with large out-of-plane displacement. Journal of Micromechanics and Microengineering. 2014;24(7):075017. doi: 10.1088/0960-1317/24/7/075017. [DOI] [PMC free article] [PubMed] [Google Scholar]
- 10.Michael M, Thomas W. Dual Axes Confocal Microscopy Handbook of Photonics for Biomedical Science. CRC Press; 2010. pp. 481–508. [Google Scholar]
- 11.Choi J, et al. Static and Dynamic Modeling of a Multi-Axis Thin-Film Piezoelectric Micro-Actuator. Proc of ASME 2013 Dynamic Systems and Control Conference. 2013;1001:48109. 2013. [Google Scholar]
- 12.Choi J, et al. Multi-Photon Vertical Cross-Sectional Imaging With a Dynamically-Balanced Thin-Film PZT z-Axis Micro-actuator. Journal of Microelectromechanical Systems. 2017;26(5):1018–1029. doi: 10.1109/JMEMS.2017.2701798. [DOI] [PMC free article] [PubMed] [Google Scholar]
- 13.Hong YK, Syms RR. Dynamic response modeling of MEMS micromirror corner cube reflectors with angular vertical combdrives. Journal of Lightwave Technology. 2007;25(2):472–80. [Google Scholar]
- 14.Zhang WM, Meng G. Nonlinear dynamic analysis of electrostatically actuated resonant MEMS sensors under parametric excitation. IEEE sensors journal. 2007;7(3):370–80. [Google Scholar]
- 15.Yeh JL, et al. Electrostatic model for an asymmetric combdrive. Journal of Microelectromechanical systems. 2000;9(1):126–35. [Google Scholar]
- 16.Morgan B, Ghodssi R. Vertically-shaped tunable MEMS resonators. Journal of Microelectromechanical Systems. 2008;17(1):85–92. [Google Scholar]
- 17.Elshurafa AM, et al. Nonlinear dynamics of spring softening and hardening in folded-MEMS comb drive resonators. Journal of Microelectromechanical Systems. 2011;20(4):943–58. [Google Scholar]
- 18.Mestrom RM, et al. Simulations and experiments of hardening and softening resonances in a clamped–clamped beam MEMS resonator. Sensors and Actuators A: Physical. 2010;162(2):225–34. [Google Scholar]
- 19.De SK, Aluru NR. Full-Lagrangian schemes for dynamic analysis of electrostatic MEMS. Journal of Microelectromechanical Systems. 2004;13(5):737–58. [Google Scholar]
- 20.Soma A, Ballestra A. Residual stress measurement method in MEMS microbeams using frequency shift data. Journal of Micromechanics and Microengineering. 2009;19(9):095023. [Google Scholar]
- 21.Leland ES, Wright PK. Resonance tuning of piezoelectric vibration energy scavenging generators using compressive axial preload. Smart Materials and Structures. 2006;15(5):1413. [Google Scholar]
- 22.Marzencki M, et al. MEMS vibration energy harvesting devices with passive resonance frequency adaptation capability. Journal of Microelectromechanical Systems. 2009;18(6):1444–53. [Google Scholar]
- 23.Rhee CH, et al. Dynamics of Thin-Film Piezoelectric Vertical-Rotational Scanning Actuator. Proc of ASME 2015 International Design Engineering Technical Conferences and Computers and Information in Engineering Conference. 2015;1001:48109. [Google Scholar]
- 24.Rhee CH, et al. Multi-degree-of-freedom thin-film PZT-actuated microrobotic leg. Journal of Microelectromechanical Systems. 2012;21(6):1492–503. [Google Scholar]
- 25.Trolier-McKinstry S, Muralt Thin film piezoelectrics for MEMS. Journal of Electroceramics. 2004;12(1–2):7–17. [Google Scholar]