

Abstract
Background:
Achieving the UNAIDS 90-90-90 target by 2020 is expected to end the HIV epidemic by 2030. We report on progress in the WHO European Region in meeting this target.
Methods:
The European Centre for Disease Prevention and Control (ECDC) sent questionnaires to 55 countries in 2016. We report estimates for 4 stages of the continuum of HIV care (living with HIV, diagnosed, treated, and virally suppressed), corresponding to the Joint United Nations Programme on HIV and AIDS (UNAIDS) target and explore differences by subregion and challenges with reporting data.
Findings:
Forty-four countries provided data for ≥1 stage, and 29 for all 4 stages. Estimated HIV prevalence was 0.19% (range 0.02%–0.84%, n = 37 countries providing stage 1 data). The proportion diagnosed of people living with HIV ranged from 38% to 98% (n = 37 reporting number of people living with HIV and diagnosed). The proportion on ART of those diagnosed ranged from 27% to 96% (n = 40 reporting numbers diagnosed and treated), and viral suppression rates ranged from 32% to 97% (n = 31 providing numbers treated and virally suppressed). The overall continuum of care estimate for 29 countries with complete data was 81-84-88, which differed by subregion: 84-88-90, 84-69-62, and 57-45-57 for the western, central, and eastern subregions, respectively. Challenges in reporting data included absence of a single data source for all stages, shortage of expertise, and lack of financial and human resources.
Conclusions:
There is an urgent need to strengthen HIV testing programs throughout Europe, particularly in the eastern subregion, and to remove constraints hampering access to testing and care. Recent changes to treatment guidelines should help reduce the numbers diagnosed not treated.
Key Words: continuum of HIV care, cascade of care, Europe, prevalence, HIV diagnoses
INTRODUCTION
Of the estimated 36.7 million people living with HIV (PLHIV) globally in 2015, 2.5 million (6.8%) were in the World Health Organization (WHO) European Region,1 including 5 central Asian countries.2 Of the 2 million new infections globally in 2015, 170,000 (8.5%) are estimated to have taken place in that region.3 Although there is evidence of a stabilizing or decrease in numbers of newly infected elsewhere, rates of new adult HIV infections have increased dramatically in Eastern Europe and Central Asia.4
The region's 153,400 people newly diagnosed with HIV in 2015 corresponded to a rate of 17.6 per 100,000 population, a 7% increase over the previous year.5 The vast majority (79%) were in the eastern subregion comprising the 15 former Soviet Union countries, including Russia. Rates of new HIV diagnoses have consistently been highest in the eastern and lowest in the central subregions. Epidemic patterns differ between the 3 subregions, with the highest proportions of HIV diagnoses documented among men having sex with men in the western and central subregions, and among people who inject drugs or sex between men and women in the eastern subregion.5 Male to female ratios among PLHIV are, as a consequence, much higher in the western and central vs. eastern subregions.5
Since 2010, the European Centre for Disease Prevention and Control (ECDC) has supported countries in monitoring progress on their commitment to implementing the Dublin Declaration on Partnership to Fight HIV/AIDS in Europe and Central Asia.6 To monitor progress, a request is made to the relevant authority in each country to provide information through a tailored questionnaire on a number of key HIV-related issues. The questionnaire is sent out every 2 years and has, since 2014, included specific questions aimed at quantifying the stages of the continuum of HIV care in each country.7
The HIV continuum of care, or cascade of care, has emerged as a useful tool for monitoring the care pathway of PLHIV from diagnosis, through to engagement with and retention in care, initiating and maintaining adherence to antiretroviral therapy (ART), and achieving viral suppression. The concept of defining transition through health care stages was first proposed in 1972 in relation to hypertension8 and gained traction when it was applied to the HIV population in the United States.9
In 2014, the Joint United Nations Programme on HIV and AIDS (UNAIDS) launched the 90-90-90 target10 for countries to ensure that, by 2020, at least 90% of PLHIV are diagnosed, of whom 90% are on ART and of whom 90% are virally suppressed. The ambitious target corresponds to 4 stages of the continuum of HIV care and is supported by modeling work indicating that viral suppression among all PLHIV must reach very high levels to reduce HIV incidence significantly.11
Using data reported through the Dublin Declaration questionnaire 2016,7 our aim here is to report the best available estimates of the 90-90-90 target for the WHO European Region and make a number of recommendations aimed at supporting countries achieve the UNAIDS target.
METHODS
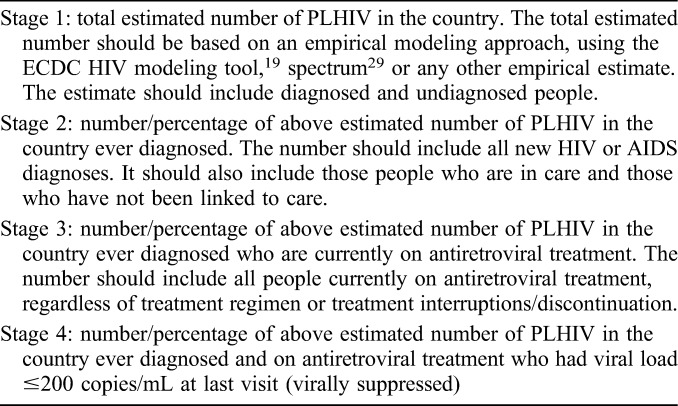
The 2016 Dublin Declaration questionnaire7 was sent in December 2015 to all 53 member states of the WHO European Region and to Liechtenstein and Kosovo (This designation is without prejudice to positions on status and is in line with UNSC 1244 and the ICJ Opinion on the Kosovo Declaration of Independence), which are not WHO member states (Appendix 2). As part of the process, the ECDC provided guidance on definitions for the stages of the care continuum (Table 1), requested information on data sources, the year to which data referred, and followed up on data submitted, resulting in further data submission and clarification by reporting countries.
TABLE 1.
Definitions Used to Monitor the Continuum of HIV Care in the Dublin Declaration Monitoring Questionnaire 2016
We report on the data submitted by countries on the HIV continuum of care estimates, focusing on differences between the subregions. For each country, we present the absolute number and/or proportion at each stage (1, the total number of PLHIV; 2, the number/proportion diagnosed; 3, the number/proportion on ART; and 4, the number/proportion virally suppressed), using the previous stage as the denominator. The overall proportion suppressed was also estimated using the denominator of all PLHIV. We estimate HIV prevalence for each country that reported data for stage 1, using Eurostat population data for 2015 (all ages) as denominator.12 For the 29 countries that provided complete data for all 4 stages, we then combined estimates to provide a regional estimate that aligns with the 90-90-90 target.
From the estimated number of individuals conceptually “lost,”13 or omitted by definition, from each stage of the continuum, ie, those with unsuppressed viremia, we derive the proportion each stage contributes to the total number of people living with unsuppressed viremia by taking the difference in absolute numbers between each stage and dividing by the overall number unsuppressed.
We report on progress since 2014 in achieving 90-90-90 and explore possible reasons for any improvements in estimates. Although definitions were provided to countries for the 4 stages in 2016 (Table 1), no definitions were provided in 2014.7,14 Comparisons should, therefore, be made with caution.
We also explore reasons for the lack of continuum data in countries and examine the main challenges in collecting and reporting data. Rates of new HIV diagnoses by country, obtained from published data,5 are also assessed by subregion and by whether continuum data were reported or not in the 2016 survey, to help assess the likely direction of any potential bias in our estimates.
RESULTS
Data Availability
The response rate to the Dublin Declaration questionnaire was high (48 of 55 countries, 87%). No continuum data were reported by 11 countries; 7 did not respond to the questionnaire, and 4 returned the questionnaire but provided no continuum data for any stage (Table 2 and Fig. 1).
TABLE 2.
WHO European Region Continuum of HIV Care Data Submitted by Subregions: The Dublin Declaration 2016


FIGURE 1.

Overall trends in rates of new HIV diagnoses in the WHO European Region (per 100,000 population) by subregion and whether HIV continuum data were reportedⱡ in the Dublin Declaration monitoring questionnaire 2016. ⱡThe Dublin Declaration questionnaire was not returned for Belarus, Former Yugoslav Republic of Macedonia, Liechtenstein, Monaco, Russian Federation, San Marino, and Turkmenistan, or the questionnaire was returned but no continuum of HIV care data were provided for any stage for Bosnia and Herzegovina, Finland, Iceland, and Turkey. Surveillance data for the entire period were not available for Bosnia and Herzegovina and Uzbekistan; thus, these countries are not included in the trends presented above. Data from the ECDC/WHO HIV/AIDS surveillance in Europe, 2015, was regrouped and analyzed for this graph.
Countries in the eastern subregion that did not report any continuum data had appreciably higher rates of new HIV diagnoses than eastern countries reporting continuum data, and the highest rates of new HIV diagnoses overall compared with other subregions (Fig. 1), largely because of the cases from Russia. In the western subregion, the situation was reversed with somewhat higher rates of new diagnoses in the countries reporting continuum data than those not reporting. Rates were altogether low in the central subregion.
Of the 44 countries providing continuum data, 37 provided data for stage 1 (number of PLHIV), 42 for stage 2 (number diagnosed), 42 for stage 3 (number on ART), and 31 for stage 4 (number suppressed). Twenty-nine countries provided data for all 4 stages enabling complete construction of each of these countries' continua to be made (Table 2).
Continuum of HIV Care Estimates 2016
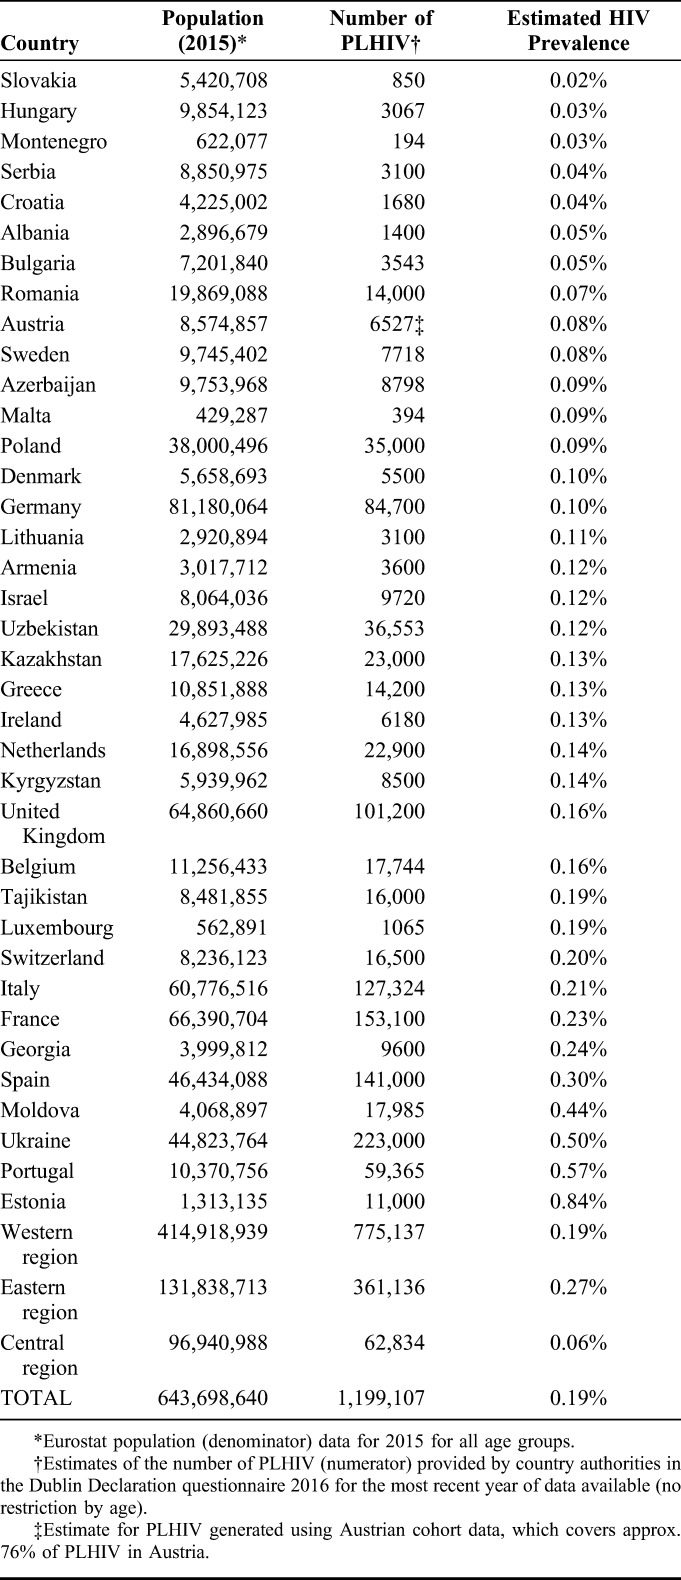
An estimated 1,199,107 were PLHIV in the 37 member states, which provided stage 1 data, equivalent to an overall HIV prevalence of 0.19%, ranging from 0.02% in Slovakia to 0.84% in Estonia (Table 3). In the 37 countries providing data for stages 1 and 2, the proportion of PLHIV reported diagnosed ranged from 38% in Tajikistan to 98% in Romania. Three countries reported meeting the first “90” of the UNAIDS target.
TABLE 3.
Estimated HIV Prevalence in 37 WHO European Region Countries Providing Data on Number of PLHIV in the Dublin Declaration Monitoring Questionnaire 2016
The proportion on ART among those diagnosed in the 40 countries reporting numbers diagnosed and on ART, ranged from 27% in Latvia to 96% in Malta and the United Kingdom. Eight countries reported meeting the second “90” of the UNAIDS target (Table 2).
Viral suppression rates for the 31 countries providing data for stages 3 and 4 ranged from 32% in Albania and Tajikistan to 97% in Switzerland. Eleven countries reported meeting the third “90” of the UNAIDS target.
The care continua for all 29 countries that provided data for all stages are shown in Figure 2 (derived from Table 2). In these countries, the overall continuum of HIV care estimate corresponding to the UNAIDS target is 81-84-88 (% diagnosed, % on ART, and % suppressed, respectively), equating to 60% viral suppression of all PLHIV. These proportions differed by subregion; 84-88-90, 84-69-62, and 57-45-57 for the western, central, and eastern subregions, respectively, equivalent to 66%, 36%, and 14% suppressed, respectively, of all PLHIV. Of note, substantial heterogeneity in estimates was evident within each subregion.
FIGURE 2.
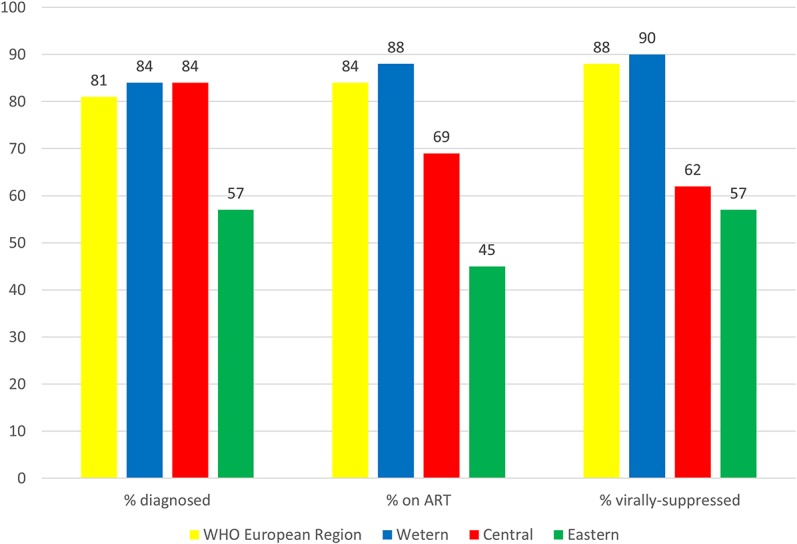
The HIV continuum of care in the WHO European Region for 29 countries submitting data for all 4 stages in the Dublin Declaration monitoring questionnaire 2016. ART antiretroviral treatment proportions are shown out of the previous stage, ie, % diagnosed out of the number of PLHIV, % on ART of those diagnosed, and % virally suppressed of those on ART.
Two countries in the region reported achieving 90-90-90 (Sweden and Denmark) equivalent to overall suppression rates of all PLHIV of 82% and 80%, respectively. The United Kingdom also reported meeting the overall UNAIDS target of 73% of PLHIV suppressed. Of the remaining countries, overall suppression rates were ≥70% for 2 countries, 60%–69% for 7, 50%–59% for 2, and <50% for the remaining 15 countries. All 12 countries reporting overall suppression of ≥60% are in the western subregion; of the 15 with suppression rates <50%, 2 were in the western, 6 in the central, and 7 in the eastern subregions.
In the 29 countries reporting data for the complete continuum, 349,329 individuals “lost” from the continuum comprised the total pool of people living with unsuppressed viremia. The relative contributions of each stage to the overall total unsuppressed were: an estimated 165,322 (47%) with undiagnosed HIV, 110,657 (32%) diagnosed who are not on ART, and 73,350 (21%) on ART without suppressed virus. These proportions equate to 48%, 30%, and 22% for undiagnosed, diagnosed not on ART, and on ART unsuppressed, respectively, in the western subregion, 25%, 40%, and 34% for the central subregion, and 51%, 36%, and 13% for the eastern subregion (Fig. 3).
FIGURE 3.
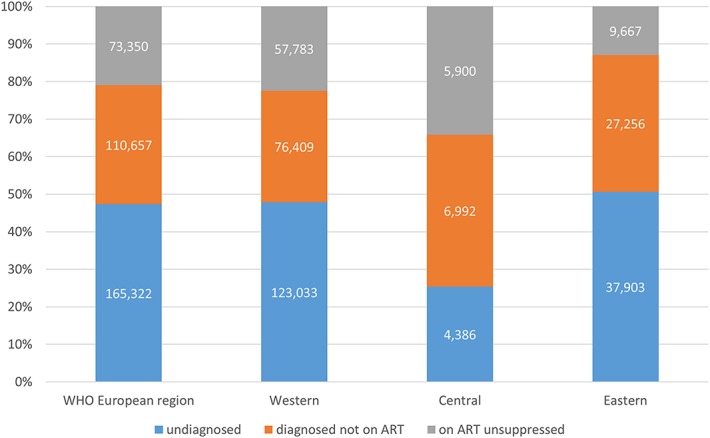
Relative contributions to the overall pool of unsuppressed viremia by stage of the HIV continuum of care in 29 countries in the WHO European Region reporting all 4 stages in the Dublin Declaration monitoring questionnaire 2016. Figures in bars are estimated numbers of individuals with unsuppressed viremia at each stage. Data are cross-sectional and do not reflect the time spent at each stage.
Progress Since 2014
Submission of continuum of HIV care data improved from 2014 to 2016: more countries provided estimates for at least 1 stage (44 in 2016 vs. 40 in 2014) and more submitted data for all 4 stages (29 vs. 16).
The estimated care continuum in 2016 was somewhat improved for the 16 countries reporting complete data in both 2014 and 2016 from 76-80-88 to 83-89-90. In 2016, a greater number of countries reported reaching ≥90% on ART (8/40 vs. 2/33 in 2014) and ≥90% suppressed (11/31 vs. 9/24); the same number reported reaching ≥90% diagnosed (3/37 vs. 3/23).
Of the 48 countries, which provided information on CD4 threshold for ART initiation in 2014, 4 countries recommended initiation regardless of CD4 cell count. By 2016, of the 48 countries providing this information, this figure reached 29.
Challenges With Collecting and Reporting Continuum Data
Thirty countries responded to a question about the main challenges in collecting continuum data and/or gave reasons for not providing continuum of care estimates. Key challenges can be summarized as follows, in no particular order:
Lack of a consolidated national clinical data source, regularly updated, for example, through a cohort, from which numbers on ART and suppressed can be derived;
Lack of a single source from which data to estimate all stages could be collated;
Where clinical cohort data exist, the lack of a common identifier to allow for linkage with surveillance data;
Inadequate data systems, for example, lack of/low quality of case reporting, or lack of electronic data;
Lack of data and/or expertise to estimate number of PLHIV;
Lack of financial and human resources to collect and analyze data.
DISCUSSION
Using data reported by countries through the Dublin Declaration questionnaire in 2016, we estimate the continuum of HIV care to be 81-84-88 for the WHO European Region, based on the 29 countries with complete continuum data. This equates to 60% of all PLHIV being suppressed. Although these figures represent an improvement over the 2014 estimates,14,15 a concerted effort is clearly needed if the region is to reach the 90-90-90 target by 2020 given the high proportion unsuppressed.
Two countries in the region have, to date, achieved the UNAIDS target: Sweden and Denmark. Although this achievement is to be applauded, it is worth bearing in mind that estimated HIV prevalence in these countries is among the lowest in the western subregion. Their greater achievement may, therefore, be successful HIV-prevention interventions.
We also noted wide heterogeneity in estimates across the region, and within subregions. The care continuum is highest in the western subregion, and lowest in the eastern subregion. With an estimated care continuum of 84-88-90, many countries in the western subregion are much closer to reaching the 73% overall viral suppression target by 2020. At 57-45-57, a number of countries in the eastern subregion are lagging behind, possibly reflecting the younger epidemics in some. At current rates, they face major challenges in meeting the UNAIDS target. Given the substantial heterogeneity in estimates for each stage within each subregion, the focus should be on each country's continuum rather than that of the subregion within which it is located.
The continuum estimates presented here are comparable with, although somewhat higher than, findings from recent systematic analyses of published care continua for countries worldwide, including WHO European Region countries.16,17 Although there may be differences between countries in methodologies and populations on which estimations are based, the data may be an indication of genuine improvements, given that these are largely the most recent estimates. Our estimates here are also comparable with recent estimates from UNAIDS4 and for 11 European Union countries in 2013.18
We found that countries in the eastern subregion that did not provide any continuum data, for example, Russia and Belarus, had higher rates of new HIV diagnoses, more than double those reporting continuum data. Given that the rate in the eastern subregion is dominated by Russia, one of the 11 countries not submitting data through the Dublin Declaration questionnaire, our overall estimates for the region, as a whole, and in Eastern Europe, in particular, are almost certainly over-optimistic.
There was no single stage for which data were available for all countries. The first stage, total estimated number of PLHIV, is arguably the most crucial as all subsequent stages depend on it and presents the greatest challenge to derive. An accurate estimate of this stage is, nonetheless, essential for planning, budgeting, implementing, and monitoring the national response to HIV. In the European region, only 37 countries provided these estimates in 2016, and greater effort is, therefore, required to support countries, particularly where no historical surveillance data are available. To help address this, the ECDC is supporting countries to use the ECDC HIV modeling tool to generate robust estimates of the number of PLHIV.19 Data for 12 countries with PLHIV estimates in a recent WHO publication were similar to our findings,20 with the exception of 3 countries for which estimates differed by ≥10% (Azerbaijan, Uzbekistan, and Greece).
Furthermore, the number undiagnosed is responsible for the largest share of unsuppressed viremia because of the number of individuals involved. We estimated that, across the whole region, it accounts for 47% of the total unsuppressed. Even in the western subregion, with 84% of all estimated PLHIV diagnosed, those remaining undiagnosed account for 48% of the total unsuppressed. These calculations highlight the importance of testing and diagnosis, given the potential for onward transmission from the large numbers undiagnosed. Although the length of time spent by individuals in each stage is not taken into account, these calculations likely underestimate the potential contribution to transmission of undiagnosed populations, given that some may remain in that stage for many years.
Changes to ART initiation guidelines are likely to have influenced the apparent improvement in the proportions on ART between 2014 and 2016 (from 80% to 89%). After the results of the START21 and TEMPRANO22 trials of when to initiate ART, most HIV treatment guidelines now recommend ART initiation on diagnosis, without the need of a CD4+ cell count.23 This change is, indeed, reflected in the data collected through the Dublin Declaration questionnaire, with 41 of the 48 countries reporting policies of initiating ART at CD4+ 500 cells/mm3 or higher. No doubt changes will follow for the remaining countries still using lower CD4+ thresholds. Beyond lack of access to ART, those who are diagnosed but not linked to or retained in care are also likely to account for the loss in numbers from the continuum at this stage.
Viral suppression rates are not expected to be 100% in any country, given that this figure will always include individuals who, at any 1 time, are newly diagnosed and/or have recently initiated ART and not yet reached viral suppression. However, this stage accounts for an appreciable proportion of potential HIV transmission, and the use of drugs in ART regimens that lead to rapid reductions in viremia after ART initiation is the key to reducing the risk of HIV transmission from treated individuals.
Limitations
The major limitation to our findings is that there is no centralized quality assurance mechanism for all countries in the region, and limited information was provided by countries on how exactly these estimates were derived. For example, for stages 2, 3, and 4, countries responded on whether cohort or surveillance, or another source of data, was used, but not specifically on how the estimates were derived. Rather, we were reliant on accurate and robust data being provided by the appropriate authority in each country. Although standardized definitions for each stage of the care continuum were provided, it is unlikely that they were strictly applied by every country, often reflecting constraints on available data sources. Differences between countries may, therefore, be due to differences in methodology. Nonetheless, we take this opportunity to reiterate the call given by others14,16,17,24,25 and ourselves previously18,26 that countries should use at least broadly similar definitions.
The lack of a single source from which all stages of the continuum can be estimated or an identifier that allows for linkage across different sources of data was cited by many as a major challenge. Although the availability of national cohorts is a valuable resource, innovative solutions are called for where these do not exist, such as the creation of virtual national cohorts through regular contact between government agencies and the centers providing HIV care. Investment, training, and support to countries are also needed to overcome any limitations in financial and technical capacity for collecting and analyzing care continuum data.
The analyses reported here, together with policy outputs associated with the Dublin Declaration monitoring process,27 highlight the need for intensified efforts if the region is to achieve the 90-90-90 target. It is worth bearing in mind; however, that reaching this target is not the overarching goal, which is to eliminate new infections and deaths. Nonetheless, the target serves as a yardstick by which governments and program directors can measure the success of their HIV care programs and be alerted to key areas that need specific attention.
CONCLUSIONS
Based on the evidence, we conclude with a number of recommendations that will help the region to achieve and surpass the 90-90-90 target. First, HIV testing programs need to be strengthened in all subregions, but especially in Eastern Europe. Crucial to the effective implementation of any testing program is the production of the subnational estimates of the undiagnosed epidemic28 and the removal of barriers to testing. Second, to increase their uptake, national HIV testing policies need to incorporate innovative approaches to testing, including community-based testing, self-testing, and home sampling. Third, there is an urgent need to reduce missed opportunities for HIV diagnosis in health services, particularly in primary care, through the adoption of routine or opt-out testing, where appropriate, and by implementing indicator condition-guided testing. Fourth, because early initiation of ART has been shown to be efficacious in improving the health outcomes of PLHIV and in reducing their viral load that, in turn, reduces the risk of transmitting HIV to others, a “test and treat” policy needs to be implemented in all countries in line with international guidelines. Fifth, access to treatment needs to be available to all, and barriers to such access need to be identified and removed, referral mechanisms strengthened, and laws that discriminate against key populations eliminated. Finally, close attention to the quality of HIV treatment and care provided is needed, to maximize the chance that all patients achieve sustained viral suppression, including the use of routine laboratory monitoring and adherence support.
In conclusion, there are wide disparities in the HIV continuum of care in the WHO European Region. Although countries in the western subregion are generally closing in on reaching 90-90-90, many countries in the central and eastern subregions are lagging far behind. It is difficult to envisage that a country can achieve 90-90-90 if it is unable to produce an accurate estimate of this measure. Priority needs to be given to resources which allow countries to address the challenge of producing robust continuum estimates and tracking progress toward achieving that goal.
ACKNOWLEDGMENTS
The authors thank the members of the continuum of care framework contract advisory group for comments provided on an earlier version of this draft: Ivana Bozicevic, Brian Rice, Caroline Sabin, Dominique Van Beckhoven, and Benjamin Young. The authors also thank the representatives in each country who contributed to data collection and analyses of continuum of care estimates.
APPENDIX 1. Members of the ECDC Dublin Declaration Monitoring Network
Members of the ECDC Dublin Declaration monitoring network include: Roland Bani (Albania), Montse Gessé (Andorra), Samvel Grigoryan (Armenia), Irene Rueckerl, Bernhard Benka, Robert Zangerle (Austria), Esmira Almammadova (Azerbaijan), Daniel Reynders, Andre Sasse, Dominique Van Beckhoven (Belgium), Šerifa Godinjak, Drazenka Malicbegovic, Indira Hodzic (Bosnia and Herzegovina), Tonka Varleva (Bulgaria), Jasmina Pavlic, Tatjana Nemeth-Blazic (Croatia), Linos Hadjihannas, Anna Demetriou (Cyprus), Veronika Šikolová, Hana Janatova (Czech Republic), Jan Fouchard, Susan Cowan (Denmark), Kristi Rüütel, Anna-Liisa Pääsukene (Estonia), Henrikki Brummer-Korvenkontio (Finland), Jean-Christophe Comboroure. Florence Lot (France), Maia Tsereteli, Ana Aslanikashvili (Georgia), Gesa Kupfer, Ulrich Marcus, (Germany), Vasileia Konte (Greece), Katalin Szalay, Krisztina Tálas (Hungary), Guðrún Sigmundsdóttir (Iceland), Caroline Hurley, Fiona Lyons (Ireland), Daniel Chemtob, Rivka Rich (Israel), Francesco Maraglino, Anna Caraglia, Barbara Suligoi, Lella Cosmaro (Italy), Irina Ivanova Petrenko, Alla Yelizarieva, Aliya Bokazhanova (Kazakhstan), Laura Shehu, Pashk Buzhala [Kosovo (This designation is without prejudice to positions on status, and is in line with UNSC 1244 and the ICJ Opinion on the Kosovo Declaration of Independence.)], Aikul Ismailova, Nazgul Asybaliev, Talgat Mambetov, Saliya Karymbaeva, Umutkan Chokmorova, Lucia Yanbuhtina, (Kyrgyzstan), Šarlote Konova (Latvia), Irma Caplinskiene (Lithuania), Patrick Hoffman, Pierre Weicherding (Luxembourg), Jackie Maistre Melillo, Charmaine Gauci (Malta), Violeta Teutu, Tatiana Cotelnic-Harea (Moldova), Maja Milanović, Aleksandra Marjanovic, Alma Cicic (Montenegro), Silke David, Eline Op De Coul (Netherlands), Arild Johan Myrberg (Norway), Iwona Wawer, Piotr Wysocki, Adam Adamus, Wojciech Tomczynski (Poland), Antonio Diniz, Isabel Aldir, Teresa Melo (Portugal), Mariana Mardarescu (Romania), Danijela Simic, Sladjana Baros (Serbia), Peter Truska (Slovakia), Irena Klavs (Slovenia), Olivia Castillo, Begoña Rodríguez Ortiz de Salazar, Asuncion Diaz (Spain), Maria Axelsson, Louise Mannheimer, Kristina Ingemarsdotter Persson (Sweden), Stefan Enggist, Axel J. Schmidt (Switzerland), Alijon Soliev, Sayfuddin Karimov, Dilshod Sayburhonov (Tajikistan), Emel Özdemir Şahin (Turkey), Valerie Delpech, Peter Kirwan, Alison Brown, Sara Croxford, Sandra Okala (United Kingdom), Igor Kuzin, Olga Varetskaya (Ukraine), and Zulfiya Abdurakhimova, Nurmat Atabekov (Uzbekistan).
APPENDIX 2.
Questionnaires were sent to the Competent Bodies of the ECDC, their respective director's office and their nominated experts in each country. In some instances, it is the Ministries of Health that are responsible for reporting directly to the ECDC. Austria: Federal Ministry of Health, Belgium: Sciensano, Bulgaria: National Centre of Infectious and Parasitic Diseases, Croatia: Croatian National Institute of Public Health, Cyprus: Director of Medical and Public Health Services, Czech Republic: National Institute of Public Health, Denmark: Danish Health and Medicines Authority, Estonia: Health Board, Finland: National Institute for Health and Welfare, France: French Public Health Agency, Germany: Robert Koch Institute, Greece: Hellenic Centre for Disease Control and Prevention, Hungary: Deputy State Secretariat for Chief Medical Officer's Affairs of the Ministry of Human Capacities, Iceland: Centre for Health Security and Communicable Disease Control Directorate of Health, Ireland: Health Protection Surveillance Centre, Italy: Ministry of Health, Latvia: Centre for Disease Prevention and Control, Liechtenstein: Principality of Liechtenstein, Lithuania: Health Directorate, Malta: Superintendence of Public Health, Netherlands: National Institute for Public Health and Environment, Norway: Norwegian Institute of Public Health, Poland: National Institute of Public Health/National Institute of Hygiene, Portugal: Directorate General of Health, Romania: National Institute of Public Health, Slovakia: Public Health Authority of the Slovak Republic, Slovenia: National Institute of Public Health, Spain: Ministry of Health, Social Services and Equality, Sweden: Public Health Agency of Sweden, and United Kingdom: Public Health England. For countries outside the EU/EEA, the ECDC does not have Competent Bodies, in which case, the questionnaire was sent to the Ministry of Health contact points, national AIDS coordinators, or nominated national surveillance experts at public health institutes.
Footnotes
Supported by the European Centre for Disease Prevention and Control (contract number SC1 ECD.6571—ECDC/2016/028).
K.P., A.G., V.S., and A.v.S. have served on advisory boards for ViiV Healthcare, outside the submitted work. V.S. reports lecture fees from Gilead (2014, 2015) and MSD (2014), outside the submitted work. G.T. has received specific grants, outside the submitted work, paid to her institution from Gilead Sciences Europe and ECDC. M.R. has received grants from the ECDC, paid to her institution. A.v.S. reports grants from ECDC, during the conduct of the study, personal fees from Gilead Sciences, grants from the Dutch Ministry of Health, Welfare and Sport, and personal fees from Janssen Cilag, outside the submitted work. T.N. and A.P. declare that they are employed by the organisation funding this project. The remaining authors have no funding or conflicts of interest to disclose.
K.A., D.H., and T.N. constructed the questionnaire and collected the data with advice from A.P. T.N. liaised with and distributed the questionnaire to the relevant authorities in each country. K.P. wrote the first draft of the manuscript. A.G., T.N., and A.P. provided detailed feedback on early drafts. A.G., D.H., K.A., T.N., and K.P. analyzed the data. A.v.S., G.T., G.V., M.R., and V.S. provided expert opinion and technical advice, including methodologies and literature, related to the continuum of HIV care in Europe. All authors provided feedback on manuscript drafts and approved the final version. The European Centre of Disease Prevention and Control oversaw study design, distributed the questionnaire to the relevant authorities in participating countries, contributed to analyses, and coauthored the article. K.P. had full access to the data in the study and had final responsibility for the decision to submit the article for publication.
Members are listed at Appendix 1.
REFERENCES
- 1.World Health Organization. Adults and children estimated to be living with HIV, 2015, by WHO region. 2017. Available at: http://www.who.int/gho/hiv/epidemic/hiv_001.jpg. Accessed October 05, 2017.
- 2.World Health Organization. World Health Organisation Regional Office for Europe: countries. 2017. Available at: http://www.euro.who.int/en/countries. Accessed November 07, 2017.
- 3.World Health Organization. Global Health Observatory data repository: number of new HIV infections data by WHO region. 2017. Available at: http://apps.who.int/gho/data/view.main.HIVINCIDENCEREGIONv?lang=en. Accessed October 05, 2017.
- 4.UNAIDS. Ending AIDS Progress Towards the 90-90-90 Targets. Geneva, Switzerland: UNAIDS; 2017. [Google Scholar]
- 5.European Centre for Disease Prevention and Control and WHO Regional Office for Europe. HIV/AIDS Surveillance in Europe 2015. Stockholm, Sweden: ECDC; 2016. [Google Scholar]
- 6.European Centre for Disease Prevention and Control. Implementing the Dublin Declaration on Partnership to Fight HIV/AIDS in Europe and Central Asia: 2010 Progress Report. Stockholm, Sweden: ECDC; 2010. [Google Scholar]
- 7.European Centre for Disease Prevention and Control. 2014 Dublin Declaration Questionnaire. Stockholm, Sweden: ECDC; 2014. [Google Scholar]
- 8.Wilber JA, Barrow JG. Hypertension–a community problem. Am J Med. 1972;52:653–663. [DOI] [PubMed] [Google Scholar]
- 9.Gardner EM, McLees MP, Steiner JF, et al. The spectrum of engagement in HIV care and its relevance to test-and-treat strategies for prevention of HIV infection. Clin Infect Dis. 2011;52:793–800. [DOI] [PMC free article] [PubMed] [Google Scholar]
- 10.UNAIDS. 90-90-90 an Ambitious Target to Help End the AIDS Epidemic. Geneva, Switzerland: UNAIDS; 2014. [Google Scholar]
- 11.Phillips AN, Cambiano V, Miners A, et al. Potential impact on HIV incidence of higher HIV testing rates and earlier antiretroviral therapy initiation in MSM. AIDS. 2015;29:1855–1862. [DOI] [PMC free article] [PubMed] [Google Scholar]
- 12.European Commission. Eurostat: your key to European statistics. 2016. Available at: http://ec.europa.eu/eurostat. Accessed June 12, 2016.
- 13.Hallett TB, Eaton JW. A side door into care cascade for HIV-infected patients? J Acquir Immune Defic Syndr. 2013;63(suppl 2):S228–S232. [DOI] [PubMed] [Google Scholar]
- 14.Drew RS, Rice B, Ruutel K, et al. HIV continuum of care in Europe and Central Asia. HIV Med. 2017;18:490–499. [DOI] [PMC free article] [PubMed] [Google Scholar]
- 15.European Centre for Disease Prevention and Control. Thematic Report: HIV Continuum of Care. Monitoring Implementation of the Dublin Declaration on Partnership to Fight HIV/AIDS in Europe and Central Asia: 2014 Progress Report. Stockholm, Sweden; 2015. [Google Scholar]
- 16.Levi J, Raymond A, Pozniak A, et al. Can the UNAIDS 90-90-90 target be achieved? A systematic analysis of national HIV treatment cascades. BMJ Glob Health. 2016;1:e000010. [DOI] [PMC free article] [PubMed] [Google Scholar]
- 17.Granich R, Gupta S, Hall I, et al. Status and methodology of publicly available national HIV care continua and 90-90-90 targets: a systematic review. Plos Med. 2017;14:e1002253. [DOI] [PMC free article] [PubMed] [Google Scholar]
- 18.Gourlay A, Noori T, Pharris A, et al. The human immunodeficiency virus continuum of care in European Union Countries in 2013: data and challenges. Clin Infect Dis. 2017;64:1644–1656. [DOI] [PMC free article] [PubMed] [Google Scholar]
- 19.European Centre for Disease Prevention and Control. ECDC HIV Modelling Tool [software application]. Available at: http://ecdc.europa.eu/en/healthtopics/aids/Pages/hiv-modelling-tool.aspx. Version 1.0.1 ed. Stockholm: ECDC; 2015.
- 20.World Health Organization. Global Health Observatory data repository: number of people (all ages) living with HIV: estimates by country. 2017. Available at: http://apps.who.int/gho/data/node.main.620?lang=en. Accessed November 07, 2017.
- 21.INSIGHT START Study Group, Lundgren JD, Babiker AG, et al. Initiation of antiretroviral therapy in early asymptomatic HIV infection. N Engl J Med. 2015;373:795–807. [DOI] [PMC free article] [PubMed] [Google Scholar]
- 22.Stockholm ECDC, Danel C, Moh R, Gabillard D, et al. A trial of early antiretrovirals and isoniazid preventive therapy in Africa. N Engl J Med. 2015;373:808–822. [DOI] [PubMed] [Google Scholar]
- 23.World Health Organization. Consolidated Guidelines on the Use of Antiretroviral Drugs for Treating and Preventing HIV Infection 2016: Recommendations for a Public Health Approach. 2nd ed Geneva, Switzerland: WHO; 2016. [PubMed] [Google Scholar]
- 24.Lourenco L, Hull M, Nosyk B, et al. The need for standardisation of the HIV continuum of care. Lancet HIV. 2015;2:e225–6. [DOI] [PMC free article] [PubMed] [Google Scholar]
- 25.International Advisory Panel on HIV Care Continuum Optimization. IAPAC guidelines for optimizing the HIV care continuum for adults and adolescents. J Int Assoc Provid AIDS Care. 2015;14(suppl 1):S3–S34. [DOI] [PubMed] [Google Scholar]
- 26.Gourlay A, Pharris A, Noori T, et al. Towards standardized definitions for monitoring the continuum of HIV care in Europe. AIDS. 2017;31:2053–58. [DOI] [PMC free article] [PubMed] [Google Scholar]
- 27.European Centre for Disease Prevention and Control. Monitoring Implementation of the Dublin Declaration on Partnership to Fight HIV/AIDS in Europe and Central Asia: 2017 Progress Report. Stockholm, Sweden: ECDC; 2017. [Google Scholar]
- 28.Marty L, Cazein F, Pillonel J, et al. , HERMETIC study group. Mapping the HIV epidemic to improve prevention and care: the case of France. 21th International AIDS Conference, Durban; 2016.
- 29.UNAIDS. Methods for Deriving UNAIDS Estimates. Geneva, Switzerland: UNAIDS; 2016. [Google Scholar]
Associated Data
This section collects any data citations, data availability statements, or supplementary materials included in this article.
Data Availability Statement
The response rate to the Dublin Declaration questionnaire was high (48 of 55 countries, 87%). No continuum data were reported by 11 countries; 7 did not respond to the questionnaire, and 4 returned the questionnaire but provided no continuum data for any stage (Table 2 and Fig. 1).
TABLE 2.
WHO European Region Continuum of HIV Care Data Submitted by Subregions: The Dublin Declaration 2016
FIGURE 1.
Overall trends in rates of new HIV diagnoses in the WHO European Region (per 100,000 population) by subregion and whether HIV continuum data were reportedⱡ in the Dublin Declaration monitoring questionnaire 2016. ⱡThe Dublin Declaration questionnaire was not returned for Belarus, Former Yugoslav Republic of Macedonia, Liechtenstein, Monaco, Russian Federation, San Marino, and Turkmenistan, or the questionnaire was returned but no continuum of HIV care data were provided for any stage for Bosnia and Herzegovina, Finland, Iceland, and Turkey. Surveillance data for the entire period were not available for Bosnia and Herzegovina and Uzbekistan; thus, these countries are not included in the trends presented above. Data from the ECDC/WHO HIV/AIDS surveillance in Europe, 2015, was regrouped and analyzed for this graph.
Countries in the eastern subregion that did not report any continuum data had appreciably higher rates of new HIV diagnoses than eastern countries reporting continuum data, and the highest rates of new HIV diagnoses overall compared with other subregions (Fig. 1), largely because of the cases from Russia. In the western subregion, the situation was reversed with somewhat higher rates of new diagnoses in the countries reporting continuum data than those not reporting. Rates were altogether low in the central subregion.
Of the 44 countries providing continuum data, 37 provided data for stage 1 (number of PLHIV), 42 for stage 2 (number diagnosed), 42 for stage 3 (number on ART), and 31 for stage 4 (number suppressed). Twenty-nine countries provided data for all 4 stages enabling complete construction of each of these countries' continua to be made (Table 2).