Abstract
The University of California (UC) Davis Reading Center evaluated 19,961 scans from 981 subjects in two multiple sclerosis therapeutic trials with the aim of determining the influence of optical coherence tomography quality control procedures on error rates. There was no optical coherence tomography technician certification in Trial 1, and technicians had very limited monitoring and feedback during the trial in view of the fact that data were received retrospectively. However, technicians were certified in Trial 2 and submitted data in accordance with the protocol. Trial 2 scans had higher signal strengths, fewer errors, and more useable data than the scans in Trial 1. Thus, certified technicians and prompt transmission of data for ongoing quality control monitoring provided higher quality data in multiple sclerosis trials.
KEYWORDS: multiple sclerosis, neuro-ophthalmology, OCT, quality control, reading centre
INTRODUCTION
Optical coherence tomography (OCT) is a non-invasive imaging modality for obtaining cross-sectional images of the retina in vivo. It is analogous to ultrasound, but instead of using the echoes created by acoustic waves, it uses light reflections to acquire information about structures. The ability of OCT to quantify retinal nerve fibre layer (RNFL) and macular thickness provides an objective method for monitoring axonal injury and serves as a useful outcome measure in clinical trials of optic nerve disorders.1–7
The Reading Center at the University of California (UC), Davis, has served as both a visual field and an OCT reading centre and has participated in several multi-centre therapeutic clinical trials in multiple sclerosis (MS), glaucoma, and optic neuritis.8–11 OCT reading centres are valuable in clinical trials not only to provide quality data assessment, standardise procedures, and certify technicians, but also to implement the procedures necessary to reduce the number of poor (unusable) scans and improve the quality of OCT data. OCT quality control (QC) evaluation procedures used in the SCORE (Standard care versus COrticosteroid for REtinal Vein Occlusion) study were determined to be reproducible and used for multi-centre longitudinal studies of retinal vein occlusion,12 and there also have been several articles indicating the utility of quality control in OCT studies related to diagnosis and treatment of diseases of the retina and in glaucoma.13–17 There seem, however, to have been few attempts to evaluate OCT quality control in MS clinical trials.
The aim of a reading centre is to ensure high-quality data for patients participating in a clinical trial through the use of central readers. Unless the data are reliable and valid, this aim cannot be addressed.
The two MS therapeutic trials referred to here as “Trial 1” and “Trial 2”, utilized OCT scans to assess changes in visual structure associated with MS. Trial 1 involved relapsing-remitting MS patients, whereas Trial 2 involved secondary progressive MS patients. Both studies utilized QC procedures; however, Trial 2 technicians were certified for OCT, monitored for the quality of data, and were provided feedback from the beginning of the trial, whereas Trial 1 technicians had essentially no monitoring or feedback during the trial.
In this article, we describe the QC procedures for OCT scans and report on the comparison between the qualities of the OCT data in these two multi-centre MS therapeutic trials.
MATERIALS AND METHODS
The UC Davis OCT Reading Center evaluated 19,961 OCT scans from 981 subjects enrolled in the two MS therapeutic trials. Trial 1 involved 939 relapsing-remitting MS patients from 96 sites that submitted 18,733 OCT scans. Trial 2 involved 40 secondary progressive MS patients from 10 sites that submitted 2178 OCT scans. At the start of these trials, high-resolution OCT techniques were not widely available. Thus, all scans were supposed to be performed using Stratus TM time-domain OCT (Carl Zeiss Meditec, Inc., Dublin, CA) and were supposed to measure the retinal area encompassing the macula and the thickness of the retinal nerve fibre layer around the optic disc. Acceptable reproducibility has been reported by experienced centres using the Stratus OCT.12 It has historically been used to quantify RNFL thinning in patients with multiple sclerosis (MS) and/or optic neuritis under idealized conditions.1,3,4,17–21 The Stratus OCT with Retinal Nerve Fibre Layer (RNFL) Normative Database offers clinicians a quantitative tool for the comparison of the retinal nerve fibre layer in the human retina to a database of known normal subjects.22,23
Trial 1 required a total of 4 scans per visit: Fast Macular Thickness Map (2) and Fast RNFL Thickness (2). Trial 2 required a total of 18 scans per visit; Fast Macular Thickness Map (6), Fast RNFL Thickness (6), and RNFL Thickness (6).
TECHNICIAN CERTIFICATION
The Reading Centre certified technicians for OCT in Trial 2. Certification required passing a 10-question telephone examination to demonstrate familiarity with the data collection requirements and export of sample scans required for the study. Technician certification in some cases required repeated testing after feedback from the Reading Center. Following certification, the Reading Center continually monitored the data and provided feedback to the coordinators at the clinical sites. In Trial 1, the coordinators submitted OCT data based upon the Reading Center’s written protocol. However, there was no technician certification in Trial 1. Ongoing monitoring and feedback from the Reading Center was limited as retrospective data were received in batches. Any feedback given to the technicians was given after the scans had already been acquired and received by the Reading Center. The Reading Center received very few follow-up data after the QC information on retrospective data had been provided thus improvement based on this follow-up data could not be adequately measured.
Quality Control Assessment
The Reading Center’s central readers (first and last authors, J.K. and J.W.) reviewed and evaluated all 19,961 OCT scans for quality control (QC) measures.
Test Parameter and Shipping Error Assessment
The quality control system addressed three areas of clinic performance: test parameter errors, shipping errors, and scan quality (proper alignment and usability). Test parameter errors included signal strength <7, extra scans performed, wrong scan used, scans performed on the wrong instrument, and scans requiring redraws (due to segmentation artifacts). Shipping errors included exported data missing and missing scans.
Unusable Scans (Objective Method)
A scan was determined to be unusable if it was missing, performed as a wrong scan, or performed on the wrong instrument.
Scan Quality for Proper Alignment and Usability (Masked Evaluation)
Because Trial 1 did not have technician certification at any time, we decided to perform a masked analysis on scan quality to remove any bias that may have occurred between reviewing the two trials. The two readers (J.K. and J.W.) evaluated and compared a subgroup analysis of 1200 randomly chosen scans (Trial 1 = 725; Trial 2 = 475) for proper alignment and usability in a masked fashion. A scan was determined to be unusable if it was performed with a low signal strength (<7), contained an artifact, or was not properly aligned or both. Furthermore, each scan was individually reviewed by the Reading Center, and parameters were entered in a 4th dimension database software program. Data were assigned a 100-point value and penalized according to any errors or protocol deviations.
RESULTS
Test Parameter Errors
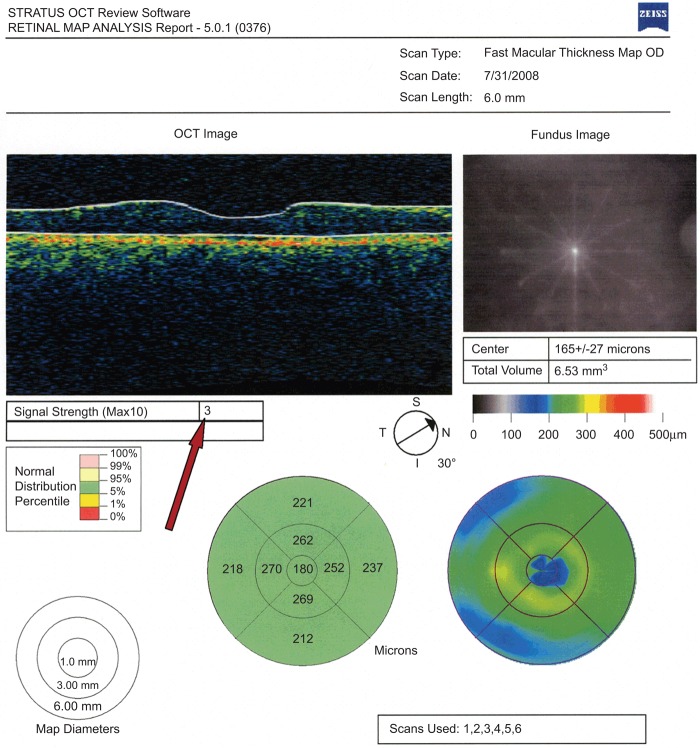
As shown in Table 1, more protocol deviations occurred in Trial 1 than in Trial 2. A total of 23.2% (4,353/18,733) of the scans in Trial 1 had a signal strength <7, whereas 3.7% (81/2,178) had a signal strength <7 in Trial 2 (Figure 1). A substantial number of extra scans were performed in Trial 1 compared with Trial 2. A total of 2537 (13.5%) extra scans were generated in Trial 1, compared with 29 (1.3%) in Trial 2. The wrong instrument was used more frequently in Trial 1, with 269 (1.4%) scans performed on the Cirrus (218), Topcon (42), or Heidelberg (9) instruments. Trial 2 had no scans performed on the wrong instrument. Scans requiring redraw of the segmentation were more prevalent in Trial 1 than in Trial 2, with 126 scans in Trial 1 versus 0 scans in Trial 2.
TABLE 1 .
Test parameter and shipping errors quality control summary.
| No. of scans |
||||
|---|---|---|---|---|
| Trial 1 N = 939 subjects 96 sites | % | Trial 2 N = 40 subjects 10 sites | % | |
| Total scans | 18,733 | 2178 | ||
| Errors: | ||||
| Signal strength <7 | 4353 | 23.2% | 81 | 3.7% |
| Manual entry (exported data missing) | 4114 | 22.0% | 0 | 0% |
| Extra scans performed | 2537 | 13.5% | 29 | 1.3% |
| Missing scans | 475 | 2.5% | 34 | 1.6% |
| Wrong scans | 448 | 2.4% | 42 | 1.9% |
| Wrong instrument used | 269 | 1.4% | 0 | 0% |
| Topcon scans | 42 | 0.2% | n/a | |
| Cirrus scans | 218 | 1.2% | n/a | |
| Heidelberg | 9 | <1% | ||
| Redraws | 126 | <1% | 0 | 0% |
FIGURE 1 .
An arrow indicates a low signal strength in a fast macular thickness map of the right eye.
Shipping Errors
Both trials required that OCT data be downloaded to a USB drive and sent to the Reading Center for processing. Trial 1 had 22.0% (4,114/18,733) of the scans missing the exported data whereas Trial 2 had 0 scans with the same error. Without electronic data transfer, the Reading Center was responsible for manually entering the scans in the database, creating another potential source of error. Trial 1 also had 475 (2.5%) of the scans missing (scans not performed) whereas Trial 2 had 34 (1.6%).
Unusable Scans (Objective Method)
There were 475 (2.5%) missing scans, 448 (2.4%) scans performed using the wrong scan, and 269 (1.4%) scans performed on the wrong instrument in Trial 1 for a total of 1,192 (6.4%) unusable scans. In Trial 2, however, there were 34 (1.6%) missing scans, 42 (1.9%) wrong scans, and 0 (0%) scans performed on the wrong instrument for a total of 76 (3.5%) unusable scans.
Scan Quality for Proper Alignment and Usability (Masked Evaluation)
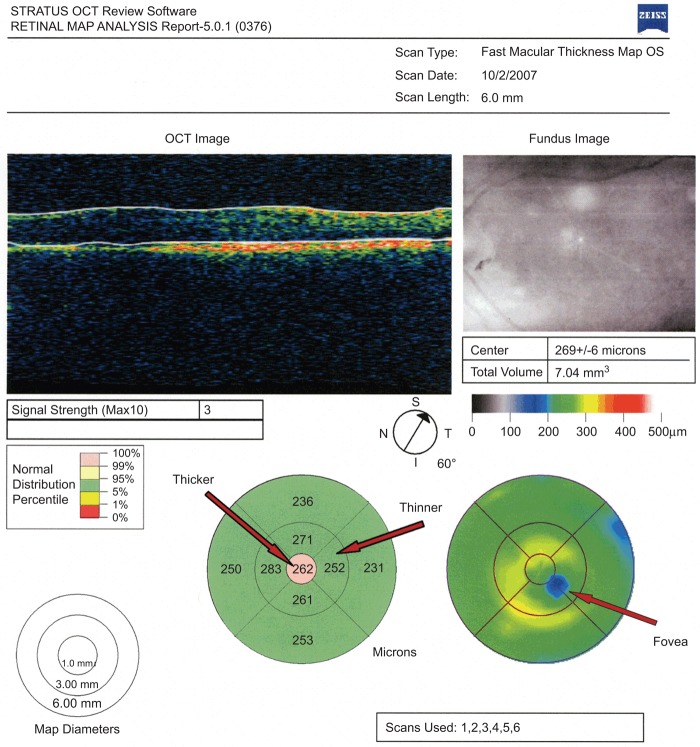
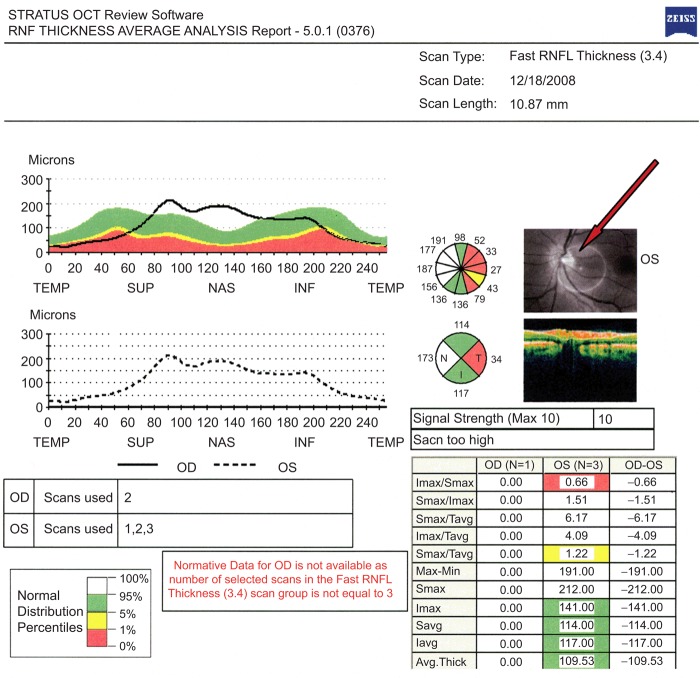
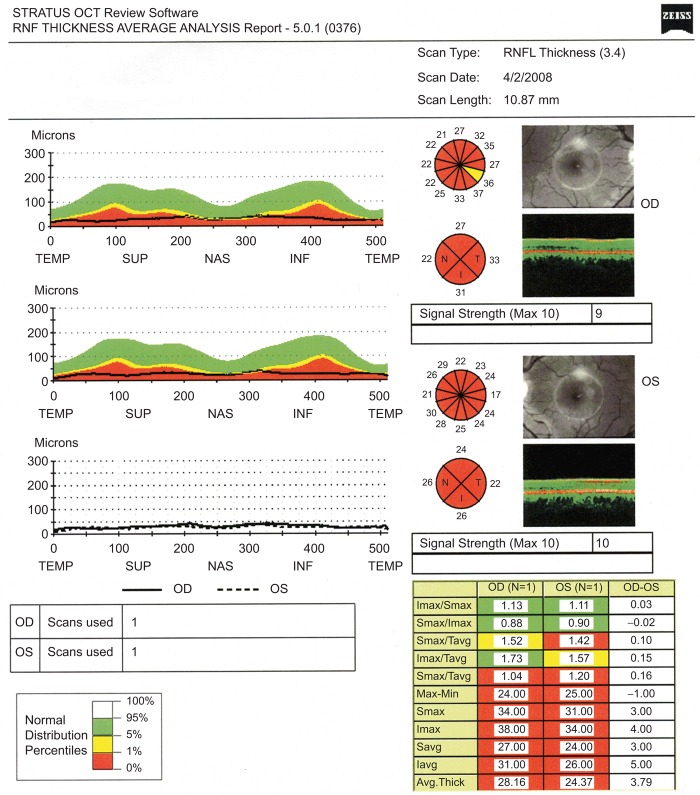
Proper centering of the macula and optic disc are essential for accurate RNFL thickness measurements. Slight misalignment can cause large deviations from the correct data values and generate erroneous data as shown in Figures 2 and 3. From the 1200 randomly chosen scans, 59.3% (429/725) of the scans were properly centred in Trial 1, whereas 74.7% (355/475) of the scans in Trial 2 were properly centred (Table 2). The readers determined that 21% (150/725) of the scans in Trial 1 were not useable, whereas 6% (29/475) of the scans were not useable in Trial 2. Scans not properly centred have erroneous values and will most likely be rendered unusable for data analyses. Figure 4 demonstrates RNFL scans that were rendered unusable because the macula was imaged instead of the optic nerve.
FIGURE 2 .
The far right arrow indicates misalignment of the macula in a fast macular thickness map of the left eye. The thicker and thinner arrows indicate the erroneous thickness values due to misalignment.
FIGURE 3 .
An arrow indicates misalignment of the optic nerve in a fast RNFL thickness scan of the left retina.
TABLE 2 .
Scan quality summary from 1,200 randomly chosen masked scans.
| No. of scans |
||||
|---|---|---|---|---|
| Trial 1 N = 939 subjects 96 sites | % | Trial 2 N = 40 subjects 10 sites | % | |
| Total scans | 725 | 475 | ||
| Properly centered | 429 | 59.3% | 355 | 74.7% |
| Not usable | 150 | 21% | 29 | 6% |
FIGURE 4 .
RNFL thickness scans intended to be centred on the right and left optic disc, but incorrectly aligned with the fovea.
DISCUSSION
The ability of OCT to quantify RNFL and macular thickness allows an objective method for monitoring axonal injury and potentially can serve as a useful outcome measure in clinical trials of MS. In MS clinical trials, sequential OCT imaging may serve as a potential surrogate structural marker for, or complement to, the more time-consuming and expensive magnetic resonance imaging (MRI). This non-invasive technique thus may be useful in directing clinical response to pharmacotherapy.1–6,16,18–21,24–28 Although OCT will not replace MRI as an objective measure of MS progression, it may be a useful adjunct that provides additional information as a potential marker of neuronal pathology.
Patients with MS and a history of unilateral optic neuritis have RNFL thinning not only in affected eyes, but also in the unaffected fellow eyes as demonstrated by TD-OCT.2,4,6,18,26 MS patients with no history of acute optic neuritis have shown decreased RNFL thickness compared with eyes of healthy subjects, as measured by Stratus TD-OCT. This decrease has been found to correlate well with low-contrast letter acuity and contrast sensitivity in such patients.4,18 These findings are consistent with RNFL thinning in MS patients occurring on a chronic basis and not exclusively from acute optic neuritis, further warranting the use of OCT to follow disease progression and response to therapy.
Measurements of optic nerve atrophy in patients with MS and optic neuritis with MRI have recently been correlated with optic nerve thinning as measured by TD-OCT, further validating RNFL measurement as a potential surrogate structural marker for central nervous system imaging in clinical and research investigations in MS27,28. As retinal ganglion cells make up about one-third of the total macula thickness,29 attention has also been focused on following macular thickness reductions in demyelinating disease. An association between optic nerve RNFL thinning and macular volume reduction in patients with optic neuritis with or without MS has been reported with TD-OCT.1
The present paper shows the importance of QC in obtaining high-quality OCT data from MS clinical trials. The difference between the size of Trial 1 (939 subjects) and the size of Trial 2 (40 subjects) in this study is significant; thus it is important to note that larger studies are logistically going to be much more complicated than smaller ones. As shown in Trial 2, technicians who are trained and certified in a standard fashion generally produce reliable, high- quality OCT data by reducing signal strength errors, extra/unneeded scans, manual entry, missing scans, use of wrong instruments, and redraws of the segmentations. The dramatic differences between the quality of the data in these two MS clinical trials is well demonstrated in Tables 1 and 2. We believe these results are not surprising since there was no OCT technician certification in Trial 1, and technicians had very limited monitoring and feedback during the trial since data was received retrospectively.
To obtain high-quality data, OCT reading centres should be involved at the beginning stages of planning for any clinical trial in MS. Prompt transmission of OCT data to the reading centre for ongoing and intensive QC monitoring and rapid feedback to technicians helps to reduce the frequency of incorrect testing parameter and shipping errors. Many of the issues encountered in Trial 1 we believe could have been avoided had our reading centre been involved at the beginning of the MS clinical trial. Signal strength and the presence of artifacts have been shown to affect RNFL thickness measurements using Stratus OCT.15–17,30,31
In summary, the quantitative data and examples in Figures 1 to 4 demonstrate the utility of an OCT reading centre in MS clinical trials using OCT technology to monitor MS patients with RNFL or macula volume changes. To optimise data quality, it seems essential for an OCT reading centre to be involved from the earliest planning stages of the trial to ensure technicians are properly certified for OCT testing. Even after certification, it is important to provide continuous monitoring with rapid and constructive feedback upon submission of the data.
ACKNOWLEDGEMENT
These studies are based on industry-supported trials and are supported by Research to Prevent Blindness (RPB).
Declaration of interest: The authors report no conflicts of interest. The authors alone are responsible for the content and writing of the paper.
Note: Figures 1–4 of this article are available in colour online at www.informahealthcare.com/oph.
REFERENCES
- [1].Trip SA, Schlottmann PG, Jones SJ, Altmann DR, Garway-Heath DF, Thompson AJ, Plant GT, Miller DH. Retinal nerve fibre layer axonal loss and visual dysfunction in optic neuritis. Ann Neurol 2005;58:383–391. [DOI] [PubMed] [Google Scholar]
- [2].Costello F, Coupland S, Hodge W, Lorello GR, Koroluk J, Pan YI, Freedman MS, Zackon DH, Kardon RH. Quantifying axonal loss after optic neuritis with optical coherence tomography. Ann Neurol 2006;59:963–969. [DOI] [PubMed] [Google Scholar]
- [3].Noval S, Contreras I, Rebolleda G, Munoz-Negrete F. Optical coherence tomography in optic neuritis [letter]. Ophthalmology 2007;114:200. [DOI] [PubMed] [Google Scholar]
- [4].Fisher JB, Jacobs DA, Markowitz CE, Galetta SL, Volpe NJ, Nano-Schiavi ML, Baier ML, Frohman EM, Winslow H, Frohman TC, Calabresi PA, Maguire MG, Cutter GR, Balcer LJ. Relation of visual function in retinal nerve fiber layer thickness in multiple sclerosis. Ophthalmology 2006;113:324–332. [DOI] [PubMed] [Google Scholar]
- [5].Sergott RC. Optical coherence tomography: measuring in-vivo axonal survival and neuroprotection in multiple sclerosis and optic neuritis. Curr Opin Ophthalmol 2005;16:346–350. [DOI] [PubMed] [Google Scholar]
- [6].Frohman EM, Fujimoto JG, Frohman T, Calabresi PA, Cutter G, Balcer LJ. Optical coherence tomography: A window into the mechanism of multiple sclerosis. Nature Clinical Practice Neurology 2008;4:664–675. [DOI] [PMC free article] [PubMed] [Google Scholar]
- [7].Talman LS, Bisker ER, Sacket DJ, Long DA Jr, Galetta KM, Ratchford JN, Lile DJ, Farrell SK, Loguidice MJ, Remington G, Conger A, Frohman TC, Jacobs DA, Markowitz CE, Cutter GR, Ying GA, Dal Y, Maguire MG, Galetta SL, Frohman EM, Calabresi PA, Balcer LJ. Longitudinal study of vision and retinal nerve fiber layer thickness in multiple sclerosis. Ann Neurol 2010;67:749–760. [DOI] [PMC free article] [PubMed] [Google Scholar]
- [8].Keltner JL, Johnson CA, Beck RW, Cleary PA, Spurr JO, Optic Neuritis Study Group . Quality control functions of the Visual Field Reading Center (VFRC) for the Optic Neuritis Treatment Trial (ONTT). Controlled Clin Trials 1993;14:143–159. [DOI] [PubMed] [Google Scholar]
- [9].Keltner JL Johnson CA, Cello KE, Bandermann SE, Fan JJ, Levine RA, Kass MA, Gordon MO, and the Ocular Hypertension Treatment Study Group . Visual field quality control in the Ocular Hypertension Treatment Study (OHTS). J Glaucoma 2007;16:665–669. [DOI] [PubMed] [Google Scholar]
- [10].Keltner JL, Johnson CA, Cello KE, Dontchev M, Gal RL, Beck RW, for the Optic Neuritis Study Group . Visual field profile of optic neurtis. A final follow-up report from the Optic Neuritis Treatment Trial from baseline through 15 years. Arch Ophthalmol 2010;128:330–337. [DOI] [PMC free article] [PubMed] [Google Scholar]
- [11].Keltner JL, Johnson CA, Cello KE, Edwards MA, Bandermann SE, Kass MA, Gordon MO for the OHTS Study Group . Classification of visual field abnormalities in the Ocular Hypertension Treatment Study. Arch Ophthalmol 2003;121:643–650. [DOI] [PubMed] [Google Scholar]
- [12].Domalpally A, Blodi BA, Scott IU, Ip MS, Oden JL, Lauer AK, and VanVeldhuisen PC for the SCORE Study Investigator Group . The standard care vs corticosteroid for retinal vein occlusion (SCORE) study system for evaluation of optical coherence tomograms. Arch Ophthalmol 2009;127:1461–1467. [DOI] [PMC free article] [PubMed] [Google Scholar]
- [13].Costa RA, Calucci D, Skaf M, Cardillo JA, Castro JC, Melo LA, Martins MC, Kaiser PK. Optical coherence tomography 3: automatic delineation of the outer neural retinal boundary and its influence on retinal thickness measurements. Invest Ophthalmol Vis Sci 2004;45:2399–2406. [DOI] [PubMed] [Google Scholar]
- [14].Ishikawa H, Piette S, Liebmann JM, Ritch R. Detecting the inner and outer borders of the retinal nerve fiber layer using optical coherence tomography. Graefe’s Arch Clin Exp Ophthalmol 2002;240:362–371. [DOI] [PubMed] [Google Scholar]
- [15].Wu Z, Vazeen M, Varma R, Chopra V, Walsh AC, LaBree LD, Sadda SR. Factors associated with variability in retinal nerve fiber layer thickness measurements obtained by optical coherence tomography. Ophthalmology 2007;114:1505–1512. [DOI] [PubMed] [Google Scholar]
- [16].Ray R, Stinnett SS, Jaffe GJ. Evaluation of image artifact produced by optical coherence tomography of retinal pathology. Am J Ophthalmol 2005;139:18–29. [DOI] [PubMed] [Google Scholar]
- [17].Sadda SR, Wu Z, Walsh AC, Richine L, Dougall J, Cortez R, LaBree LD. Errors in retinal thickness measurements obtained by optical coherence tomography. Ophthalmology 2006;113:285–293. [DOI] [PubMed] [Google Scholar]
- [18].Pulicken M, Gordon-Lipkin E, Balcer LJ, Frohman E, Cutter G, Calabresi PA. Optical coherence tomography and disease subtype in multiple sclerosis. Neurology 2007;69:2085–2092. [DOI] [PubMed] [Google Scholar]
- [19].Sepulcre J, Murie-Fernandez M, Salinas-Alaman A, García-Layana A, Bejarano B, Villoslada P. Diagnostic accuracy of retinal abnormalities in predicting disease activity in MS. Neurology 2007;68:1488–1494. [DOI] [PubMed] [Google Scholar]
- [20].Cettomai D, Pulicken M, Gordon-Lipkin E, Salter A, Frohman TC, Conger A, Zhang X, Cutter G, Balcer LJ, Frohman EM, Calabresi PA. Reproducibility of optical coherence tomography in multiple sclerosis. Arch Neurol 2008;65:1218–1222. [DOI] [PubMed] [Google Scholar]
- [21].Ratchford JN, Quigg ME, Conger A, Frohman T, Frohman E, Balcer LJ, Calabresi PA, Kerr D. Optical coherence tomography helps differentiate neuromyelitis optica and MS optic neuropathies. Neurology 2009;73:302–308. [DOI] [PMC free article] [PubMed] [Google Scholar]
- [22].Patella VM. Establishment of Normative Reference Values for Retinal Never Fiber Layer Thickness Measurements. 2003. White paper. Carl Zeiss Meditec, Inc. [Google Scholar]
- [23].Carl Zeiss Meditec, Inc Stratus OCT Model 3000 Users Manual PN 2660021130591 REV A. 2003.
- [24].McDonald WI, Barnes D. The ocular manifestation of multiple sclerosis, I: abnormalities of the afferent visual system. J Neurol Neurosurg Psychiatry 1992;55:747–752. [DOI] [PMC free article] [PubMed] [Google Scholar]
- [25].Warner J, Lessell S. Neuro-ophthalmology of multiple sclerosis. Clin Neurosci 1994;2:180–188. [PubMed] [Google Scholar]
- [26].Parisi V, Manni G, Spadaro M, Colacino G, Restuccia R, Marchi S, Bucci MG, Pierelli F. Correlation between morphological and functional retinal impairment in multiple sclerosis patients. Invest Ophthalmol Vis Sci 1999;40:2520–2527. [PubMed] [Google Scholar]
- [27].Frohman EM, Dwyer MG, Frohman T, Cox JL, Salter A, Greenberg BM, Hussein S, Conger A, Calabresi P, Balcer LJ, Zivadinov R. Relationship of optic nerve and brain conventional and non-conventional MRI measures and retinal nerve fibre layer thickness, as assessed by OCT and GDx: a pilot study. J Neurol Sci 2009;282:96–105. [DOI] [PubMed] [Google Scholar]
- [28].Trip SA, Schlottmann PG, Jones SJ, Li WY, Garway-Heath DF, Thompson AJ, Plant GT, Miller DH. Optic nerve atrophy and retinal nerve fibre layer thinning following optic neuritis: evidence that axonal loss is a substrate of MRI-detected atrophy. Neuroimage 2006;31:286–293. [DOI] [PubMed] [Google Scholar]
- [29].Van Buren JM. The Retinal Ganglion Cell Layer. Springfield: Charles C., Thomas, 1963. [Google Scholar]
- [30].Cheung CY, Leung CK, Lin D, Pang CP, Lam DS. Relationship between retinal nerve fiber layer measurement and signal strength in optical coherence tomography. Ophthalmology 2008;115:1347–1351. [DOI] [PubMed] [Google Scholar]
- [31].Domalpally A, Danis RP, Zhang B, Myers D, Kruse CN. Quality issues in interpretation of optical coherence tomograms in macular diseases. Retina 2009;29: 775–781. [DOI] [PubMed] [Google Scholar]


