Abstract
Convective rainfall is often a large source of error in retrospective modeling applications. In particular, positive rainfall biases commonly exist during summer months due to overactive convective parameterizations. In this study, lightning assimilation was applied in the Kain-Fritsch (KF) convective scheme to improve retrospective simulations using the Weather Research and Forecasting (WRF) model. The assimilation method has a straightforward approach: force KF deep convection where lightning is observed and, optionally, suppress deep convection where lightning is absent. WRF simulations were made with and without lightning assimilation over the continental United States for July 2012, July 2013, and January 2013. The simulations were evaluated against NCEP stage-IV precipitation data and MADIS near-surface meteorological observations. In general, the use of lightning assimilation considerably improves the simulation of summertime rainfall. For example, the July 2012 monthly averaged bias of 6 h accumulated rainfall is reduced from 0.54 to 0.07 mm and the spatial correlation is increased from 0.21 to 0.43 when lightning assimilation is used. Statistical measures of near-surface meteorological variables also are improved. Consistent improvements also are seen for the July 2013 case. These results suggest that this lightning assimilation technique has the potential to substantially improve simulation of warm-season rainfall in retrospective WRF applications.
1. Introduction
Retrospective atmospheric simulations are an important component of regional climate, air quality, and case study research and applications. The accuracy of retrospective runs is essential to increase the credibility of such studies. A key issue limiting the realism of retrospective runs, among other factors, is the simulation of deep convection. Regional climate models (RCMs) and air quality models typically use resolutions that cannot explicitly resolve deep convection and therefore rely on convective parameterizations. However, the use of convective parameterization can have negative impacts on simulated rainfall [e.g., Argüeso et al., 2011]. Previous RCM studies [e.g., Lo et al., 2008; Bukovsky and Karoly, 2009] using the Weather Research and Forecasting (WRF) model [Skamarock and Klemp, 2008] have identified large errors in its simulated precipitation. In particular, positive rainfall biases commonly exist during warm-season simulations [e.g., Otte et al., 2012; Bullock et al., 2014] because of an overactive convective parameterization. Alapaty et al. [2012] and Herwehe et al. [2014] introduced subgrid cloud radiation feedback within the Kain-Fritsch (KF) convective parameterization [Kain and Fritsch, 1990; Kain, 2004] as a way to mitigate this issue. This modification greatly improved results and reduced the overestimation, but positive biases still remain. Thus, a reasonable hypothesis is that further refinement of the subgrid convection, for example through the assimilation of precipitation-related observations, might improve rainfall simulation in retrospective WRF runs.
In the somewhat disparate field of real-time weather forecasting, a simple lightning assimilation technique was developed to improve the initialization of forecasts [e.g., Mansell et al., 2007; Lagouvardos et al., 2013; Giannaros et al., 2016]. The assimilation technique has a straightforward approach of activating parameterized deep convection where lightning is observed and, optionally, suppressing deep convection where lightning is absent. Rather than using relationships between lightning and latent heating rates, this technique, which is based on Rogers et al. [2000], simply triggers the convective scheme where lightning is observed and allows the parameterization to estimate the net effects of the resulting deep convection. Mansell et al. [2007] applied this method using the older KF scheme [Kain and Fritsch, 1990] in the Coupled Ocean-Atmosphere Mesoscale Prediction System model. They made simulations with a 24 h spin-up period during which lightning assimilation was used. They found more realistic representation of the timing, intensity, and areal coverage of deep convection during the spin-up period, which then improved a pure forecast that followed. Mansell et al. [2007] recommended forcing deep convection in grid cells where lightning was observed and suppressing deep convection in grid cells where lightning was absent to achieve optimal results. Giannaros et al. [2016] implemented the method of Mansell et al. [2007] into the WRF model. For their study, they used a 6 h spin-up period to initialize 24 h pure forecasts. Their results showed statistical improvements in precipitation forecasts when lightning assimilation was used during spin-up. They also found that lightning assimilation improved the representation of the mesoscale environment due to better initialization of cold pools and low-level winds.
Although Mansell et al. [2007] and Giannaros et al. [2016] were focused on real-time forecasting, these studies showed considerable improvements in simulated rainfall during the spin-up periods preceding their forecasts [e.g., Mansell et al., 2007, Figure 5]. Retrospective simulations, however, benefit from assimilating observations throughout the entire run, not just during the spin-up [e.g., Liu et al. 2008]. Therefore, in retrospective applications, we propose that this assimilation technique can be used to continuously “nudge” the parameterized convection toward observations, allowing the improvements Mansell et al. [2007] and Giannaros et al. [2016] had during the spin-up period to be realized throughout the entire simulation. This approach might be useful for generating climatological maps of precipitation for resource management agencies or for providing meteorological inputs for retrospective air quality simulations made by regulatory agencies.
Figure 5.
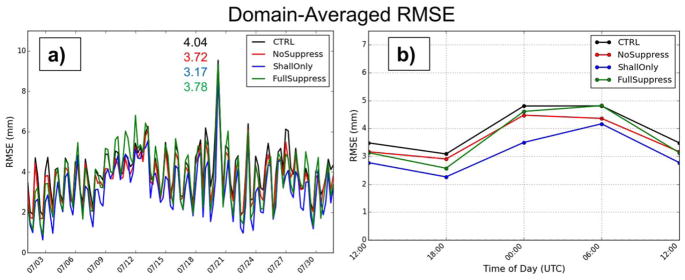
(a) Time series of domain-averaged RMSE of 6 h rainfall accumulation (mm). The monthly averaged values are shown next to the legend for each simulation. (b) Domain-averaged RMSE aggregated by time of day (UTC).
The goal of this study is to evaluate the impacts and potential advantages of using lightning assimilation in retrospective WRF simulations. We adapt the assimilation technique of Mansell et al. [2007] to the newer version of KF [Kain, 2004] and also develop a new suppression option that allows shallow convection in grid cells where lightning is absent. Simulations are made with 12 km grid spacing for July 2012, July 2013, and January 2013. In section 2, we thoroughly describe the lightning assimilation technique. Section 3 provides the details of our WRF simulations and our data sources. Section 4 evaluates the results of simulations with and without lightning assimilation for our two warm-season months (July 2012 and 2013). Section 5 briefly presents results for a cold-season case (January 2013), where we anticipate less impacts from the lightning assimilation. We summarize the work and provide our key conclusions in section 6.
2. Lightning Assimilation Method
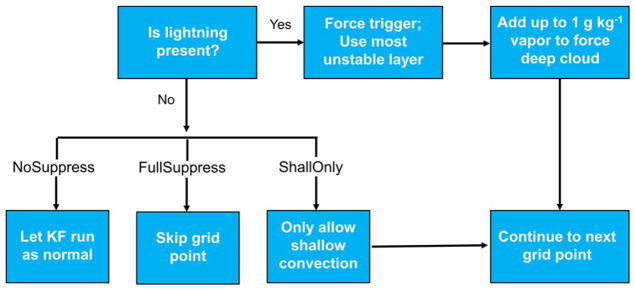
The assimilation technique used here is based on Mansell et al. [2007], Lagouvardos et al. [2013], and Giannaros et al. [2016]. The method uses a simple concept: activate KF deep convection where lightning is observed. Additionally, parameterized convection can be suppressed where lightning is not observed. Figure 1 summarizes the decision process for the assimilation technique.
Figure 1.
Decision process for lightning assimilation at each grid point. See text for additional details.
The KF scheme uses a specified minimum cloud depth, which is a function of the cloud base temperature, to activate deep convection. However, when lightning is present in a grid box, we have modified the standard criteria in an effort to be more consistent with the presence of lightning. Specifically, for a cloud base temperature greater than or equal to 20°C, the cloud depth must be at least 6 km with a cloud top temperature less than −20°C. For a cloud base temperature less than 20°C, the cloud depth must be at least 4 km and the cloud top temperature must be less than −20°C. These criteria were used as reasonable choices to ensure that the subgrid clouds were deep enough to have a mixed-phased layer supportive of lightning [e.g., Mansell et al., 2007; Bruning et al., 2014; Preston and Fuelberg, 2015].
The KF scheme is called at 5 min intervals during the WRF integration. For each KF call at each grid point, the code searches for lightning within −5 min and +15 min of the current time. If lightning is present, the most unstable layer, defined as the layer with the highest moist static energy, is found and used as the updraft source layer (USL) within KF. Then, as in Mansell et al. [2007], inversions below 6 km and convective inhibition are ignored for that parcel and the KF scheme goes through its normal updraft calculations. If the parcel becomes negatively buoyant during the updraft calculations, entrainment and detrainment are turned off in that vertical layer. After the updraft calculations, if the resulting cloud meets the criteria for deep convection, the KF scheme continues as normal. However, if the cloud does not meet the requirements for deep convection, water vapor is added to the USL using increments of 0.1 g kg−1. The updraft calculations are repeated for each addition of moisture until deep convection is forced. If deep convection cannot be achieved after 1 g kg−1 of water vapor has been added to the USL, no further action is taken and KF is not activated. Lastly, if the forcing technique leads to a disruption in the internal KF mass balance that will cause the scheme to halt, i.e., the absolute difference between the initial and ending column integrated water content is greater than 0.05% of the initial value, the lightning forcing is turned off for that grid point. Preliminary results show that this is rare, only occurring at approximately 0.002% of the lightning grid points in our simulations.
Three suppression options can be taken in grid cells where lightning is not observed (Figure 1). First, the KF scheme can be called as normal (NoSuppress). This allows either shallow or deep convection to be triggered based on the criteria in the standard KF scheme. The second option (FullSuppress) completely suppresses the KF scheme if lightning is not observed, i.e., the grid point is skipped by KF. These two suppression options are based on Mansell et al. [2007] and Giannaros et al. [2016]. However, those studies used the older version of KF [Kain and Fritsch, 1990] that did not produce shallow convection. Therefore, we introduce a third suppression option (ShallOnly), which allows only KF shallow convection in grid cells where lightning is not observed. In the KF scheme, shallow convection can still precipitate if the depth of the cloud exceeds approximately 50 hPa [Kain, 2004]. Because cumulus clouds in nature can form and precipitate without generating lightning, ShallOnly serves as a realistic optimization of the other two suppression techniques by allowing shallow clouds in grid cells where lightning is not observed.
3. Data Sources and WRF Simulations
3.1. NLDN Lightning Data
Cloud-to-ground lightning observations from the National Lightning Detection Network (NLDN) [Orville, 2008] were used for the assimilation described above. NLDN has a detection efficiency of 90%–95% and a location accuracy of approximately 500 m. We regridded the NLDN data during each simulation, i.e., we found the latitude and longitude bounds of each grid point and used that to search for lightning strikes that occurred within that grid cell. Although this is less efficient than regridding the NLDN data to our WRF domain prior to making each run, this approach provides more flexibility for changing both the model and cumulus time steps and for changing domain sizes and locations without needing to regrid the data for each simulation. Using 32 processors, the assimilation only added ~4% of integration time for each 1 month simulation.
3.2. Model Configurations
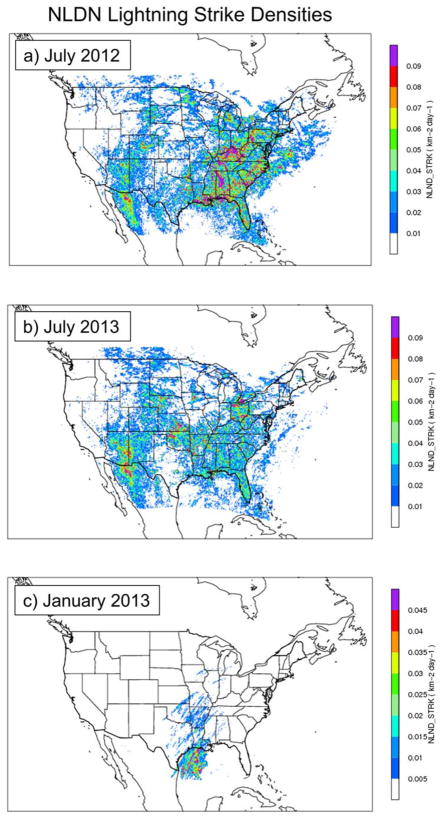
The lightning assimilation method was applied in WRF version 3.7.1 [Skamarock and Klemp, 2008]. Our simulations used 36 vertical levels and 12 km grid spacing with 472 × 312 grid points covering the continental United States. One month simulations were made for three different periods: July 2012, July 2013, and January 2013. Figure 2 shows the average NLDN lightning strike densities (strikes km−2 d−1) for each of these periods. The two July simulations were chosen to test the impacts of the assimilation technique in warm-season cases when lightning frequently occurred over our study domain (Figures 2a and 2b). These months also are when KF is typically overactive [e.g., Otte et al., 2012; Bullock et al., 2014]. January 2013 was chosen to test the assimilation method during a cold season case where most rainfall over the U.S. is driven by synoptic-scale weather systems that contain less lightning (Figure 2c). Therefore, we expect the lightning assimilation to have less impact for this case.
Figure 2.
Monthly averaged NLDN lightning strike densities (strikes km−2 d−1) for (a) July 2012, (b) July 2013, and (c) January 2013. The NLDN data are regridded to the 12 km WRF domain.
The simulations were run for 10 days prior to the first of each month as spin-up to initialize the deep soil temperature in the Pleim-Xiu land surface model (described below). Then, the simulations were restarted on the first of the month and run through the remainder of the month. From the restart at the beginning of the month, we conducted four different simulations: a control run (CTRL) that did not use lightning assimilation, a run that used lightning forcing but no suppression of KF convection (NoSuppress), a run that used lightning forcing and completely suppressed KF convection where lightning was not observed (FullSuppress), and a run that used lightning forcing and allowed only shallow KF convection where lightning was not observed (ShallOnly; see section 2 and Figure 1 for details of the assimilation methods). Results from July 2012 revealed deficiencies in the FullSuppress technique (to be described in section 4.2), and therefore FullSuppress simulations were not made for July 2013 or January 2013.
Initial and boundary conditions came from the North American Mesoscale (NAM) model 12 km analyses at 6 h intervals [Environmental Modeling Center/National Centers for Environmental Prediction/National Weather Service/NOAA/U.S. Department of Commerce, 2015]. All simulations used 36 vertical levels with a 50 hPa model top. The runs used a 60 s model time step and called the KF convective scheme every 5 min. Model output was saved every hour. Cloud microphysics were parameterized using the Morrison two-moment scheme [Morrison et al., 2009]. Short-wave and long-wave radiation were calculated using the RRTMG schemes [Iacono et al., 2008]. Radiation interacted with the KF subgrid convection using the formulation in Alapaty et al. [2012] and Herwehe et al. [2014]. The Asymmetric Convection Model 2 (ACM2) [Pleim, 2007] boundary layer scheme was used with the Pleim-Xiu surface layer [Pleim, 2006] and Pleim-Xiu land surface model (PX LSM) [Xiu and Pleim, 2001; Pleim and Xiu, 2003].
At the start of each simulation (22 December 2012, 21 June 2012, and 21 June 2013), the deep soil temperature in the PX LSM was initialized using the 10 day averaged 2 m temperature from NAM using the Intermediate Processor for Pleim-Xiu for WRF (IPXWRF; available online at http://www.wrf-model.org). Subsequently, during the 10 day spin-up, the indirect soil nudging in the PX LSM adjusted the soil moisture and temperature to reduce the bias of simulated 2 m temperature and 2 m water vapor mixing ratio [e.g., Pleim and Xiu, 2003; Gilliam and Pleim, 2010]. This 10 day spin-up is suggested by the developers of the PX LSM [document available online at http://www2.mmm.ucar.edu/wrf/users/docs/PX-ACM.pdf]. Once the simulations were restarted at the beginning of each month, the PX LSM continued its indirect nudging to correct biases in 2 m temperature and 2 m mixing ratio. The indirect nudging used surface observations (6 h intervals) that were blended into the NAM analysis using WRF’s OBSGRID tool.
All simulations also used four-dimensional data assimilation (FDDA) using the NAM analyses [Stauffer and Seaman, 1994; Liu et al., 2008]. The FDDA nudges temperature, winds, and moisture above the boundary layer. The nudging coefficient for temperature and winds was 1×10⁻⁴ s−1 and the coefficient for moisture was 1×10⁻⁵ s−1, similar to those of Gilliam and Pleim [2010] and Otte [2008].
3.3. NCEP Stage-IV Precipitation Data
The National Centers for Environmental Prediction (NCEP) stage-IV precipitation data [Lin and Mitchell, 2005] were used to evaluate the WRF-simulated precipitation fields. Stage-IV data are a combination of radar and rain gauge observations that have undergone human quality control at the National Weather Service River Forecast Centers. The data are available on a 4 km grid, which we then interpolated to our WRF 12 km grid. All comparisons use 6 h accumulations analyzed over terrestrial grid points only. We focus on the following performance statistics: mean absolute error (MAE), root-mean-square error (RMSE), mean bias (MB), and spatial correlation, which are calculated using the standard formulas in Wilks [1995]. The Gridded Analysis and Display System (GrADS) (documentation available at http://cola.gmu.edu/grads/gadoc/gadoc.php) is used for the interpolation of the stage-IV data and the calculation of the rainfall performance statistics.
3.4. Near-Surface Meteorological Observations
In addition to evaluating model precipitation, we also examine the impacts of lightning assimilation on simulated 2 m temperature (K), 2 m water vapor mixing ratio (g kg−1), and 10 m wind (m s−1). This evaluation is done using the Atmospheric Model Evaluation Tool (AMET) [Appel et al., 2011]. AMET pairs surface observations from the Meteorological Assimilation Data Ingest System (MADIS) data set with the model in both space (bilinear interpolation) and time (hourly). For the AMET comparisons, we focus on MAE and MB. These statistics are assessed spatially and collectively over the entire month.
4. Results for Warm-Season Cases: July 2012 and July 2013
4.1. Lightning Activation Statistics
We first present general results of the “activation success” for the three assimilation techniques. The NoSup-press runs activated an average of 70.5% of the grid cells with observed lightning for both month-long simulations. The FullSuppress simulation activated 80.3% of the lightning cells for its July 2012 run, while ShallOnly activated an average of 86% of the lightning grid cells. The increased activation success in ShallOnly is likely related to stability and moisture availability. In NoSuppress, deep convection can occur in grid cells where lightning is absent. This would act to remove moisture and stabilize the atmosphere. Therefore, allowing deep convection in nonlightning grid cells makes it harder to force deep convection in grid cells where lightning is observed. This is confirmed by the number of iterations that were needed to trigger deep convection in lightning grid cells. Of the 70.5% of lightning grid cells activated in NoSuppress, 16% required more than one iteration (i.e., more than 0.1 g kg−1 of moisture) to trigger deep convection. Of the 86% activated in ShallOnly, only 7% required more than one iteration. Thus, in ShallOnly, the suppression of deep convection where lightning is not observed has a complementary effect of making it easier to trigger deep convection where lightning is observed. Interestingly, FullSuppress has an activation success less than that of ShallOnly. As the next section will highlight, because grid points without lightning are skipped completely in FullSuppress, it actually generates convection with much higher rain rates at lightning grid points, presumably leaving less moisture available for subsequent convection.
4.2. Comparisons With Stage-IV Observations
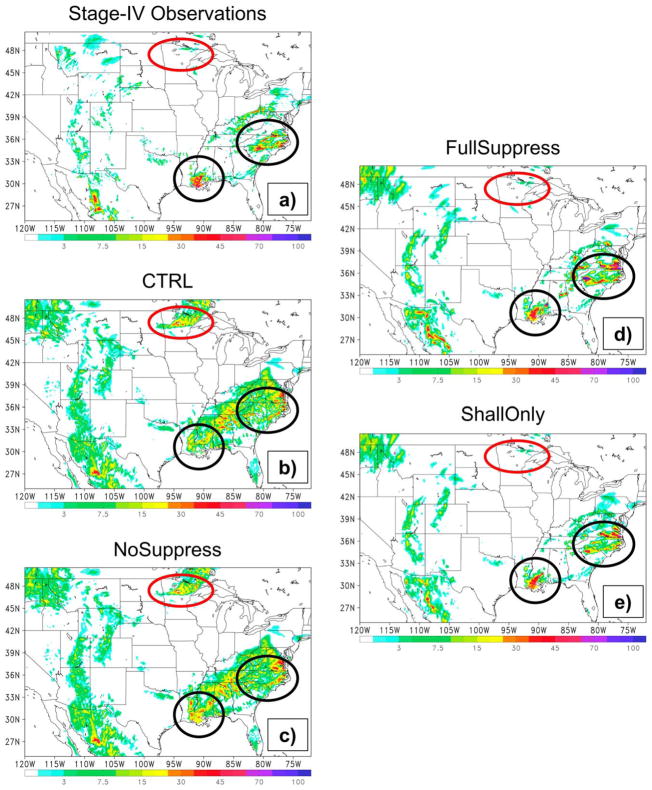
Figure 3 shows an example snapshot of the 6 h accumulated precipitation (mm) from the NCEP stage-IV observations (Figure 3a) and the WRF simulations (Figures 3b–3e) at 00 UTC 21 July 2012 (after 20 days of the simulation). In general, CTRL (Figure 3b) and NoSuppress (Figure 3c) produce widespread regions of light-to-moderate precipitation that do not agree with observations, a common issue with convective parameterizations [e.g., Randall et al., 2003; Stephens et al., 2010]. This is especially noticeable over the southeastern U.S. These two simulations also generate 6 h rainfall accumulations greater than 15 mm over northern Minnesota (red circle), which is not observed. FullSuppress (Figure 3d) and ShallOnly (Figure 3e), on the other hand, suppress this spurious convection and match the stage-IV observed spatial distributions remarkably well. For example, they both capture the heavy precipitation over southern Louisiana and the rainfall features in North Carolina and southern Virginia (denoted with black circles). However, FullSuppress tends to produce excessive rainfall in its convection (e.g., over the Carolinas in the black circle). This trend in FullSuppress was frequently observed during afternoon hours (not shown). Because KF is skipped at non-lightning grid cells in FullSuppress, this presumably supplies more convective available potential energy (CAPE) and moisture to storms that are activated at lightning grid cells, leading to the excessive precipitation seen in Figure 3d (and at most other afternoon snapshots that are not shown). ShallOnly (Figure 3e), on the other hand, produces realistic 6 h accumulation intensities and matches best with observations at this time.
Figure 3.
Six hour accumulated precipitation (mm) valid at 00 UTC 21 July 2012 for (a) stage-IV observations, (b) CTRL, (c) NoSuppress, (d) FullSuppress, and (e) ShallOnly. The circles indicate areas of interest that are discussed in the text.
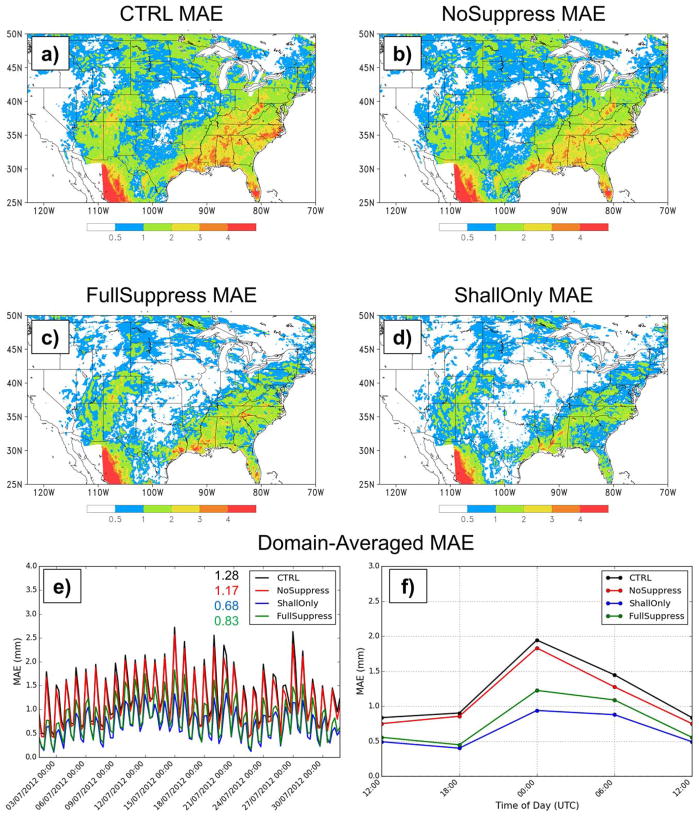
The improvements in ShallOnly persist throughout the entire simulation (Figures 4–7). The MAE is substantially improved in ShallOnly (Figure 4d) compared to the other three simulations, especially over the southeast U.S. The time series of domain-averaged MAE (Figure 4e) shows that ShallOnly improves results throughout the entire month. When aggregated by time of day (Figure 4f), the MAE for ShallOnly is also improved at all hours, but the largest improvements are between 18 and 06 UTC. The RMSE, which is more sensitive to outliers than MAE, also is improved in ShallOnly (Figure 5). However, the improvements are not as dramatic as in the MAE. At 06 UTC, the RMSE of FullSuppress (Figure 5b) is the same as the CTRL run, which is likely due to the excessive rainfall at lightning grid cells described above (see Figure 3d).
Figure 4.
Mean absolute error (mm) for July 2012 (averaged over the entire month) of 6 h accumulated rainfall for (a) CTRL, (b) NoSuppress, (c) FullSuppress, and (d) ShallOnly. (e) Time series of domain-averaged MAE, with the monthly averaged values shown next to the legend. (f) Domain-averaged MAE aggregated by time of day (UTC).
Figure 7.
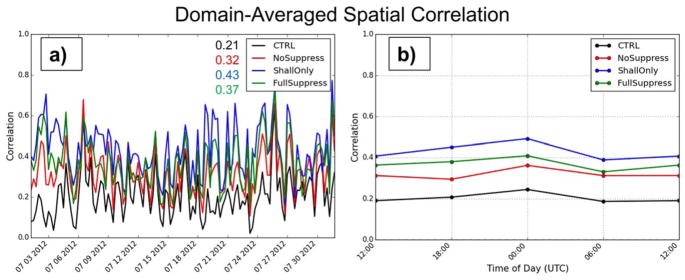
As in Figure 5, but for domain-averaged spatial correlation.
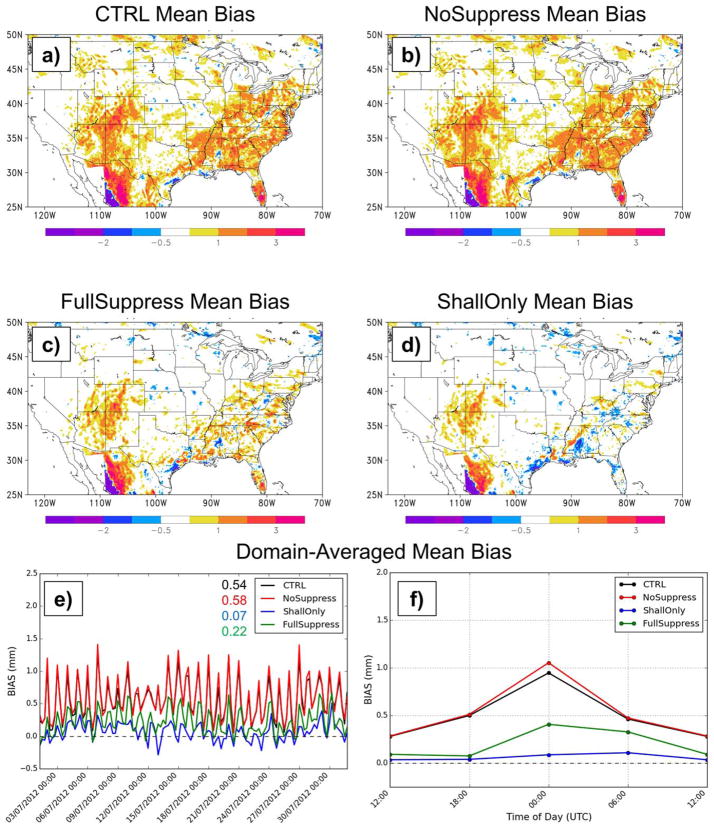
Mean bias performance (Figure 6) is similar to MAE, with ShallOnly again performing best, especially over the eastern half of the country. The domain- and monthly-averaged MB (Figure 6e) in ShallOnly (0.07 mm) is considerably improved when compared to CTRL (0.54 mm), NoSuppress (0.58 mm), and FullSuppress (0.22 mm). The aggregated MB (Figure 6f) reveals that ShallOnly performs best at all hours, with the largest improvements again occurring between 18 and 06 UTC. This corresponds to afternoon and evening hours over the U.S. when summertime lightning activity and convective precipitation are greatest. Thus, the largest improvements occur when convection is most active. The large positive bias in CTRL and NoSuppress at 00 UTC (Figure 6f) is reduced almost in half in FullSuppres and to nearly zero in ShallOnly. Therefore, suppressing deep convection where lightning is not observed helps reduce KF’s tendency to generate spurious convection during afternoon hours for our case. The slightly higher bias in NoSuppress compared to CTRL results from forcing deep convection in lightning grid cells without suppressing incorrectly placed convection, leading to excess rainfall. Similar increased biases have been seen in convective-permitting WRF simulations that used lightning assimilation without suppression [e.g., Fierro et al., 2012; Fierro et al., 2015; Marchand and Fuelberg, 2015]; however, suppression techniques become more complicated when convection is explicitly resolved.
Figure 6.
As in Figure 4, but for mean bias (mm).
Lastly, the domain-averaged and time aggregated spatial correlations (Figure 7) also show considerable improvements in ShallOnly when compared to the other simulations. For example, the monthly averaged spatial correlation in ShallOnly is a factor of two greater than that of CTRL, 0.11 greater than NoSuppress, and 0.06 greater than FullSuppress. Similar to the MAE, RMSE, and MB, the improvements in ShallOnly exist at all hours of the day (Figure 7b).
Overall, forcing KF subgrid deep convection where lightning is observed and only allowing shallow subgrid convection where lightning is not observed (ShallOnly) greatly improves the simulation of precipitation for July 2012. The FullSuppress technique generally performed second best for all of the statistical metrics. However, individual snapshots of 6 h accumulated precipitation (Figure 3) revealed that, although FullSuppress improved the location of convection, the individual cells produced excessive precipitation and were not realistic. That is, the excessive precipitation partially offsets the gains from the better localization. Therefore, the improved statistical metrics appear to be a result of spatial and time averaging, not an overall improvement in the realism of the simulation. For this reason, the Full-Suppress technique will not be evaluated for July 2013 and January 2013.
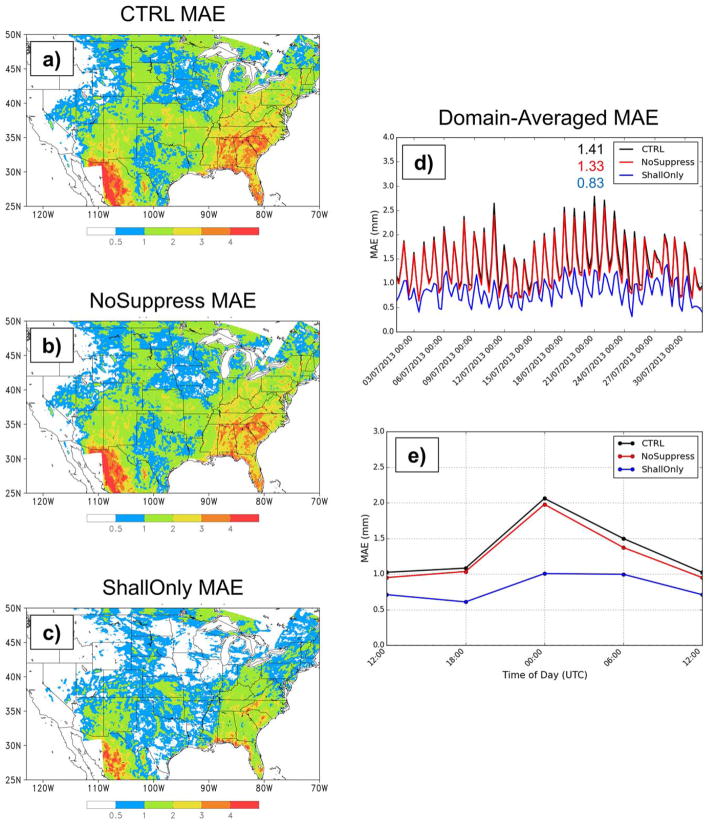
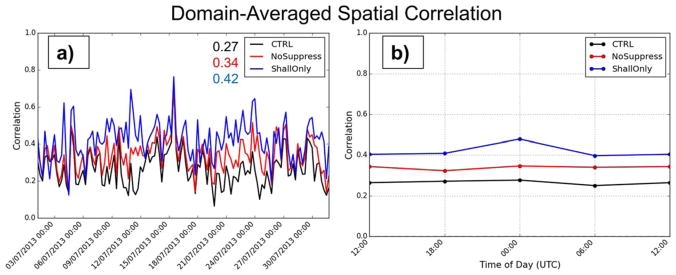
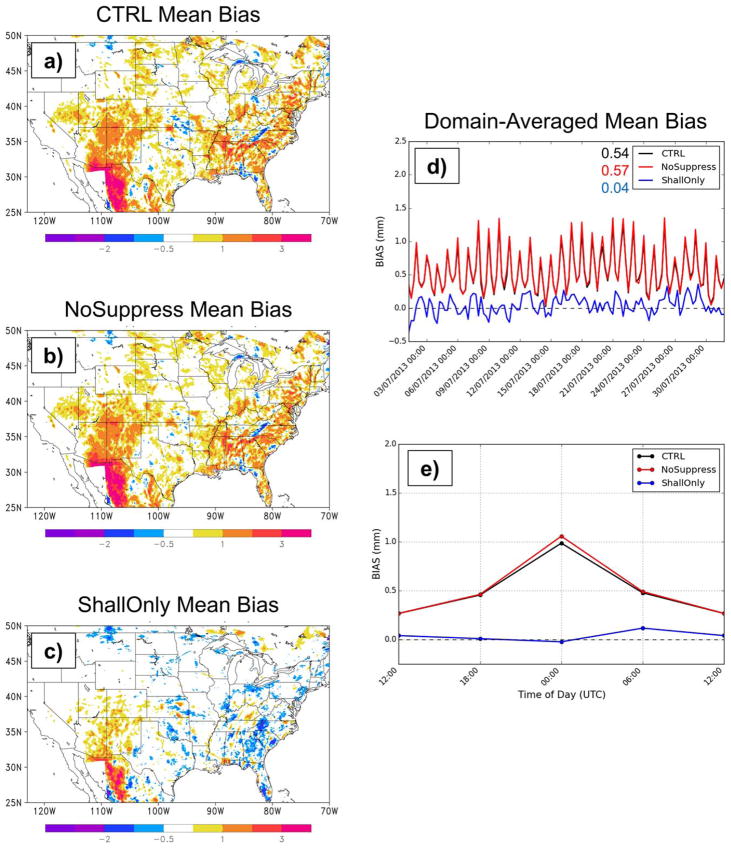
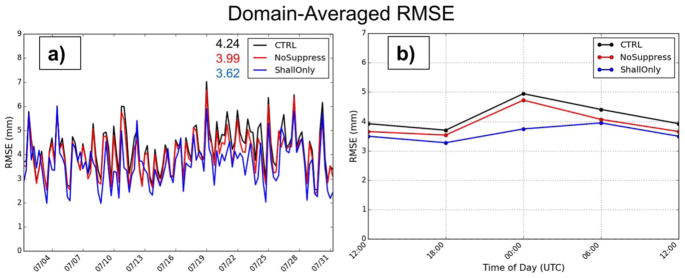
Figures 8–11 show the statistical results for the July 2013 simulations. Similar to July 2012, CTRL and NoSuppress produce larger MAE (Figure 8) and higher MB (Figure 10) than ShallOnly, especially over the Southeast U.S. For this month, the MB of ShallOnly is negative over portions of the southeast U.S. (Figure 10c), indicating that it might be slightly over suppressing convection in this region. Overall, however, the ShallOnly outperforms CTRL and NoSuppress is all statistical measures. For example, the domain-averaged and monthly averaged spatial correlation (Figure 11a) is again almost doubled in ShallOnly when compared to CTRL and 0.08 greater than NoSuppress. When aggregated by time of day, the MAE (Figure 8e), RMSE (Figure 9b), MB (Figure 10e), and spatial correlation (Figure 11b) are all improved at all hours, with the greatest improvements again occurring during afternoon hours (18–06 UTC). The robustness of the improvements in both of these warm-season cases indicates that the ShallOnly lightning assimilation technique provides a simple way to reduce the previously identified rainfall errors and greatly improve the simulation of precipitation in warm-season retrospective runs.
Figure 8.
Mean absolute error (mm) for July 2013 (averaged over the entire month) of 6 h accumulated rainfall for (a) CTRL, (b) NoSuppress, and (c) ShallOnly. (e) Time series of domain-averaged MAE, with the monthly averaged values shown next to the legend. (f) Domain-averaged MAE aggregated by time of day (UTC).
Figure 11.
As in Figure 7, but for July 2013.
Figure 10.
As in Figure 8, but for mean bias (mm).
Figure 9.
As in Figure 5, but for July 2013.
4.3. Near-Surface Meteorological Evaluation
Another method of evaluating the general performance of the simulations is to use all of the MADIS observations (section 3.4) to compute domain-wide MAE and MB of 2 m temperature (K), 2 m mixing ratio (g kg−1), and 10 m wind speed (m s−1) for each month. These results are shown in Table 1. These near-surface parameters are influenced most by the indirect soil nudging within the PX LSM [e.g., Gilliam and Pleim, 2010]. However, when compared to CTRL and NoSuppress, ShallOnly does slightly improve the simulation of 2 m temperature and 2 m mixing ratio, presumably because of its better representation of deep convective rainfall (section 4.2) and interactions of the deep convective clouds with radiation [Herwehe et al., 2014]. ShallOnly also has a lower 10 m wind speed MAE, but a slightly higher 10 m wind speed MB (Table 1). This likely is due to stronger outflow boundaries associated with the more focused convection in ShallOnly. The performance of CTRL and NoSuppress are similar, indicating that lightning assimilation without suppression does not substantially change the simulation of near-surface meteorological variables for our cases.
Table 1.
Summary of the Mean Absolute Error and Mean Bias (Shown in Parentheses) Performance Statistics for Each Simulationa
| MAE (MB) | CTRL | NoSuppress | ShallOnly |
|---|---|---|---|
| 2 m Temperature (K) | |||
| July 2012 | 1.75 (−0.36) | 1.72 (−0.38) | 1.63 (−0.20) |
| July 2013 | 1.70 (−0.27) | 1.68 (−0.29) | 1.62 (−0.13) |
| January 2013 | 1.89 (−0.05) | 1.89 (−0.05) | 1.84 (−0.09) |
| 2 m Mixing Ratio (g kg−1) | |||
| July 2012 | 1.66 (0.95) | 1.66 (0.96) | 1.51 (0.78) |
| July 2013 | 1.35 (0.50) | 1.35 (0.51) | 1.26 (0.40) |
| January 2013 | 0.54 (0.22) | 0.54 (0.22) | 0.51 (0.18) |
| 10 m Wind Speed (m s−1) | |||
| July 2012 | 1.23 (0.28) | 1.22 (0.28) | 1.21 (0.31) |
| July 2013 | 1.24 (0.36) | 1.24 (0.36) | 1.22 (0.38) |
| January 2013 | 1.35 (0.36) | 1.35 (0.36) | 1.31 (0.34) |
Bold indicates best performance.
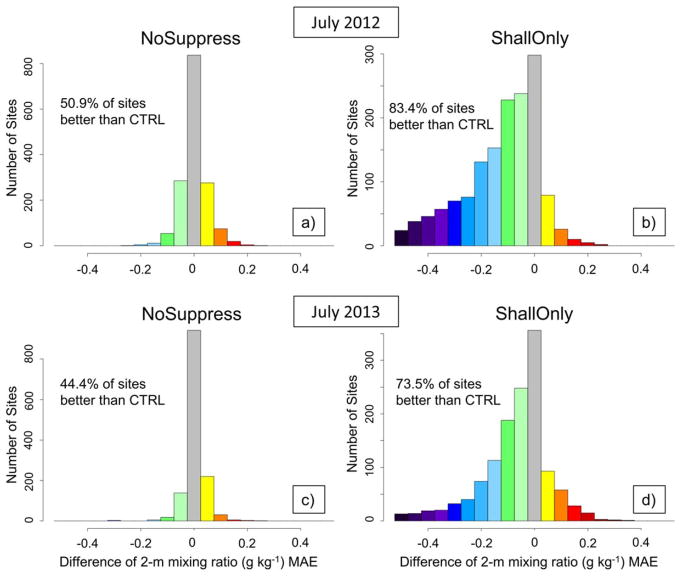
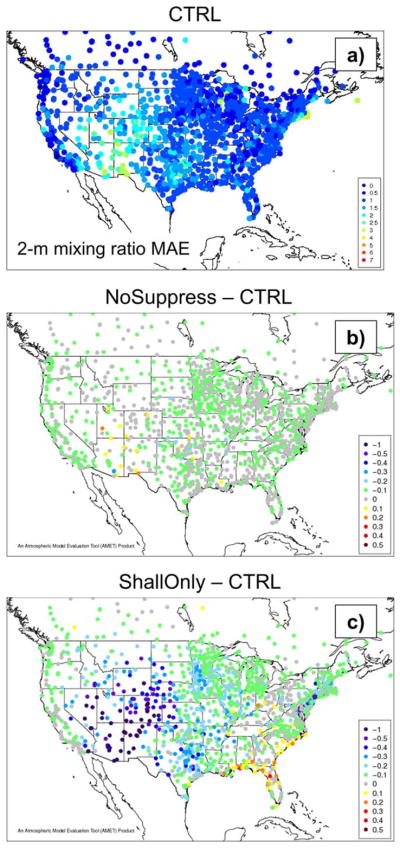
The number of observation sites at which the MAE of 2 m mixing ratio is improved or worsened by the two different lightning assimilation techniques is shown in Figure 12. The x axis of each plot in Figure 12 shows the difference in MAE for each assimilation method when compared to CTRL and the y axis shows the number of sites. Cool colors indicate that the MAE is reduced when compared to CTRL, i.e., the performance is improved. For July 2012, ShallOnly (Figure 12b) improves MAE at 83.4% of the sites, whereas NoSuppress (Figure 12a) improves MAE at 50.9% of the sites (note that these percentages include any improvement at all over CTRL). For July 2013, ShallOnly (Figure 12d) improves results at 73.5% of the sites, whereas MAE of 2 m mixing ratio actually is degraded at 55.6% of the sites in NoSuppress (Figure 12c). Figure 13 displays the spatial distribution of the monthly averaged 2 m mixing ratio MAE for CTRL (Figure 13a) and the difference between NoSuppress and CTRL (Figure 13b), and ShallOnly and CTRL (Figure 13c) for July 2013 (each dot in Figure 13 is a MADIS observation site). In general, CTRL’s largest errors are over the Southwest, Rockies, and Southern Plains. NoSuppress slightly increases the MAE over the Southwest and shows little or no improvement over the rest of the country. ShallOnly increases MAE over the eastern Gulf Coast and regions of Florida (Figure 13c). However, ShallOnly generally improves MAE nationwide, with the largest improvements over the Southwest, Rockies, and Southern Plains, the same regions where CTRL and NoSuppress performed worst. CTRL and NoSuppress generally had positive rainfall biases nationwide, but they were particularly high in the Southwestern region (Figures 6 and 10), helping explain the higher 2 m mixing ratio MAE (Figures 13a and 13b). This general performance trend also existed for July 2012 (not shown).
Figure 12.
Histograms of the number of sites where 2 m water vapor mixing ratio MAE is improved or degraded when compared to CTRL. The y axis is the number of sites and the x axis is the difference of the 2 m mixing ratio (g kg−1) MAE between each assimilation method and the CTRL (e.g., NoSuppress − CTRL is shown in Figures 12a and 12c) for (a,b) July 2012 and (c,d) July 2013. The left side of the grey bar centered on zero represents a performance increase compared to CTRL and the right side is a performance decrease compared to CTRL. The percentage of sites where performance was increased is also displayed for each histogram. Note that the percentages include any improvement over CTRL and therefore values in the grey bar are included in the calculation.
Figure 13.
(a) Spatially distributed 2 m water vapor mixing ratio MAE for CTRL averaged over July 2013. (b) Difference in 2 m mixing ratio MAE between NoSuppress and CTRL. (c) As in Figure 13b, but for ShallOnly. Each dot represents a MADIS observation site. In Figures 13b and 13c, cold colors (negative values) indicate a lower MAE than CTRL (i.e., better performance) and warm colors (positive values) indicate a higher MAE than CTRL (worse performance).
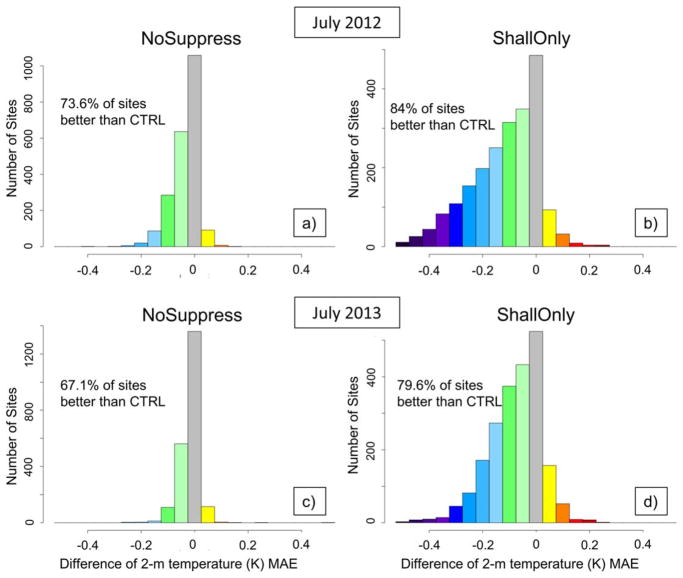
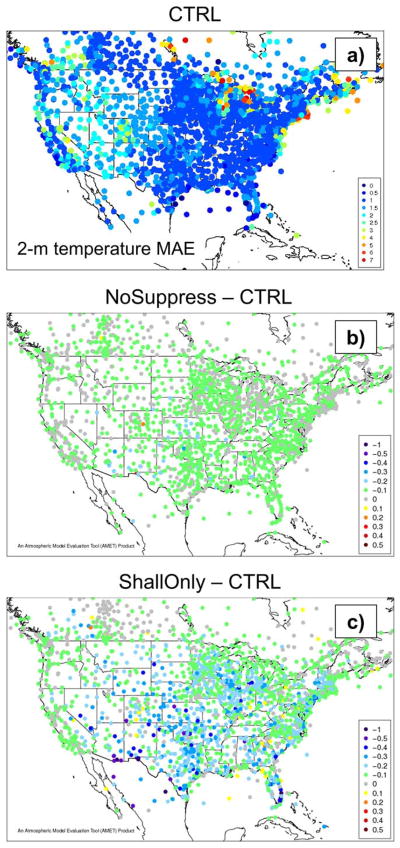
The MAE of 2 m temperature generally is improved by both assimilation techniques at a majority of the observations sites for July 2012 and 2013 (Figure 14). However, the magnitudes of the improvements are greater in ShallOnly (Figures 14b and 14d) than in NoSuppress (Figures 14a and 14c). Spatially, ShallOnly improves 2 m temperature MAE nationwide (Figure 15c), with the largest improvements over the Central and Southern Plains and the Southwest. Again, these improvements are likely related to both the better simulation of convective rainfall (section 4.2) and the interactions of the parameterized convective clouds with radiation.
Figure 14.
As in Figure 12, but for 2 m temperature (K).
Figure 15.
As in Figure 13, but for 2 m temperature (K).
To summarize, the ShallOnly technique greatly improved the simulation of precipitation and added value to the simulation of near-surface meteorological variables for our two warm-season cases. Forcing deep convection where lightning is observed and allowing only shallow convection where lightning is not observed appears to be the optimal lightning assimilation method for improving warm-season retrospective runs.
5. Results for Cold Season Case: January 2013
We expect lightning assimilation to be most useful during the summer months when lightning activity is greatest (e.g., Figure 2). However, it is necessary to evaluate the method for a cold season case to determine if value is added and, perhaps more importantly, to ensure that the assimilation does not degrade results for winter time cases when lightning is relatively infrequent (Figure 2c).
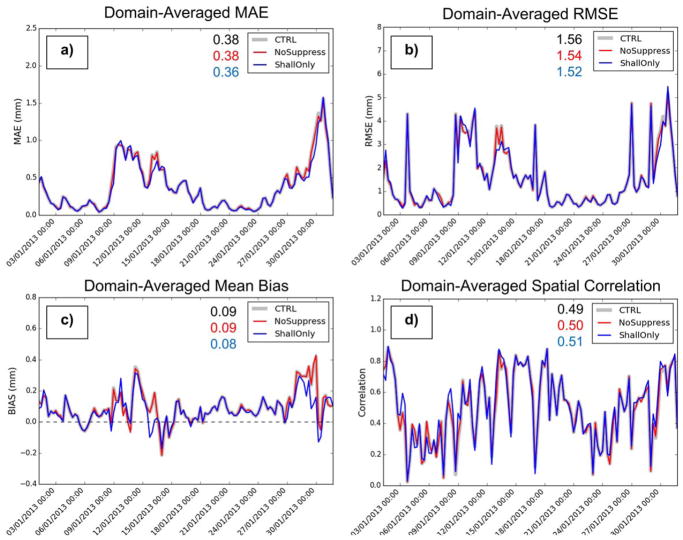
Figure 16 shows the domain-averaged statistical comparisons of the WRF simulations with the NCEP stage-IV observations for January 2013. In general, all of the simulations perform better during January than they did for July 2012 or July 2013 and the assimilation of lightning has only minor impacts on the results for this month. CTRL (grey), NoSuppress (red), and ShallOnly (blue) have similar MAE (Figure 16a), RMSE (Figure 16b), MB (Figure 16c), and spatial correlation (Figure 16d). Averaged over the entire month (numbers next to the legend in each panel), ShallOnly slightly outperforms CTRL and NoSuppress, but the improvements are small. Referring back to the near-surface meteorological statistics (Table 1), ShallOnly performs slightly better than CTRL and NoSuppress, but again the differences are small. Overall, ShallOnly, which performed best during the July cases, also slightly improves the cold season results. Therefore, the ShallOnly method likely can be applied in annual (or longer) simulations without any risk of degrading the results during the wintertime months. However, more simulations need to be made to test this supposition.
Figure 16.
Time series of domain-averaged performance statistics for January 2013. (a) Mean absolute error, (b) root-mean-square error, (c) mean bias, and (d) spatial correlation. The monthly averaged values are shown next to the legend in each plot.
6. Summary and Conclusions
A simple lightning assimilation technique was applied in the Kain-Fritsch (KF) cumulus scheme as a way to improve retrospective regional WRF simulations. The assimilation method has a straightforward approach: Force KF deep convection where cloud-to-ground lightning is detected by NLDN and, optionally, suppress deep convection where lightning is absent. In this study, we tested three assimilation options for retrospective applications. In the first option, NoSuppress, KF deep convection was forced where lightning was observed, but no action was taken where lightning was absent. Thus, shallow or deep convection still could occur in grid cells where lightning was not observed. In the second option, FullSuppress, convection was forced where lightning was observed and grid cells without lightning were completely skipped by KF. In the last option, ShallOnly, which was specifically developed for this study, KF deep convection was forced where lightning was observed and only KF shallow convection was allowed where lightning was not observed. Figure 1 summarizes the assimilation technique.
WRF was run with 12 km grid spacing for July 2012, July 2013, and January 2013 to test the assimilation techniques. We evaluated the simulations against NCEP stage-IV precipitation data and MADIS near-surface observations of 2 m temperature, 2 m water vapor mixing ratio, and 10 m wind speed. Our key conclusions were as follows:
In general, ShallOnly greatly improves results for the July simulations.
ShallOnly considerably improves rainfall spatial correlation, mean absolute error, and mean bias (July cases).
ShallOnly improves statistical measures of near-surface meteorological variables (July cases).
ShallOnly slightly improved results for the winter case (January 2013).
Forcing KF deep convection where lightning is present and allowing only shallow convection where lightning is absent is the optimal lightning assimilation method for improving retrospective WRF runs.
The lightning assimilation method presented in this study ultimately needs to be tested under additional conditions, for longer simulation periods, and different grid scales. Additionally, lightning data might not be available at high spatial or temporal resolutions in certain regions of the world, limiting the applicability of the method presented here. However, we believe that our results indicate that this assimilation technique has the potential to substantially improve simulation of warm-season rainfall in many retrospective applications where lightning data are available. For example, it could be used in case studies to improve results on coarser domains that provide boundary conditions to high-resolution domains. Additionally, the lightning assimilation method theoretically could be adapted to any convective parameterization in any model, not just KF and WRF. Currently, we are experimenting with global models with grid refinement, such as the Model for Prediction Across Scales (MPAS) [Skamarock et al., 2012], and an assimilation technique to improve precipitation will be important. The method also could be used to improve the meteorological component of both online and offline chemical transport models. We are currently collaborating with the authors of Giannaros et al. [2016] to add the assimilation technique to future public WRF releases but until then we encourage those interested to request a current version of the assimilation code.
Key Points.
Lightning assimilation was applied in the Kain-Fritsch convective parameterization in WRF
Lightning assimilation considerably improves mean bias, mean absolute error, and spatial correlation of WRF-simulated warm-season rainfall
Lightning assimilation improves statistical measures of near-surface meteorological variables
Acknowledgments
We would like to sincerely thank Ted Mansell (NOAA) for providing the Kain-Fritsch code used in his 2007 study. We also are grateful to Theodore Giannaros (National Observatory of Athens, Greece) for providing the WRF-LTNGDA code used in his 2016 study. Both of these codes were invaluable to implementing the assimilation technique into the newer Kain-Fritsch scheme. We are extremely appreciative of Steve Ansari (NOAA) and Stuart Hinson (NOAA) for their guidance in obtaining the NLDN lightning data. We thank Jerry Herwehe at the EPA for reviewing the paper and providing valuable comments and suggestions. We also thank the two reviewers, the Editor, and the Associate Editor for their comments and suggestions, which greatly improved the manuscript. The NAM input data used to drive our WRF simulations can be found online at http://rda.ucar.edu/datasets/ds609.0/. Stage-IV precipitation data that were used for evaluating the model can be obtained online at http://data.eol.ucar.edu/codiac/dss/id=21.093. MADIS data can be obtained online at https://madis.noaa.gov/user_resources.shtml. NLDN lightning data were obtained through a contract between the National Weather Service and Vaisala that allows any Federal Government agency to obtain the data. The large WRF output generated for this study can be requested on a case-by-case basis. While this work has been reviewed and cleared for publication by the U.S. EPA, the views expressed here are those of the authors and do not necessarily represent the official views or policies of the Agency.
References
- Alapaty K, Herwehe JA, Otte TL, Nolte CG, Bullock OR, Mallard MS, Kain JS, Dudhia J. Introducing subgrid-scale cloud feedbacks to radiation for regional meteorological and climate modeling. Geophys Res Lett. 2012;39:L24808. doi: 10.1029/2012GL054031. [DOI] [Google Scholar]
- Appel KW, Gilliam RC, Davis N, Zubrow A, Howard SC. Overview of the Atmospheric Model Evaluation Tool (AMET) v1.1 for evaluating meteorological and air quality models. Environ Modell Software. 2011;26:434–443. doi: 10.1016/j.envsoft.2010.09.007. [DOI] [Google Scholar]
- Argüeso D, Hidalgo-Munoz JM, Gamiz-Foris SR, Esteban-Parra MJ, Dudhia J, Castro-Diez Y. Evaluation of WRF parameterizations for climate studies over southern Spain using a multistep regionalization. J Clim. 2011;24(21):5633–5651. doi: 10.1175/JCLI-D-11-00071.1. [DOI] [Google Scholar]
- Bruning EC, Weiss SA, Calhoun KM. Continuous variability in thunderstorm primary electrification and an evaluation of inverted-polarity terminology. Atmos Res. 2014;135–136:274–284. doi: 10.1016/j.atmosres.2012.10.009. [DOI] [Google Scholar]
- Bukovsky MS, Karoly DJ. Precipitation simulations using WRF as a nested regional climate model. J Appl Meteorol Climatol. 2009;48:2152–2159. doi: 10.1175/2009JAMC2186.1. [DOI] [Google Scholar]
- Bullock OR, Jr, Alapaty K, Herwehe JA, Mallard MS, Otte TL, Gilliam RC, Nolte CG. An observation-based investigation of nudging in WRF for downscaling surface climate information to 12-km grid spacing. J Appl Meteorol Climatol. 2014;53:20–33. doi: 10.1175/JAMC-D-13-030.1. [DOI] [Google Scholar]
- Environmental Modeling Center/National Centers for Environmental Prediction/National Weather Service/NOAA/U.S. Department of Commerce. NCEP North American Mesoscale (NAM) 12 km Analysis. Res. Data Arch. at the Natl. Cent. for Atmos. Res., Comput. and Inf. Syst. Lab; Boulder, Colo: 2015. [Available at http://rda.ucar.edu/datasets/ds609.0/.] [Google Scholar]
- Fierro AO, Mansell ER, Ziegler CL, MacGorman DR. Application of a lightning data assimilation technique in the WRF-ARW model at cloud-resolving scales for the tornado outbreak of 24 May 2011. Mon Weather Rev. 2012;140:2609–2627. [Google Scholar]
- Fierro AO, Clark A, Mansell ER, MacGorman DR, Dembek SR, Ziegler CL. Impact of storm-scale lightning data assimilation on WRF-ARW precipitation forecasts during the 2013 warm season over the contiguous United States. Mon Weather Rev. 2015;143:757–777. [Google Scholar]
- Giannaros TM, Kotroni V, Lagouvardos K. WRF-LTNGDA: A lightning data assimilation technique implemented in the WRF model for improving precipitation forecasts. Environ Modell Software. 2016;76:54–68. [Google Scholar]
- Gilliam RC, Pleim JE. Performance assessment of new land surface and planetary boundary layer physics in the WRF-ARW. J Appl Meteorol Climatol. 2010;49:760–774. doi: 10.1175/2009JAMC2126.1. [DOI] [Google Scholar]
- Herwehe JA, Alapaty K, Spero TL, Nolte CG. Increasing the credibility of regional climate simulations by introducing subgrid-scale cloud-radiation interactions. J Geophys Res Atmos. 2014;119:5317–5330. doi: 10.1002/2014JD021504. [DOI] [Google Scholar]
- Iacono MJ, Delamere JS, Mlawler EJ, Shephard MW, Clough SA, Collins WD. Radiative forcing by long-lived greenhouse gases: Calculations with the AER radiative transfer models. J Geophys Res. 2008;113:D13103. doi: 10.1029/2008JD009944. [DOI] [Google Scholar]
- Kain JS. The Kain-Fritsch convective parameterization: An update. J Appl Meteorol. 2004;43(1):170–181. doi: 10.1175/1520-0450(2004)043<0170:TKCPAU>2.0.CO;2. [DOI] [Google Scholar]
- Kain JS, Fritsch JM. A one-dimensional entraining/detraining plume model and its application in convective parameterization. J Atmos Sci. 1990;47(23):2784–2802. [Google Scholar]
- Lagouvardos K, Kotroni V, Defer E, Bousquet O. Study of a heavy precipitation event over southern France, in the frame of HYMEX project: Observational analysis and model results using assimilation of lightning. Atmos Res. 2013;134:45–55. [Google Scholar]
- Lin Y, Mitchell KE. 19th Conference on Hydrology. chap 1.2. Am. Meteorol. Soc; San Diego, Calif: 2005. The NCEP stage II/IV hourly precipitation analyses: Development and applications, Preprints. [Available online at http://ams.confex.com/ams/pdfpapers/83847.pdf.] [Google Scholar]
- Liu Y, et al. The operational mesogamma-scale analysis and forecast system of the U. S. Army Test and Evaluation Command. Part 1: Overview of the modeling system, the forecast products. J Appl Meteorol Climatol. 2008;47:1077–1092. [Google Scholar]
- Lo JCF, Yang ZL, Pielke RA., Sr Assessment of three dynamical climate downscaling methods using the Weather Research and Forecasting (WRF) model. J Geophys Res. 2008;113:D09112. doi: 10.1029/2007JD009216. [DOI] [Google Scholar]
- Mansell ER, Ziegler CL, MacGorman DR. A lightning data assimilation technique for mesoscale forecast models. Mon Weather Rev. 2007;135:1732–1748. doi: 10.1175/MWR3387.1. [DOI] [Google Scholar]
- Marchand MR, Fuelberg HE. Assimilation of lightning data using a nudging method involving low-level warming. Mon Weather Rev. 2015;142:4850–4871. doi: 10.1175/MWR-D-14-00076.1. [DOI] [Google Scholar]
- Morrison H, Thompson G, Tatarskii V. Impact of cloud microphysics on the development of trailing stratiform precipitation in a simulated squall line: Comparison of one- and two-moment schemes. Mon Weather Rev. 2009;137:991–1007. [Google Scholar]
- Orville RE. Development of the National Lightning Detection Network. Bull Am Meteorol Soc. 2008;89:180–190. doi: 10.1175/BAMS-89-2-180. [DOI] [Google Scholar]
- Otte TL. The impact of nudging in the meteorological model for retrospective air quality simulations. Part I: Evaluation against national observation networks. J Appl Meteorol Climatol. 2008;47:1853–1867. [Google Scholar]
- Otte TL, Nolte CG, Otte MJ, Bowden JH. Does nudging squelch the extremes in regional climate modeling? J Clim. 2012;25:7046–7066. [Google Scholar]
- Pleim JE. A simple, efficient solution of flux-profile relationships in the atmospheric surface layer. J Appl Meteorol Climatol. 2006;45:341–347. [Google Scholar]
- Pleim JE. A combined local and nonlocal closure model for the atmospheric boundary layer. Part I: Model description and testing. J Appl Meteorol Climatol. 2007;46:1383–1395. [Google Scholar]
- Pleim JE, Xiu A. Development of a land-surface model. Part II: Data assimilation. J Appl Meteorol. 2003;42:1811–1822. [Google Scholar]
- Preston AD, Fuelberg HE. Improving lightning cessation guidance using polarimetric radar data. Weather Forecasting. 2015;30:308–328. doi: 10.1175/WAF-D-14-00031.1. [DOI] [Google Scholar]
- Randall D, Khairoutdinov M, Arakawa A, Grabowski W. Breaking the cloud parameterization deadlock. Bull Am Meteorol Soc. 2003;84:1547–1564. doi: 10.1175/BAMS-84-11-1547. [DOI] [Google Scholar]
- Rogers RF, Fritsch JM, Lambert WC. A simple technique for using radar data in the dynamic initialization of a mesoscale model. Mon Weather Rev. 2000;128:2560–2574. [Google Scholar]
- Skamarock WC, Klemp JB. A time-split nonhydrostatic atmospheric model for weather research and forecasting applications. J Comput Phys. 2008;227(7):3465–3485. doi: 10.1016/j.jcp.2007.01.037. [DOI] [Google Scholar]
- Skamarock WC, Klemp JB, Duda MG, Fowler LD, Park SH, Ringler TD. A multiscale nonhydrostatic atmospheric model using centroidal voronoi tessellations and C-grid staggering. Mon Weather Rev. 2012;140:3090–3105. doi: 10.1175/MWR-D-11-00215.1. [DOI] [Google Scholar]
- Stauffer DR, Seaman NL. Multiscale four-dimensional data assimilation. J Appl Meteorol. 1994;33:416–434. [Google Scholar]
- Stephens GL, L’Ecuyer T, Forbes R, Gettlemen A, Golaz JC, Bodas-Salcedo A, Suzuki K, Gabriel P, Haynes J. Dreary state of precipitation in global models. J Geophys Res. 2010;115:D24211. doi: 10.1029/2010JD014532. [DOI] [Google Scholar]
- Wilks DS. Statistical Methods in the Atmospheric Sciences. Academic Press; San Diego, Calif: 1995. p. 467. [Google Scholar]
- Xiu A, Pleim JE. Development of a land-surface model. Part I: Application in a mesoscale meteorological model. J Appl Meteorol. 2001;40:192–209. [Google Scholar]


