Abstract
Donnan theory and Goldman-Hodgkin-Katz equation (GHK eq.) state that the nonzero membrane potential is generated by the asymmetric ion distribution between two solutions separated by a semipermeable membrane and/or by the continuous ion transport across the semipermeable membrane. However, there have been a number of reports of the membrane potential generation behaviors in conflict with those theories. The authors of this paper performed the experimental and theoretical investigation of membrane potential and found that (1) Donnan theory is valid only when the macroscopic electroneutrality is sufficed and (2) Potential behavior across a certain type of membrane appears to be inexplicable on the concept of GHK eq. Consequently, the authors derived a conclusion that the existing theories have some limitations for predicting the membrane potential behavior and we need to find a theory to overcome those limitations. The authors suggest that the ion adsorption theory named Ling’s adsorption theory, which attributes the membrane potential generation to the mobile ion adsorption onto the adsorption sites, could overcome those problems.
Keywords: Membrane potential, Donnan theory, Goldman-Hodgkin-Katz equation, Ling’s adsorption theory
Introduction
The present membrane theory states that the generation of membrane potential of living cell is a consequence of asymmetric ion distribution between cell inside and outside [1, 2]. Such an asymmetric ion distribution is achieved by the transmembrane ion transport induced by the ion channels and pumps embedded in the plasma membrane. Donnan theory and Goldman-Hodgkin-Katz equation (GHK eq.) have been employed for quantitatively predicting the membrane potential behavior for the past decades and those theories have been even employed for the analysis of properties of wet electrolytic nonliving materials [1–11]. However, there have been a number of reports in conflict with those theories [1, 2, 12, 13]. Though Donnan theory attributes the generation of nonzero membrane potential to the membrane impermeability to a particular species of ion, some membrane potential generation behaviors are not explicable by it [1, 2]. Since GHK eq. attributes the generation of membrane potential to the transmembrane ion transport [1, 2], the nonzero membrane potential generation is logically unthinkable without ion transport. Nevertheless, the nonzero membrane potential is actually observed across an impermeable membrane [1, 2, 12–14]. It compels us raise a question “Is membrane permeability to ions needed for the induction of nonzero membrane potential?” Dr. Gilbert Ling allegedly disproved both Donnan theory and GHK eq., and he has advocated his own alternative theory, Ling’s adsorption theory, as a membrane potential generation mechanism [1, 2, 15–17]. He attributes the membrane potential generation to the mobile ion adsorption onto the adsorption sites. Although his theory has been regarded as a heresy in the physiology, his theory is quite well acceptable from the standpoint of physical chemistry in our opinion [14, 18]. This paper deals with (1) The validity of Donnan theory [Sections 2.1 and 3.1] and (2) The validity of GHK eq. [Sections 2.2 and 3.2], and we further discuss the validity of the Ling’s adsorption theory.
Experimental
The validity of Donnan theory
As the 1st topic, we performed Donnan potential measurement of hydrogel swollen in KCl aqueous solution and scrutinized the validity of Donnan theory.
Gel preparation
2 mm-thick plate shape anionic hydrogel containing COOH groups was synthesized basically by following the procedure described in the ref. [19].
Gel potential measurement
Anionic hydrogels were equilibrated in 0.0001 M, 0.001 M and 0.01 M KCl solutions. Those hydrogels in equilibrium state are referred to as G-0.0001, G-0.001 and G-0.01, respectively. Potential of G-0.0001 was measured basically by following the procedure described in the ref. [19]. Two potentials, the potential at the surface of G-0.0001 in reference to the bathing solution and the potential at the deep inside of G-0.0001 in reference to the bathing solution, were measured. Those two potentials are hereafter called surface potential and center potential, respectively. We also measured the thickness of G-0.0001, d [mm] in order to obtain the swelling ratio, S, by S = (d [mm]/2 [mm])3, where 2 [mm] is the hydrogel thickness right after the completion of gel synthesis. The same measurements were carried out for G-0.001 and G-0.01.
The validity of Goldman-Hodgkin-Katz equation
As the 2nd topic, the validity of GHK eq. is scrutinized.
Potential and ion concentration measurement
Two acrylic containers were assembled so that a membrane was sandwiched between them as illustrated in Fig. 1. 0.1 M and 0.01 M KCl solutions were supplied into the left and right containers, respectively. Immediately, we started making measurement of the potential in the left solution in reference to the right solution as a function of time using Ag/AgCl electrodes. Simultaneously, the concentration of K+ and Cl− in the individual solutions were measured using K+ and Cl− ion selective electrodes (TOA DKK Co.. (Tokyo).
Fig. 1.
Two acrylic containers fabricated are assembled with a membrane between them
Results and discussion
The validity of Donnan theory
1st topic described in the Section 2.1 is discussed. Prior to show our work, primary notations used in the Section 3.1 are summarized in Table 1.
Table 1.
Notations (available only in the Section 3.1)
| NA | Avogadro number |
| e | elementary charge |
| k | Boltzmann constant |
| T | absolute temperature = 293 K |
| KD, K’D | dissociation constant of COOK |
| [Caboxyl] | [Carboxyl] ≡ [COOK] + [COO−] |
| ρ s, ρ g | charge density in the solution phase, in the hydrogel phase |
| ϕ s, ϕ g | potential in the solution phase, in the hydrogel phase |
| 𝜖 0, 𝜖 | vacuum permittivity, relative permittivity of water |
| α | quantity of acrylic acid used for the hydrogel synthesis |
| Mw | molecular weight of acrylic acid |
| S | swelling ratio of hydrogel |
| v | hydrogel volume right after the completion of hydrogel synthesis |
| B | B ≡ e/kT |
| C0 | [K+] and [Cl−] at the bulk phase in the KCl solution |
Experimentally measured hydrogel potential
The potential within hydrogel is called Donnan potential [17, 20, 21]. Donnan theory was proposed by Donnan in 1911. He considered the system consisting of two solutions separated by a semipermeable membrane. Donnan stated that the nonzero potential generated across the semipermeable membrane is because of the asymmetric ion distribution between the two solutions due to the impermeability of the semipermeable membrane to the particular ionic species. However, Ling emphasized that the Donnan theory was wrong due to its violation of the law of macroscopic electroneutrality [1, 2, 15–17]. We show the measured hydrogel potentials (Donnan potential) in Table 2, which is described in the Section 2.1.2. We will discuss those Donnan potential behavior.
Table 2.
Hydrogel potentiala
| Gel | [KCl]b | Sc | /Vd | /Vd | /Ve | /Ve |
|---|---|---|---|---|---|---|
| G-0.0001 | 0.0001 | 20.80 | −0.062 | −0.076 | −0.059 | −0.076 |
| G-0.001 | 0.001 | 10.29 | −0.025 | −0.039 | −0.017 | −0.028 |
| G-0.01 | 0.01 | 8.00 | −0.016 | −0.018 | −0.001 | −0.001 |
a The underlined data is used for the computation of KD in the Section 3.1.2
b KCl concentration of bathing solution of hydrogel
c swelling ratio of gel
d experimental surface potential () and center potential ()
e computational surface potential () and center potential () obtained using the Donnan theory
Analysis of hydrogel electrical properties based on the Donnan theory
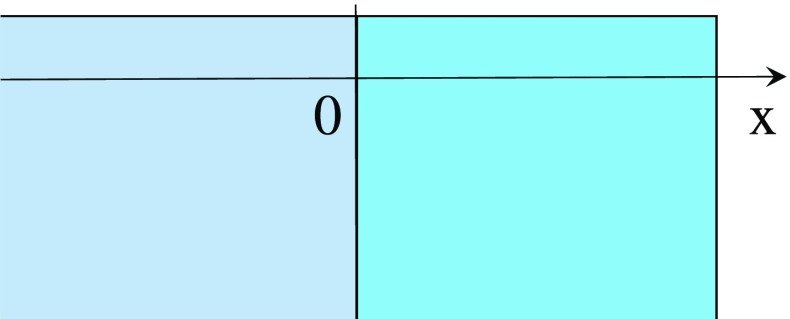
Potential and ion concentration profiles of KCl solution −hydrogel systems are theoretically derived here. The coordinate system is set to the KCl solution −hydrogel system as illustrated in Fig. 2.
Fig. 2.
Coordinate system x < 0: solution phase, x > 0: hydrogel phase
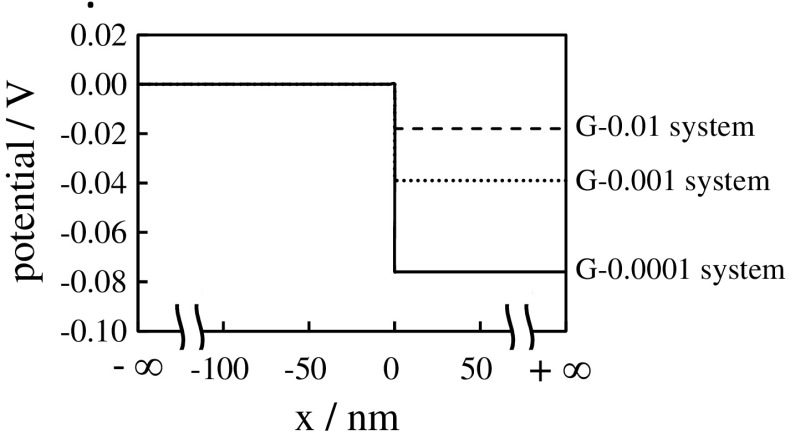
Let’s focus on the KCl solution −G-0.0001 system. Since the region x > 0 in Fig. 2 is G-0.0001, the whole system of G-0.0001 and the 0.0001M KCl solution is hereafter called G-0.0001 system. 0.001M KCl solution −G-0.001 and 0.01M KCl solution −G-0.01 are also hereafter callled G-0.001 system and G-0.01 system, respectively. First, we derive the dissociation constant, KD, of COOK of G-0.0001. Equilibrium equation is COOK ⇌ COO− + K+. K was obtained by the procedure in the Appendix A. Bear in mind that KD = 0.24 molm−3 was obtained by the analysis of G-0.0001 not G-0.001 or G-0.01. ASSUMPTION “Donnan potential and ion concentration are constant everywhere within the individual phases - hydrogel and bathing solution phases -” is often employed, when the Donnan theory is used for the analysis of hydrogel properties [22–25]. As long as the Donnan theory is used under the ASSUMPTION, the potential in the KCl solution bathing G-0.0001, G-0.001 and G-0.01 are 0 V everywhere (The potential in the KCl solution is defined 0 V in the Section 2.1.2), and the potential of G-0.0001, G-0.001 and G-0.01 should be −0.076 V, −0.039 V and −0.018 V, respectively, everywhere, according to the experimental center potential in Table 2. Thus, the potential profile of Fig. 3 was obtained.
Fig. 3.
Potential vs. x, where the potential of G-0.0001 system, G-0.001 system and G-0.01 system at x < 0 are all defined 0 V
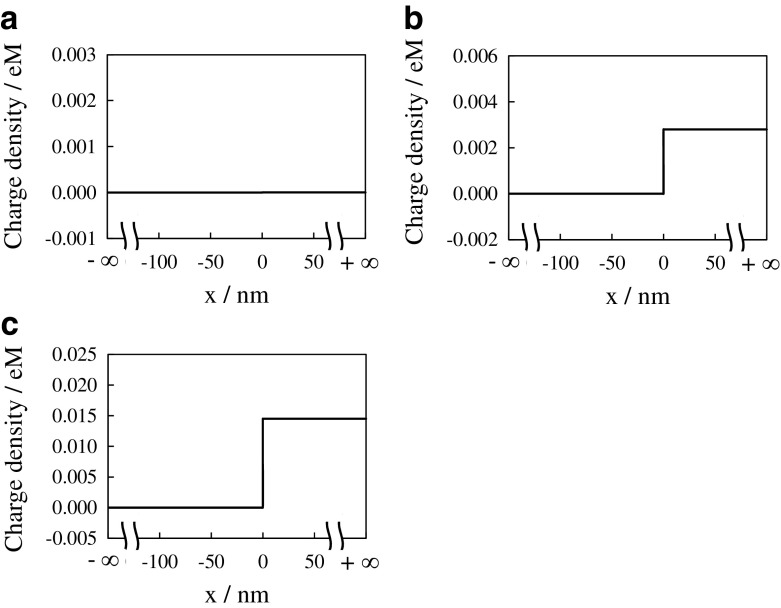
Next, the ion distribution is focused on. [K+] and [Cl−] at the bulk phase in the KCl solution bathing G-0.0001 (x < 0) is 0.0001 M. According to the ASSUMPTION, [K+] and [Cl−] of G-0.0001 at any x < 0 should be 0.0001 M. Hence, the electroneutrality at x < 0 represented by (1) establishes under the condition that [H+] and [OH−] are negligibly low. Concerning the ion distribution in the bulk phase of G-0.0001, molm−3, molm−3 and [COO−] = 2.015 molm−3 are obtained by the procedure in Appendix A. These quantities represent the ion concentration everywhere in the hydrogel phase x > 0. Plugging those quantities into (2) under condition that [H+] and [OH−] are negligibly low, the charge density vs. x of G-0.0001 system is obtained. The electroneutrality of G-0.0001 system establishes everywhere as shown in Fig. 4a. It is quite natural outcome, since we employed the electroneutrality condition, which is same as “(2) = 0”, for obtaining [COO−] = 2.015 molm−3
| 1 |
| 2 |
Fig. 4.
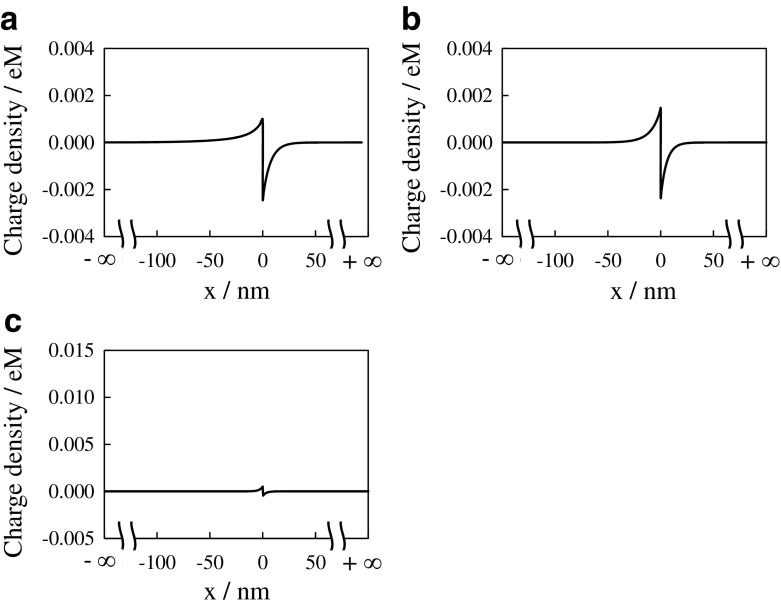
Charge density vs. x of a G-0.0001 system, b G-0.001 system and c G-0.01 system, where the vertical axis unit “eM” represents “1.6 × 10⁻¹⁹ Coulomb mol/liter”
Concerning G-0.001 system, [K+] = [Cl−] = 0.001 M in the KCl solution phase. Hence, the charge neutrality represented by (1) establishes anywhere at x < 0 for G-0.001 system. [K+] and [Cl−] in G-0.001 were obtained in the same manner as obtaining [K+] and [Cl−] in G-0.0001, i.e. [K+] = 4.68 molm−3 and [Cl−] = 0.21 molm−3 anywhere at x > 0. [COO−] of G-0.001 system was obtained by the different procedure from the procedure employed for obtaining [COO−] of G-0.0001. Although we experimentally found that the KD of G-0.0001, G-0.001 and G-0.01 were not exactly same one another, KD should be same irrespective of the state the hydrogel is in from the view of ordinary physical chemistry. Therefore KD = 0.24 molm−3 obtained by the analysis of G-0.0001 system is used for the analysis of G-0.001 properties. [COO−] represented by (3) is obtained by rearranging the right expression of (28) in the Appendix A. By following the same procedure obtaining [Carboxyl] in G-0.0001 described in the Appendix A, [Carboxyl] in G-0.001 is obtained by (1.44 ÷ 72.06) ÷ (0.05 × 10.29) = 0.039M = 39 molm−3. Plugging [K+] = 4.68 molm−3, KD = 0.24 molm−3 and [Carboxyl] = 39 molm−3 into (3) results in [COO−] = 1.9 mol m−3 = 0.0019 M. Plugging those quantities and [Cl−] = 0.21 molm−3 into (2), the charge density at x > 0 is given by e([K+] − [COO−] − [Cl−]) = 0.00257 eM≠0, where the unit “eM” represents “1.6 × 10⁻¹⁹ Coulomb mol/liter”.
| 3 |
Charge density of G-0.001 system was obtained as shown in Fig. 4b. As to G-0.01 system, the same data analysis for obtaining Fig. 4b was carried out and the data obtained is shown in Fig. 4c. Figure 4b and c suggest that the macroscopic electroneutrality is violated in the hydrogel phase. Donnan theory does not suffice the macroscopic electroneutrality as Ling states. The violation of macroscopic electroneutrality is caused by the ASSUMPTION described in the Section 3.1.2. It is wrong assumption.
Now, the procedure for obtaining the charge density profile shown in Fig. 4 is summarized as below: (I-i)–(I-v) and (II-i)–(II-v). Since the charge density profiles in the KCl solution phase of G-0.0001 system, G-0.001 system and G-0.01 system are zero obviously, the charge density profiles of hydrogel phase of those three systems are described.
-
(I-i)
[K+] and [Cl−] within G-0.0001 were calculated by (30).
-
(I-ii)
[Carboxyl] in G-0.0001 was obtained by [Carboxyl] = (1.44/72.06) ÷ (0.05 × swelling ratio of G-0.0001) as described in the Appendix A.
-
(I-iii)
Plugging [K+] and [Cl−] into (29) (electroneutrality condition), [COO−] of G-0.0001 was calculated.
-
(I-iv)
[K+], [COO−] and [Carboxyl] were plugged into (28), resulting in KD = 0.24 molm−3.
-
(I-v)
Needless to say, the charge density within G-0.0001 is zero everywhere, since the electroneutrality condition was imposed as described in (I-iii). Thus, Fig. 4a was naturally obtained.
-
(II-i)
[K+] and [Cl−] within the G-0.001 were calculated by the procedure same as (I-i)
-
(II-ii)
[Carboxyl] of G-0.001 was obtained by the procedure same as (I-ii)
-
(II-iii)
[COO−] of G-0.001 was obtained by plugging [K+] and [Carboxyl] within G-0.001 and KD of G-0.0001 (0.24 molm−3) into (3). So the procedure of obtaining [COO−] is totally different from the procedure (I-iii).
-
(II-iv)
The charge density of G-0.001 was obtained by calculating (2). Consequently, Fig. 4b was obtained. Concerning G-0.01 system, Fig. 4c was obtained by the same procedure of obtaining Fig. 4b of G-0.001 system.
One may argue that the use of KD obtained by the use of data of G-0.001 system or G-0.01 system instead of KD of G-0.0001 system could provide us with the charge density profiles sufficing the electroneutrality of all G-0.0001, G-0.001 and G-0.01. However, our computational results (not shown in this paper) suggested that no K’Ds sufficed the electroneutrality of all three systems. The Donnan theory has the limitation. However, it is possible to use the Donnan theory in the right manner [3–5, 9, 10]. We will show it next.
Donnan theory under the law of macroscopic electroneutrality
Poisson-Boltzmann equation (P.-B. eq.) is employed along with the Donnan theory for predicting potential behavior of G-0.0001 system. First, the coordinate system was set to G-0.0001 system as illustrated in Fig. 2.
Potential in KCl solution (x < 0)
According to the Donnan theory, [K+] and [Cl−] are given by (4), where B ≡ e/kT. C0 represents [K+] and [Cl−] at in “M” unit. C0 is experimentally measurable and can be represented by C0 M = C. P.-B. eq. is given by (5) under the condition that [H+] and [OH−] are negligibly low, where the definitions of ϕ s, ρ s, 𝜖 and 𝜖 0 are given in Table 1. We employ the condition in this analysis.
| 4 |
| 5 |
Potential in hydrogel (x > 0)
P.-B. eq. in the hydrogel phase is derived. First, we will obtain the dissociation constant of COOK, K’D. We employ K introduced in the Appendix A as K’D. [COOK] + [COO−] is given by (6), where the definitions of α, Mw, S and v are given in Table 1. Equation (7) is derived using (6). [K+] and [Cl−] in the hydrogel phase are given by replacing ϕ s of (4) with ϕ g, respectively. Using the resultant [K+] and (7), (8) is derived.
| 6 |
| 7 |
| 8 |
P.-B. eq. is given by (9) under the condition that [H+] and [OH−] are negligibly low. The condition of “macroscopic electroneutrality” is imposed on the system, resulting in (10). Applying the (5) and (9) together with the conditions, and , to (10) results in (11).
| 9 |
| 10 |
| 11 |
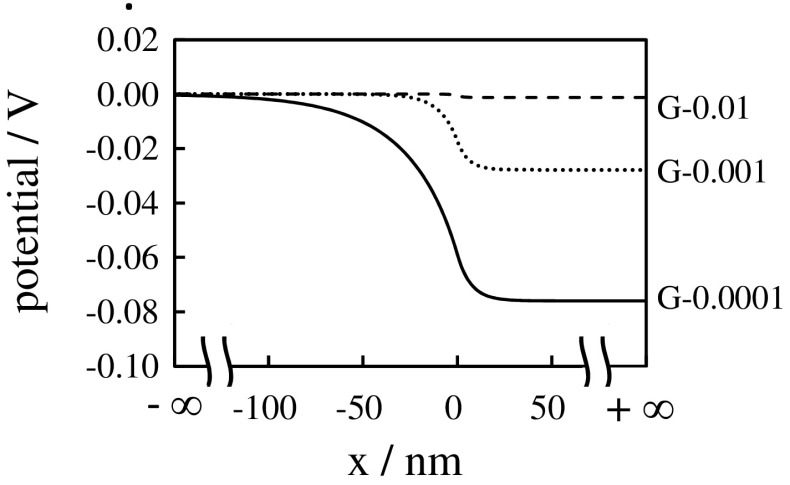
Potential vs. x of G-0.0001 system was obtained by numerically solving (5) and (9) under the condition (11). By the same procedure, Potential vs. x of G-0.001 system and of G-0.01 system were numerically computed. The computational result is shown in Fig. 5. Computational surface potential and center potential are basically in good agreement with experimental surface potential and center potential, respectively, as shown in Table 2.
Fig. 5.
Potential vs. x, where the potential of G-0.0001 system, G-0.001 system and G-0.01 system at is assumed to be 0 V
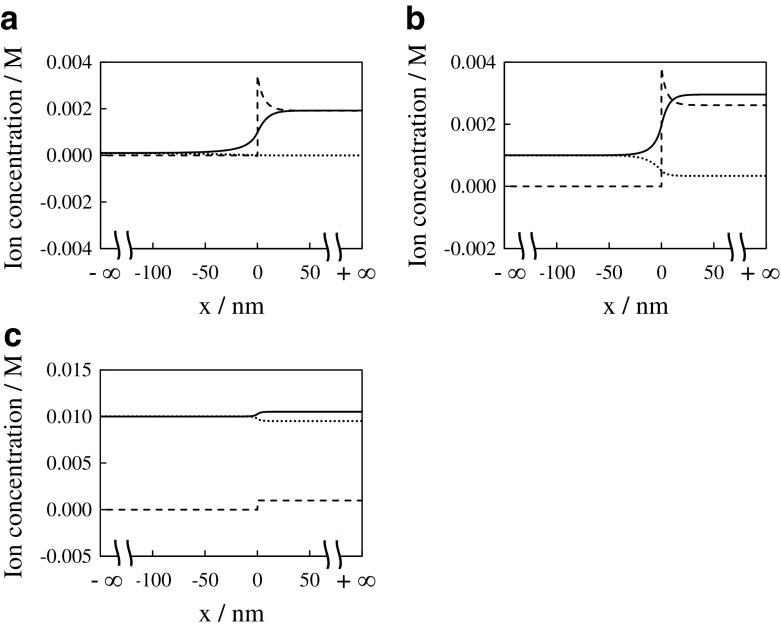
Since we computed ϕ s and ϕ g, we could calculate [K+], [Cl−] and [COO−] as a function of x as shown in Fig. 6. Thus, charge density vs. x of G-0.0001 system, G-0.001 system and G-0.01 system were obtained by plugging [K+], [Cl−] and [COO−] into (2) as shown in Fig. 7. Figure 7 indicates that the violation of electroneutrality takes place but only at the phase interface within quite narrow region. Hence, it is the allowable violation of the electroneutrality, i.e. the macroscopic electroneutrality is still established [26].
Fig. 6.
Ion concentration vs. x of a G-0.0001 system, b G-0.001 system and c G-0.01 system, where solid line, dotted line and dashed line represent the concentration of K+, Cl− and COO−, respectively
Fig. 7.
Charge density vs. x of a G-0.0001 system, b G-0.001 system and c G-0.01 system, where the vertical axis unit “eM” represents “ 1.6 × 10⁻¹⁹ Coulomb mol/liter”
Figure 6 and Table 2 suggest that the variation of hydrogel swelling ratio and its potential is accompanied by the variation of [K+], [Cl−] and [-COO−]. K+ must adsorb onto -COO− so as to suffice the macroscopic electroneutrality in response to the bathing solution ion concentration. It is interpreted that the adsorption of K+onto the -COO− regulates the ion distribution, hydrogel swelling ratio and the potential. The primary conclusions are given below:
-
(i)
The potentials computed using the Donnan theory under the law of macroscopic electroneutrality are in the good agreement with the experimental potentials.
-
(ii)
Potential within hydrogel, ion distribution and swelling ratio of hydrogel are regulated by the degree of K+ adsorption onto -COO−.
Now, Ling’s adsorption theory suggests:
-
(I)
The law of macroscopic electroneutrality should be established.
-
(II)
Potential behavior generated between two distinct aqueous phases is regulated by the adsorption of mobile ions onto the adsorption sites.
The conclusions (i) and (ii) are in harmony with the suggestions (I) and (II) by Ling. Thus, Donnan theory under the law of macroscopic electroneutrality is basically equivalent to Ling’s adsorption theory. We further derived the conclusion that the interfacial potential is different from the bulk phase potential. Therefore it is necessary to consider both potential, ϕ, and ion concentration, C, as a function of position, x. ASSUMPTION introduced in the Section 3.1.2 is the inappropriate condition for using the Donnan theory.
Implication of Ling’s adsorption theory
Ling’s adsorption theory states that the generation of cell membrane potential is attributed to the adsorption of mobile ions onto the adsorption sites [1, 2]. The validation of Ling’s adsorption theory implicates that the membrane potential is not caused by the selective ion passage through the semipermeable membrane as widely believed but by the mobile ion adsorption onto the adsorption sites. Hence, the long accepted mechanism of membrane potential generation should be at least amended.
The validity of Goldman-Hodgkin-Katz equation
2nd topic described in the Section 2.2 is discussed.
Problem in the GHK eq
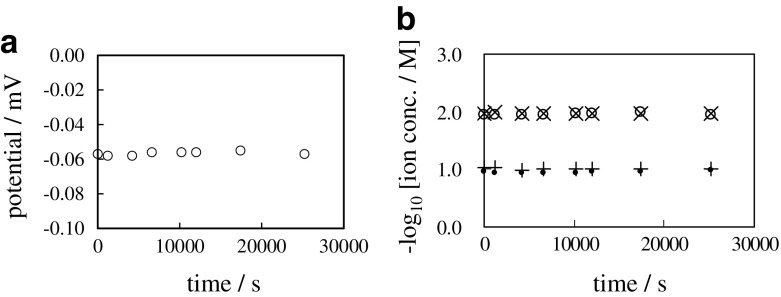
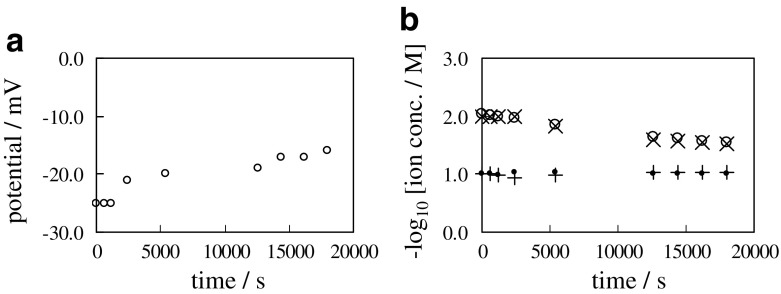
A problematic issue about the GHK eq. that arose in our experimental work described in the Section 2.2 is detailed in this section. We carried out the following experiment: 0.1 M and 0.01 M KCl aqueous solutions were separated with an ion exchange membrane called Selemion CMV (Asahi Glass Co., Ltd., Tokyo). This system is hereafter called “0.1/CMV/0.01”. Since Selemion CMV contains immobile -SO3H groups, it becomes negatively charged in the dissociated state. The negatively charged Selemion CMV is permeable to mobile cation but little permeable to mobile anion due to the electrostatic force exerted between the mobile ion charge and the immobile negative charge of Selemion CMV. The 0.1 M KCl solution is in the left container of 0.1/CMV/0.01. Therefore, 0.1 M KCl solution was in contact with the left surface of Selemion CMV. The 0.01 M KCl solution was in the right container, therefore, 0.01 M KCl solution was in contact with the right surface of Selemion CMV. Figure 8a shows time course of membrane potential - potential of left solution (0.1 M KCl) in reference to the right solution (0.01 M KCl) -. It was constant from t = 0 s through t = 25000 s. Figure 8b shows the time course of negative common logarithm of concentration of K+ and Cl− in the left and right containers, where the K+ and Cl− concentration in “M” unit in the left and right containers are represented by [K+]L, [Cl−]L, [K+]R and [Cl−]R, respectively. All the ion concentrations were constant from t = 0 s through t = 25000 s.
Fig. 8.
a Time course of membrane potential between 0.1 M KCl and 0.01 M KCl separated with a sheet of Selemion CMV b Time course of , , and respectively represented by a symbol “ ∙”, “ + ”, “ ∘” and “ ×”
Equation (12) is GHK eq. for “0.1/CMV/0.01”. ϕ represents the membrane potential. ATTENTION “Temperature employed in this section is 298 K, though the temperature employed in the Section 3.1 is 293 K, since the precise temperature control was difficult.” P and P represent the coefficient of membrane permeability of Selemion CMV to K+ and Cl−, respectively. Due to the higher permeability of Selemion CMV to K+ than to Cl−, P ≫ P is derived. Consequently, ϕ = −0.059 V was obtained theoretically as in (12), and this result is in good agreement with the experimental result shown in Fig. 8a.
| 12 |
Ion diffuses through the membrane from the high ion concentration phase to the low ion concentration phase. Therefore, [K+]L is expected to decrease, and [K+]R is expected to increase with time, while [Cl−]L and [Cl−]R are expected to remain constant with time. But such behaviors of [K+]L, [K+]R, [Cl−]L and [Cl−]R would lead to the violation of macroscopic electroneutrality in both left and right containers. On the other hand, Fig. 8b suggests that [K+]L, [K+]R, [Cl−]L and [Cl−]R were constant from the beginning to the end, which is interpreted as all the ions are impermeable to the Selemion CMV. According to the GHK eq., the membrane potential generation takes the selective ion permeation through the membrane, but the macroscopic electroneutrality should not be violated. This is the dilemma we have to settle.
A solution within the GHK eq. concept to the problem
The following suggestions might provide an answer within the concept of GHK eq. to the dilemma raised in the Section 3.2.1. K+ in the left solution (0.1 M KCl solution) tends to diffuse through the membrane toward the right solution (0.01 M KCl solution) due to the law of diffusion. But the K+’s are pulled back to the left KCl solution from the right KCl solution so as not to violate the electroneutrality. i.e. K+ passes through the membrane back and forth. Therefore nonzero potential shown in Fig. 8a was generated without the change of individual ion concentration with time, which is in line with the prediction by the GHK eq. However, does such a complex phenomenon really take place? It is discussed in the next section.
Membrane potential across a single membrane
We made another measurements of the membrane potential and ion concentration behaviors using several kinds of membrane separating two solutions of 0.1 M KCl and 0.01 M KCl as a function of time. Experimental procedure is same as the procedure employed for obtaining Fig. 8.
Membrane potential across the dialysis membrane
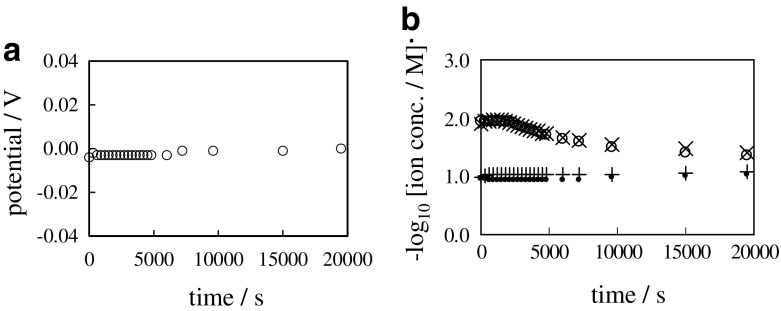
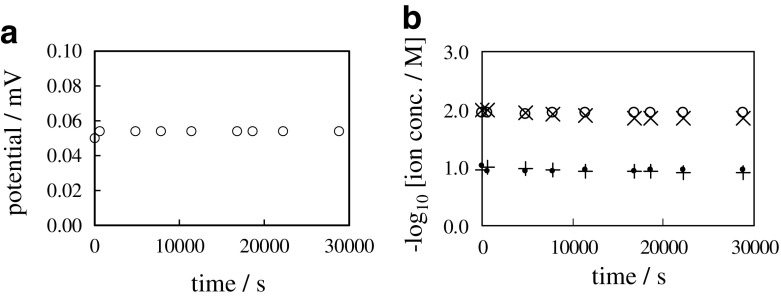
Figure 9 shows the time course of membrane potential and ion concentration when the dialysis membrane was used. Hereafter this system is called “0.1/DM/0.01”. K+ and Cl− can freely diffuse through the dialysis membrane so as to fully suffice the electroneutrality everywhere. Therefore, the same quantity of K+ and Cl− must flow from the left container to the right container. GHK eq. for 0.1/DM/0.01 is given by (13). Since K+ is always accompanied by Cl−, resulting in , where P and P represent the coefficient of membrane permeability of dialysis membrane to K+ and Cl−, respectively, and and hold in this system, ϕ of (13) is 0 V. Figure 9a shows that the membrane potential was constant 0 V from t = 0 s through t = 20000 s. Figure 9b shows that [K+]L and [Cl+]L decrease with time, and it is in line with the law of diffusion. This experimental result agrees with the prediction by the GHK eq.
| 13 |
Fig. 9.
a Time course of membrane potential between 0.1 M KCl and 0.01 M KCl separated with a sheet of dialysis membrane b Time course of , , and respectively represented by symbol “ ∙”, “ + ”, “ ∘” and “ ×”
Membrane potential across the Selemion CMV
Time dependence of the potential and the ion concentration of 0.1/CMV/0.01 was discussed already in the previous Sections 3.2.1 and 3.2.2, and it was concluded that they are all explicable by the GHK eq.
Membrane potential across the Selemion AMV
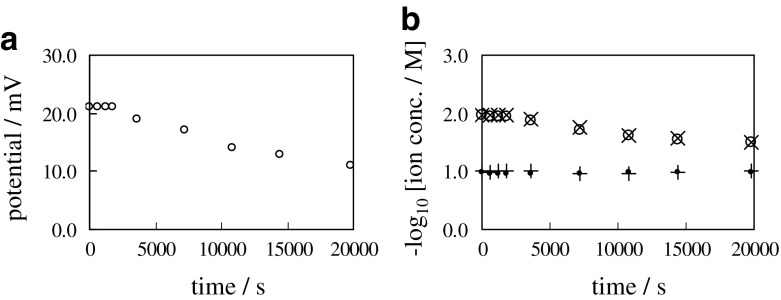
Selemion AMV is an ion exchange membrane (Asahi Glass Co., Ltd., Tokyo) and it becomes positively charged in the dissociated state. The same measurements applied to 0.1/CMV/0.01 were performed using Selemion AMV in place of Selemion CMV, where the system is hereafter called “0.1/AMV/0.01”. Just opposite phenomenon to the above described (Fig. 8) was observed as shown in Fig. 10. Equation (14) is GHK eq. for 0.1/AMV/0.01, where P and P represent the permeability of Selemion AMV to K+ and Cl−, respectively. Because of by far higher permeability of membrane of Selemion AMV to Cl− than to K+, P ≫ P is derived. Similarly to 0.1/CMV/0.01, if Cl−’s tend to diffuse from the left container to the right container through the membrane and simultaneously Cl’s are pulled back to the left KCl solution from the right KCl solution so as not to violate the electroneutrality, the potential generation behavior of 0.1/AMV/0.01 is explicable by the GHK eq.
| 14 |
Fig. 10.
a Time course of membrane potential between 0.1 M KCl and 0.01 M KCl separated with a sheet of Selemion AMV b Time course of , , [K+]R and respectively represented by symbol “ ∙”, “ + ”, “ ∘” and “ ×”
All the observation for 0.1/DM/0.01, 0.1/CMV/0.01 and 0.1/AMV/0.01 are explicable within the range of GHK eq. We performed another experiments using a combinatorial membrane in the next section.
Membrane potential across a combinatorial membrane
Membrane potential across the dialysis membrane & Selemion CMV
The containers have four slits as illustrated in Fig. 1. For the next experiment, two slits located inside were covered with dialysis membrane and the rest of slits were covered with Selemion CMV. Hereafter this combinatorial membrane is called DC-membrane, and the whole experimental system is hereafter called “0.1/DC/0.01”. Nonzero membrane potential was generated as shown in Fig. 11a. Figure 11b suggests that [K+]R and [Cl−]R in the right container increased with time. It suggests that K+ and Cl− permeate through the DC-membrane from the left container to the right container. No backward ion flow could be induced. Figure 11b also suggests that and establish at any moment. It is interpreted as the macroscopic electroneutrality establishes in the individual containers at any moment. Membrane potential across the DC-membrane is represented by (15). Since P ≫ holds as described in the Section 3.2.1, (15) is approximated by (16). Since the macroscopic electroneutrality holds in the individual containers at any moment, has to be established. Since Fig. 11b suggests that and , the right term of (16) results in 0 V. However, Fig. 11a clearly suggests the generation of nonzero potential. Therefore, GHK eq. cannot survive.
| 15 |
| 16 |
Fig. 11.
a Time course of membrane potential between 0.1 M KCl and 0.01 M KCl separated with a sheet of DC-membrane b Time course of , , and respectively represented by a symbol “ ∙”, “ + ”, “ ∘” and “ ×”
Membrane potential across the dialysis membrane & Selemion AMV
In place of DC-membrane, a combinatorial membrane consisting of dialysis membrane and Selemion AMV was used and the same measurement as 0.1/DC/0.01 was carried out. The combinatorial membrane used is hereafter called DA-membrane. The whole experimental system is hereafter called “0.1/DA/0.01”. Figure 12 shows the experimental result. Similarly to the 0.1/DC/0.01, 0.1/DA/0.01 should have generated zero potential, as long as the GHK eq. is valid. However, the experimentally observed potential was nonzero.
Fig. 12.
a Time course of membrane potential between 0.1 M KCl and 0.01 M KCl separated with a sheet of DA-membrane b Time course of , , and respectively represented by a symbol “ ∙”, “ + ”, “ ∘” and “ ×”
Cause of membrane potential generation
GHK eq. does not predict the membrane potential behavior so completely. In this section, we attempt to apply the Ling’s adsorption theory to the experimental results so far shown [1, 2, 15–17].
Membrane potential across the Selemion CMV
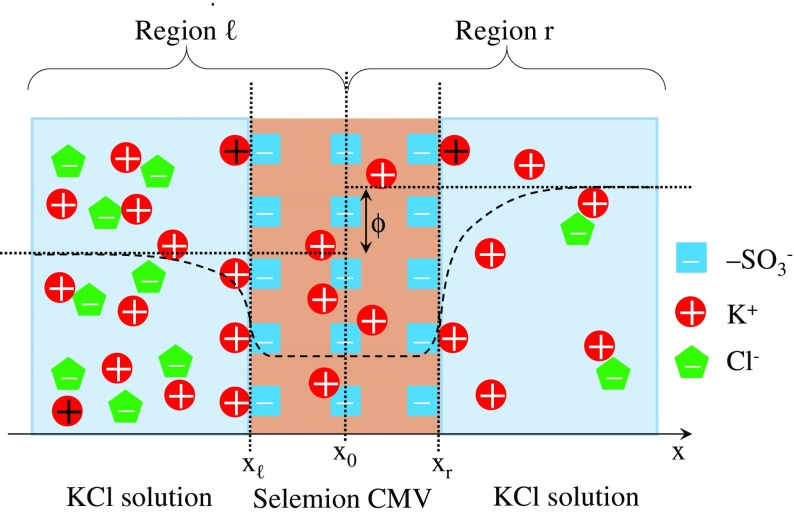
0.1/CMV/0.01 is taken up to be theoretically investigated empoying the Ling’s adsorption theory. Figure 13 shows the ion distribution in 0.1/CMV/0.01. Negative charge of -SO located inside Selemion CMV is completely neutralized by the nearby K+. Negative charge of -SO at the interface between 0.1 M KCl solution and Selemion CMV (hereafter called left interface) is largely neutralized by the adsorption of abundant K+ onto -SO, while the negative charge of -SO at the interface between 0.01 M KCl solution and Selemion CMV (hereafter called right interface) is slightly neutralized by the less abundant K+. Thus the right interface potential in reference to the bulk phase of 0.01 M KCl solution must be lower than the left interface potential in reference to the bulk phase of 0.1 M KCl solution. Hence, it is speculated that the potential behaves as indicated by the dashed line in Fig. 13. The potential to be experimentally measured should be given by ϕ shown in Fig. 13. This is the essence of Ling’s adsorption theory.
Fig. 13.
Experimental system of 0.1/CMV/0.01 with a coordinate system
Membrane potential across the Selemion AMV
Membrane potential for 0.1/AMV/0.01 is explicable by the same idea for 0.1/CMV/0.01 employing the Ling’s adsorption theory, since the difference between the Selemion AMV and Selemion CMV merely lies in the sign of immobile charge they bear.
Membrane potential across the dialysis membrane
Membrane potential for 0.1/DM/0.01 is explicable by the Ling’s adsorption theory as well. Since the dialysis membrane does not have adsorption sites for neither K+ or Cl−, making the entire system electrically neutral, the membrane potential should be zero, and it was actually zero as in Fig. 9.
The membrane potential across the dialysis membrane, Selemion CMV and Seelmion AMV appear to be well explained by the Ling’s adsorption theory, though we have not shown the quantitative verification. Next, we will quantitatively evaluate the validity of Ling’s adsorption theory.
Membrane potential across the combinatorial membrane
The membrane potential behavior for 0.1/DC/0.01 is discussed first. Selemion CMV portions of DC-membrane has adsorption sites for K+. Therefore, ion distribution similar to Fig. 13 must take place around at the Selemion CMV of DC-membrane. Hence, the nonzero membrane potential can be generated according to the Ling’s adsorption theory, though the dialysis membrane portion of DC-membrane bears no charge. In the similar manner, the membrane potential of 0.1/DA/0.01 is explicable by the Ling’s adsorption theory, too.
Formulation of Ling’s adsorption theory
We will formulate the membrane potential using the Ling’s adsorption theory. 0.1/CMV/ 0.01 is taken up and a coordinate system is set to it as in Fig. 13. Primary notations used in the Section 3.2.6 are summarized in Table 3.
Table 3.
Notations (available only in the Section 3.2.6)
| e | elementary charge |
| k | Boltzmann constant |
| T | absolute temperature = 298 Ka |
| B | B ≡ e/kT |
| ρ ℓs, ρ ℓm | charge density in the left solution phase, in the left membrane phase |
| ρ rs, ρ rm | charge density in the right solution phase, in the right membrane phase |
| ϕ ℓs, ϕ ℓm | potential in the left solution phase, in the left membrane phase |
| ϕ rs, ϕ rm | potential in the right solution phase, in the right membrane phase |
| 𝜖 0, 𝜖 | vacuum permittivity, relative permittivity of water |
| KA | association constant of reaction -SO + K+ -SO3K |
| [Tot] | [Tot] ≡ [SO3K] + [SO] |
In the KCl solution phase in Region ℓ
The experimental system consists of Region ℓ and Region r as illustrated in Fig. 13. The derivative of potential with respect to x is zero at x =x0. Bulk phase ion concentrations are given by . The bulk phase potential is given by . Bulk phase E-field is given by . [K+] and [Cl−] at x in the 0.1 M KCl solution is given by (17). P.-B. eq. is given by (18).
| 17 |
| 18 |
In the Selemion CMV phase in Region ℓ
Since [K+] is by far greater than [H+], the equilibrium H is quantitatively negligible compared with K. Thus, we calculated KA of the left expression of (19). Using [Tot] ≡ [SO3K] + [SO], the right expression of (19) is derived. [Tot] is 2000 molm−3 (Formal data provided by Asahi Glass Co., Ltd., Tokyo). KA was determined by the procedure in Appendix B. P.-B. eq. is given by (20), where [K+] and [Cl−] are given by replacing ϕ ℓs of (17) with ϕ ℓm, and plugging the resultant [K+] into the right expression of (19) results in [SO].
| 19 |
| 20 |
xℓ represents the coordinate at the interface between the left KCl solution and Selemion CMV as illustrated in Fig. 13. There should exist the point x = x0 sufficing . is denoted as , where is an unknown quantity. The local violation of electroneutrality must take place only at x = xℓ and x = xr (the definition of xr is shown in Fig. 13), if it were to take place. The excess quantity of charge from the zero charge state should be compensated by its nearby charge with opposite sign [26]. Microscopically x = xℓ is distant away from x = xr. Therefore, the macroscopic electroneutrality must hold around at x = xℓ and at x = xr independently. Hence, (21) is derived around at x = xℓ. Applying (18) and (20) under the boundary conditions, and to (21), (22) is obtained.
| 21 |
| 22 |
In the KCl solution phase in Region r
Bulk phase concentration of K+ and Cl− in 0.01 M KCl solution are given by . The bulk phase potential is redefined and the bulk phase E-field is given by . P.-B. eq. given by (24) is derived in the same manner as obtaining (18), where [K+] and [Cl−] are given by (23).
| 23 |
| 24 |
In the Selemion CMV phase in Region r
P.-B. eq. given by (25) is derived in the same manner as obtaining (20), where [K+] and [Cl−] are given by replacing ϕ rs of (23) with ϕ rm, and plugging the resultant [K+] into the right expression of (19) results in [SO]. x = x0 is microscopically infinitely far away from x = xr, and . is denoted by , where is an unknown quantity. Since the macroscopic electroneutrality should hold around at x = xr, (26) is derived. Hence, (27) is obtained using boundary conditions, and , in the same manner as obtaining (22).
| 25 |
| 26 |
| 27 |
Numerically solving the equations of (18), (20), (24) and (25) under the conditions (22) and (27) must result in the potential profile like Fig. 14a, where horizontal dotted line represents the zero potential.
Fig. 14.
a Dashed lines represent the potential profile in Region ℓ under the boundary condition of and the potential profile in Region r under the boundary condition of b Potential profile expected under the boundary condition of
Potential obtained using Ling’s adsorption theory
The definition of is employed as the reference zero potential for whole system of 0.1/CMV/0.01 from now on. Therefore is imposed on the whole system. It eventually results in the potential profile in Fig. 14b. obtained by the recalculation under these conditions corresponds to Δϕ exp, and Δϕ exp corresponds to the experimentally measured potential across the Selemion CMV.
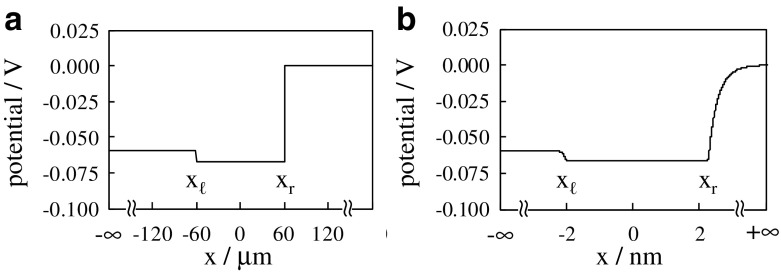
Now, we’d like to check if the potential profile illustrated in Fig. 14b is computationally realized using the theory (equivalent to the Ling’s adsorption theory) so far developed. Figure 15a represents the computational potential profile when x r − x ℓ = 120 × 10−6m (= Selemion CMV thickness). This potential profile was obtained under the following two experimentally obtained conditions: the potential at is 0 V and the potential across the membrane is −0.059 V (see Fig. 8a), where −0.059 V is same as the actual membrane potential of cell in the resting state. Figure 15a looks quite similar to the expected potential illustrated in Fig. 14b. Hence, the actual membrane potential could be explained by the Ling’s adsorption theory. One may argue that the emphasis of the validity of Ling’s adsorption theory as a mechanism of cell membrane potential generation is out of focus, since the plasma membrane thickness is extremely thinner than 120 × 10−6m. In order to defy this argument, we performed another computation.
Fig. 15.
Computational potential profile in case where the membrane thickness x r - x ℓ is a 120 × 10−6m and 4 × 10⁻⁹m
Another computation was performed assuming x r − x ℓ = 4 × 10⁻⁹m (= the plasma membrane thickness). Figure 15b represents the computational potential profile. It is quite similar to the potential profile in Fig. 15a. This result suggests that it is not unlikely that the potential across the plasma membrane is explicable by the Ling’s adsorption theory.
Throughout this paper, we have employed the Ling’s adsorption theory. But this kind of study is not what started recently. About 40 years ago, Chang employed the ion adsorption concept and successfully reproduced the actual membrane potential behavior [27]. Scientists have noticed the correlation between the ion adsorption phenomena and the electrical characteristics of cell, but only a handful of scientists have found the fundamentally important role of ion adsorption phenomenon for the physiological phenomena [28].
Conclusions
As Ling’s adsorption theory suggests, it is strongly speculated that the membrane potential generation is not a consequence of biological activity but merely by the ion adsorption-desorption phenomenon. One may say “Just because Ling’s adsorption theory can explain the membrane behavior, it does not necessarily follow that the existing theories are all wrong”. However, it is necessary at least to rule out the Ling’s adsorption theory as a membrane potential generation mechanism in order to fully validate the existing theories.
Acknowledgments
The authors would like to express our gratitude to The MIKIYA Science And Technology Foundation for the financial support for conducting this work.
Appendix A
The left expression of (28) is derived by the equilibrium equation, COOK ⇌ COO− + K+, where KD is the dissociation constant. The left expression of (28) is transformed into the right expression of (28) using [Carboxyl] ≡ [COOK] + [COO−]. For the hydrogel synthesis, we used 1.44 g acrylic acid (Mw = 72.06) [19]. Assuming that the volume of hydrogel synthesized was the same as the volume of deionized water used for the gel synthesis (We used 0.05 L of deionized water.), and using the experimentally measured swelling ratio, 20.80 (see Table 2), [Carboxyl] in G-0.0001 is given by (1.44 ÷ 72.06) ÷ (0.05 ×20.80) = 0.019 M = 19 molm−3. The macroscopic electroneutrality represented by (29) establishes at under the condition [H+] and [OH−] are negligibly low.
| 28 |
| 29 |
Employing Donnan theory and V in Table 2, (30) is derived, where B ≡ e/kT. (30) gives and . Using them and (29), molm−3 is obtained. Plugging [Carboxyl] = 19 molm−3, and molm−3 into the right expression of (28), K is obtained.
| 30 |
Appendix B
KA in (19) was estimated by the following experiment: A 2 mm-thick hydrogel containing -SO3H groups was synthesized. The pregel solution consisted of 2-acrylamido-2-methylpropane sulfonic acid (20.7 g), N,N’-methylenebisacrylamide (0.077 g), N,N,N’,N’-tetra-methylethylenediamin (a few drops), ammonium persulfate (0.04g) and deionized water (50 g). The hydrogel synthesized was equilibrated in 0.01 M KCl solution. We assume that -SO3H was converted into -SO3K. We made measurement of potential, ψ, at the far inside of this hydrogel in reference to the bathing solution and observed ψ = 0.0165 V.
[K+] and [Cl−] at the far inside of the hydrogel is given by (31), where B ≡ e/kT. Because of the equilibrium equation SO + K+ SO3K, (32) is derived, where Ka is the association constant of -SO3K of hydrogel.
| 31 |
| 32 |
The total quantity of SO3K + SO is given by 20.7 ÷ 207 = 0.1 mol, where the molecular weight of 2-acrylamido-2-methylpropane sulfonic acid is 207. Assuming that the volume of gel synthesized was same as the volume of deionized water used for this synthesis, i.e. 0.05 L, and using the experimental swelling ratio of this hydrogel in 0.01 M KCl solution, 47, the total concentration of SO3K + SO in the hydrogel was given by 0.1 ÷ (0.05 ×47) = 0.043 M = 43 molm−3. Therefore, [Sulfonic] ≡ [SO] + [SO3K] = 43 molm−3. (32) is rearranged into (33) using [Sulfonic] = [SO] + [SO3K]. It is quite natural to believe that the electroneutrality is established at the far inside of hydrogel. Therefore, (34) establishes under the condition that [H+] and [OH−] are negligibly low. Using (31) and (34), [SO] at the far inside of hydrogel is given 13.7 molm−3. Therefore, using (31), (33), [Sulfonic] = 43 molm−3 and [SO] = 13.7 molm−3, Ka is given 0.11 mol−1 m 3. Selemion CMV contains -SO3H groups, and the hydrogel so far described contains -SO3H groups, too. Therefore, we employed the K a of hydrogel as K A of the Selemion CMV.
| 33 |
| 34 |
Compliance with Ethical Standards
Conflict of interests
The authors declare that they have no conflict of interest.
Contributor Information
Hirohisa Tamagawa, Phone: +81-58-293-2529, Email: tmgwhrhs@gifu-u.ac.jp.
Kota Ikeda, Phone: +81-3-5343-8357, Email: ikeda@isc.meiji.ac.jp.
References
- 1.Ling GN. A Revolution in the Physiology of the Living Cell. Malabar, Florida: Krieger Publishing Co.; 1992. [Google Scholar]
- 2.Ling GN. Biology. New York: Pacific Press; 2001. Life at the cell and below-cell level: the hidden history of a fundamental revolution. [Google Scholar]
- 3.Chou T-J, Tanioka A. Ionic behavior across charged membranes in methanol-water solutions. 1: membrane potential. J. Membrane Sci. 1998;144:275–284. doi: 10.1016/S0376-7388(98)00069-6. [DOI] [Google Scholar]
- 4.Wasserman E, Felmy A. Computation of the electrical double layer properties of semipermeable membranes in multicomponent electrolytes. Appl. Environ. Microbiol. 1998;64:2295–2300. doi: 10.1128/aem.64.6.2295-2300.1998. [DOI] [PMC free article] [PubMed] [Google Scholar]
- 5.Kodzwa MG, Staben ME, Rethwisch DG. Photoresponsive control of ion-exchange in leucohydroxide containing hydrogel membranes. J. Membrane Sci. 1999;158:85–92. doi: 10.1016/S0376-7388(99)00008-3. [DOI] [Google Scholar]
- 6.Chou T-J, Tanioka A. Membrane potential of composite bipolar membrane in ethanol-water solutions: the role of the membrane interface. J. Colloid Interface Sci. 1999;212:293–300. doi: 10.1006/jcis.1999.6090. [DOI] [PubMed] [Google Scholar]
- 7.Jauas T, Jauas T, Krajiriski H. Membrane transport of polysialic acid chains: modulation of transmembrane potential. Eur. Biophys. J. 2000;29:507–514. doi: 10.1007/s002490000097. [DOI] [PubMed] [Google Scholar]
- 8.Jeong S, Lee W, Yang W. Non stationary ionic current through polymer charged membrane. Bull. Korean Chem. Soc. 2003;24:937–942. doi: 10.5012/bkcs.2003.24.7.937. [DOI] [Google Scholar]
- 9.Davis TA, Yezek LP, Pinheiro JP, van Leeuwen HP. Measurement of Donnan potentials in gels by in situ microelectrode voltammetry. J. Electroanal. Chem. 2005;584:100–109. doi: 10.1016/j.jelechem.2005.06.021. [DOI] [Google Scholar]
- 10.Chen C-C, Derylo MA, Baker LA. Measurement of ion currents through porous membranes with scanning ion conductance microscopy. Anal. Chem. 2009;81:4742–4751. doi: 10.1021/ac900065p. [DOI] [PubMed] [Google Scholar]
- 11.Das S. Explicit interrelationship between Donnan and surface potentials and explicit quantification of capacitance of charged soft interfaces with pH-dependent charge density. Colloids Surf. A Physicochem. Eng. Asp. 2014;462:69–74. doi: 10.1016/j.colsurfa.2014.08.017. [DOI] [Google Scholar]
- 12.Colacicco G. Electrical potential at an oil/water interface. Nature. 1965;207:936–938. doi: 10.1038/207936a0. [DOI] [Google Scholar]
- 13.Colacicco G. Reversal of potential across a liquid non-aqueous membrane with regard to membrane excitability. Nature. 1965;207:1045–1047. doi: 10.1038/2071045a0. [DOI] [PubMed] [Google Scholar]
- 14.Tamagawa H, Morita S. Membrane potential generated by ion adsorption. Membranes (online journal) 2014;4:257–274. doi: 10.3390/membranes4020257. [DOI] [PMC free article] [PubMed] [Google Scholar]
- 15.Ling GN. K+ Localization in muscle cells by autoradiography, and identification of K+ adsorbing sites in living muscle cells with uranium binding sites in electron micrographs of fixed cell preparations. Physiol. Chem. Phys. 1977;9:319–327. [PubMed] [Google Scholar]
- 16.Ling GN. Oxidative phosphorylation and mitochondrial physiology: a critical review of chemiosmotic theory, and reinterpretation by the association-induction hypothesis. Physiol. Chem. Phys. 1981;13:31–96. [PubMed] [Google Scholar]
- 17.Ling GN. Truth in basic biomedical science will set future mankind free. Physiol. Chem. Phys. Med. NMR. 2011;41:19–48. [PubMed] [Google Scholar]
- 18.Tamagawa H. Membrane potential generation without ion transport. Ionics. 2014;21:1631–1648. doi: 10.1007/s11581-014-1333-7. [DOI] [Google Scholar]
- 19.Tamagawa H, Takahashi Y. Adhesion force behavior between two gels attached with an electrolytic polymer liquid. Mater. Chem. Phys. 2008;107:164–170. doi: 10.1016/j.matchemphys.2007.06.063. [DOI] [Google Scholar]
- 20.Donnan FG. Theory of membrane equilibria and membrane potentials in the presence of non-dialysing electrolytes. A contribution to physical-chemical physiology. Zeitschrift Ftir Elektrochemie und Angewandte Physikalische Chemie. 1911;1:572–581. [Google Scholar]
- 21.Donnan FG. Theory of membrane equilibria and membrane potentials in the presence of non-dialysing electrolytes. A contribution to physical-chemical physiology. J. Membr. Sci. 1995;100:45–55. doi: 10.1016/0376-7388(94)00297-C. [DOI] [Google Scholar]
- 22.Ohmine I, Tanaka T. Salt effects of the phase transition of ionic gels. J. Chem. Phys. 1982;77:5725–5729. doi: 10.1063/1.443780. [DOI] [Google Scholar]
- 23.Ricka J, Tanaka T. Swelling of ionic gels: quantitative performance of the donnan theory. Macromolecules. 1984;17:2916–2921. doi: 10.1021/ma00142a081. [DOI] [Google Scholar]
- 24.Ikeda S, Kumagaia H, Sakiyamaa T, Chua C-H, Nakamura K. Method for analyzing pH-sensitive swelling of amphoteric hydrogels? Application to a polyelectrolyte complex gel prepared from Xanthan and Chitosan? Biosci. Biotech. Biochem. 1995;59:1422–1427. doi: 10.1271/bbb.59.1422. [DOI] [Google Scholar]
- 25.Norouzi HR, Azizpour H, Sharafoddinzadeh S, Barati A. Equilibrium swelling study of cationic Acrylamide-Based hydrogels: effect of synthesis parameters, and phase transition in polyelectrolyte solutions. J. Chem. Petroleum Engineer. 2011;45:13–25. [Google Scholar]
- 26.Mentré, P.: Saibou no naka no mizu (Water in the cell) (Japanese translation of L’eau dans la cellule, Masson, Paris, 1996). University Tokyo Press, Tokyo (2006)
- 27.Chang DC. A physical model of nerve axon - I. Ionic distribution, potential profile, and resting potential. Bull. Math. Biol. 1977;39:2–22. doi: 10.1007/BF02460678. [DOI] [PubMed] [Google Scholar]
- 28.Wnek GE. Perspective: do macromolecules play a role in the mechanisms of nerve stimulation and nervous transmission? J. Polym. Sci. Polym. Phys. 2016;54:7–14. doi: 10.1002/polb.23898. [DOI] [Google Scholar]


