Abstract
Objective
To investigate representation by gender among recipients of physician recognition awards presented by the American Academy of Neurology (AAN).
Methods
We analyzed lists of individual recipients over the 63-year history of the AAN recognition awards. Included were awards intended primarily for physician recipients that recognized a body of work over the course of a career. The primary outcome measures were total numbers and proportions of men and women physician award recipients.
Results
During the period studied, the proportion of women increased from 18% (1996) to 31.5% (2016) among AAN US neurologist members and from 18.6% (1992) to 35% (2015) in academia, and the AAN presented 323 awards to physician recipients. Of these recipients, 264 (81.7%) were men and 59 (18.3%) were women. During the most recent 10-year period studied (2008–2017), the proportion of women increased from 24.7% (2008) to 31.5% (2016) among AAN US neurologist members and from 28% (2009) to 35% (2015) in academia, and the AAN presented 187 awards to physician recipients, comprising 146 men (78.1%) and 41 women (21.9%). Although it has been more than 2 decades since the proportion of women among US neurologist members of the AAN was lower than 18%, 1 in 4 AAN award categories demonstrated 0% to 18% representation of women among physician recipients during the most recent decade. Moreover, for highly prestigious awards, underrepresentation was more pronounced.
Conclusion
Although the reasons why are not clear, women were often underrepresented among individual physician recognition award recipient lists, particularly for highly prestigious awards.
Although medical specialty societies have an important role in supporting physicians, few studies have focused on how they support women physicians. Initial studies by some of the authors of this report demonstrated that women were underrepresented in physician awards presented by both the American Academy of Physical Medicine and Rehabilitation1 and Association for Academic Physiatrists (AAP).2 In a third report, they3 demonstrated the underrepresentation of women physicians among recognition award recipients at zero or near zero levels in 11 medical specialty societies associated with neurology, dermatology, anesthesiology, orthopedic surgery, head and neck surgery, plastic surgery, and physical medicine and rehabilitation. Included were the American Academy of Neurology's (AAN) Wayne A. Hening Sleep Medicine Investigator Award, with 6 men and zero women physician recipients since 2011, and the American Neurological Association's George W. Jacoby Award, with 20 men and zero women physician recipients since 1950. These findings suggested that further investigation of gender distribution within recognition awards presented by neurology-related societies was warranted.
Methods
We examined lists of AAN award histories published online at aan.com4–7 and representing 63 years of member recognition (1955–2017). Included were those recognition awards that had their past recipients listed on AAN award-related web pages, were exclusively or primarily aimed at individual physician recipients, and recognized a body of work over the course of a career. Excluded were recognition awards that did not list past recipients on the AAN Awards History web pages, those that recognized a single accomplishment or team efforts, and those that exclusively or primarily focused on nonphysician recipients. Fellowships, scholarships, grants (e.g., research funding), and training programs (e.g., career development or research training) were not considered recognition awards and therefore were excluded. All data were publicly available and therefore institutional review board approval was not needed for this study.
As is currently customary for research in the area of workforce equity issues, “The term ‘gender,’ as opposed to the term ‘sex,’ is used in this work, because it would be impossible to discern biological sex without direct interaction, and it is assumed that facial appearance and name generally reflect whether a person identifies and wishes to be recognized as male or female, respectively.”8 There were 20 awards that met the inclusion criteria (table). For the awards included, at least 2 researchers independently verified the name, credentials, and gender of each recipient via online searches. A third researcher reviewed and reconciled discrepancies. The primary outcome measures were total numbers of awards given to women and men physicians over the history of each included AAN award. For the recognition award recipient lists containing a limited number of nonphysician recipients, we excluded the nonphysician recipients from further analysis.
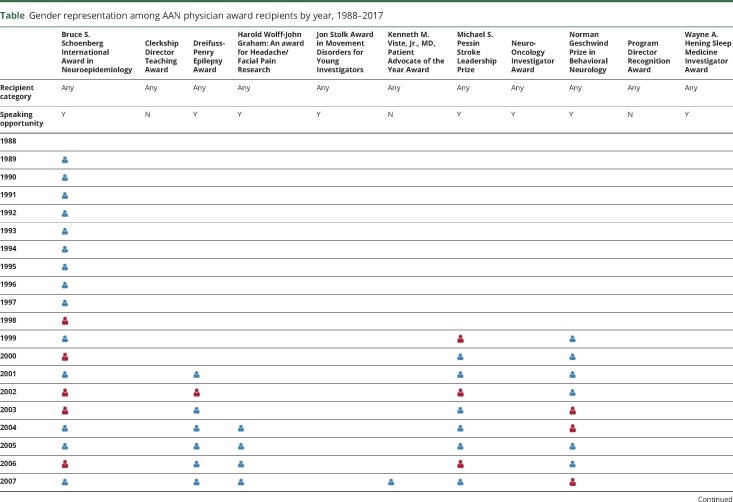
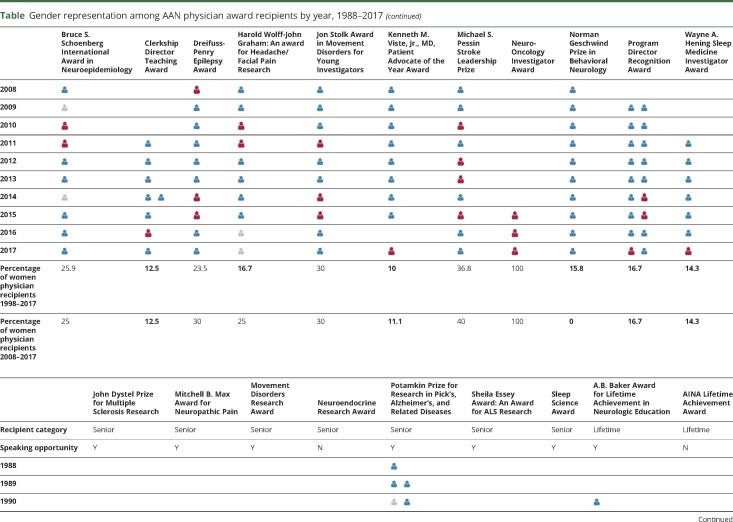
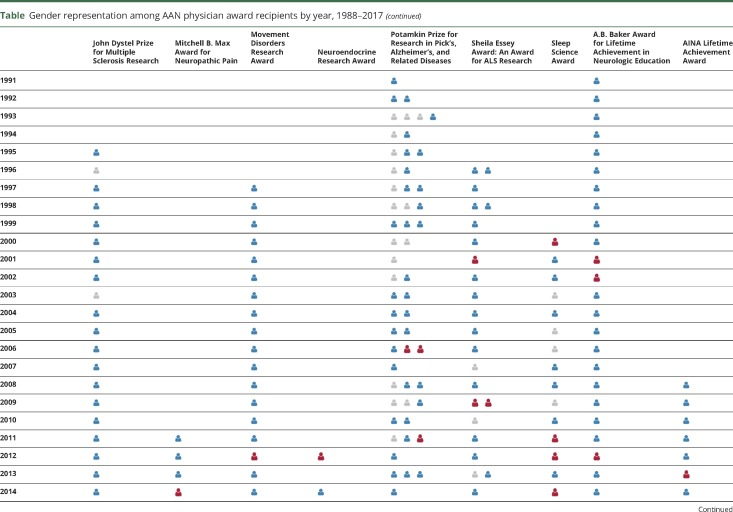
Table.
Gender representation among AAN physician award recipients by year, 1988–2017
Gender-related demographic data from the Association of American Medical Colleges (AAMC),9–17 including the proportion of women physicians specializing in neurology and who were in active practice, in academia or in residency programs, and the AAN,18–22 including the proportion of women among all members and women among US neurologist members, were used for comparison. We used 2 types of statistical analysis: (1) for each year for which specific information regarding the percent of women among AAN US neurologist members was available, we performed a 1-sample test comparing the proportion of awardees who were women to their representation in the AAN; (2) for a cross-year comparison, we performed an exact binomial test using a null hypothesis that women were as likely to be overrepresented as underrepresented. The binomial distribution is used when there are only 2 possible responses, often called “success” and “failure.” Here, the 2 possibilities were underrepresentation (as compared to the proportion of women in the population) and overrepresentation. In this case, we tested whether the probability of being underrepresented was equal to 50%, though other rates could be used. If the rates were exactly equal, the outcome was considered to be overrepresentation.
Data availability
All data are included in this report.
Results
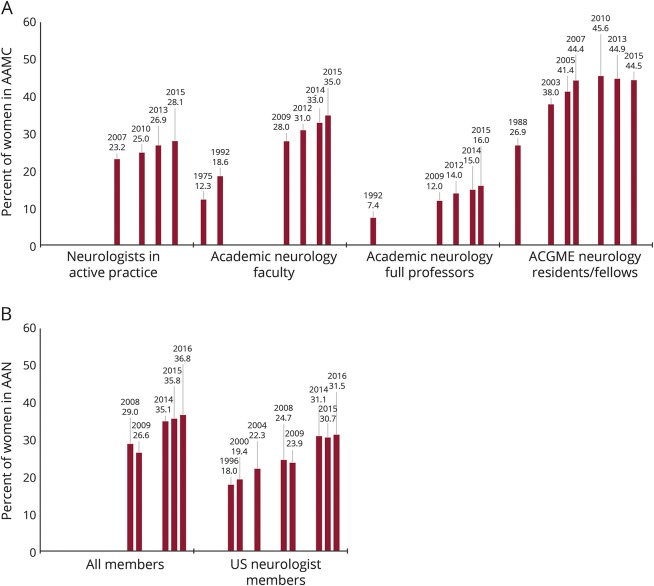
Although complete sets of gender-related data (i.e., total numbers of physicians, numbers of women among physicians, and proportion of women among physicians) were not published every year during the study period, diversity with respect to women in the neurology workforce increased (figure 1). According to data from the AAMC, within the most recent decade, the percentage of women physicians actively practicing neurology in the United States increased by 21.1% between 2007 (n = 2,923 of 12,612; 23.2%) and 2015 (n = 3,760 of 13,378; 28.1%).9–12 The percentage of women physicians working in academic neurology departments increased by 25% between 2009 (n = 879; 28%) and 2015 (n = 1,455; 35%).13,14,16,23 Gains were also found for women physicians among full professors serving in neurology departments, increasing by 33.3% between 2009 (n = 106; 12%) and 2015 (n = 172; 16%).13,14,16,23 Of note, the percentage of women residents and fellows in neurology programs remained steady near 45% between 2007 (n = 709; 44.4%) and 2015 (n = 1,011; 44.5%) and at a level nearly equal to the representation of men.9,23–25
Figure 1. Representation of women among neurologists over time.
Before evaluating the representation of women among award recipients, it was necessary to consolidate relevant population data, allowing examination of trends in the representation of women both in the field of neurology and in the AAN as well as determination of the size of the potential award recipient pool. (A) Representation of women in the field of neurology: among neurologists in active practice, academic neurology faculty, academic neurology full professors, and ACGME residents and fellows as available and reported by the AAMC. (B) Representation of women in the organization: among all members and among US neurologist members as available and reported by the AAN. AAMC = Association of American Medical Colleges; AAN = American Academy of Neurology; ACGME = Accreditation Council for Graduate Medical Education.
Although not published every year during the study period, our analysis of available AAN member gender data also revealed increases in the representation of women among 2 commonly reported member categories (figure 1).18–22 The proportion of women among all members increased by 26.9% between 2008 (29% of 21,719) and 2016 (36.8% of 30,879). Publicly available reports of AAN US neurologist member data put the proportion of women at 18% in 1996, 19.4% in 2000, and 22% in 2003. During the most recent decade (2008–2017), the proportion of women among US neurologist members increased by 27.5% (24.7% of 11,999 to 31.5% of 13,389).
During the 63-year period studied (1955–2017) and within the award categories included, the AAN presented 20 awards to 323 physician recipients. Overall, 264 physician recipients (81.7%) were men and 59 (18.3%) were women (figure 2). During the most recent 10-year period studied (2008–2017), 187 awards were presented to physician recipients, comprising 146 men (78.1%) and 41 women (21.9%).
Figure 2. Gender distribution among physician recognition award recipients.
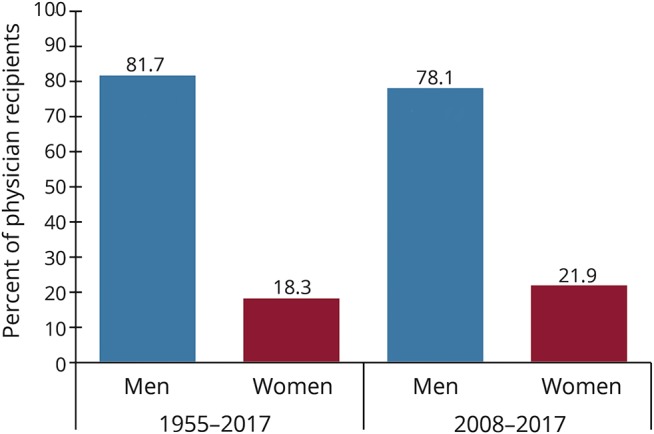
The representation of women among physician recipients was determined first for the entire study period (1955–2017). To account for an increasing proportion of women among neurologists working in the field and among members of the organization, the representation of women among physician recipients was also determined for the most recent 10 years (2008–2017).
Of the awards included in this report, the first was presented in 1988. Thereafter, the number of awards presented each year trended upward to a maximum of 21 (2013 and 2017) (figure 3A). Although no woman physician received an award for 10 years, the presentation of awards to women physicians has also been on an upward trend (figure 3B).
Figure 3. Trends in the presentation of American Academy of Neurology physician recognition awards.
(A) Number of awards presented to physician recipients each year during the study period. (B) Number of awards presented to physician recipients each year during the study period, separated by recipient gender.
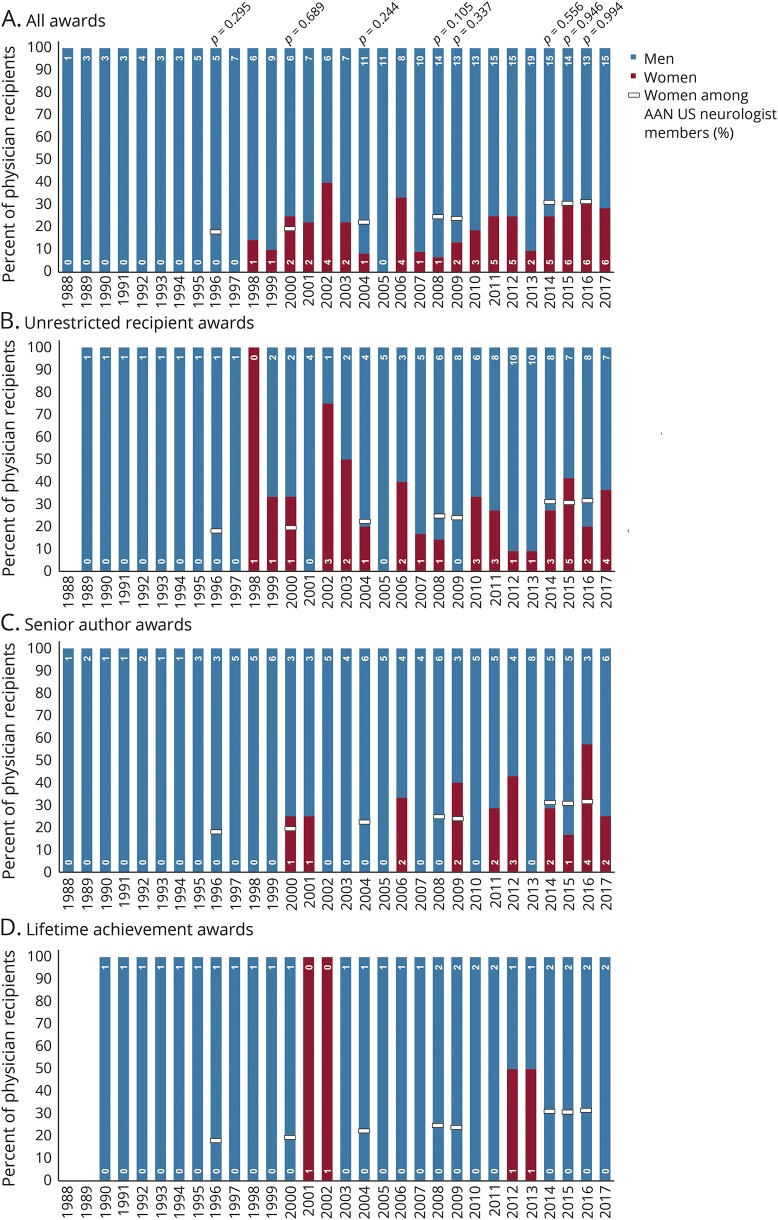
The proportional representation of women by year within all 20 included award categories ranged from 0% to 40% during the study period, including 11 (36.7%) of 30 years during which women were absent from recipient lists (table and figure 4A). More recently (2014–2017), the overall distribution of awards to women physicians appeared to be holding steady near equitable levels. A binomial test was used over the entire period and under several different assumptions showed that there was a pattern of underrepresentation of women among awardees. When we used linear interpolation to estimate the percentage of women among AAN US neurologist members in years for which information was not publicly available, the data showed that in 80% of the comparisons women were underrepresented (p value from the test = 0.0014). In addition, for those few years for which information regarding the percentage of women among the US neurologist membership was available (figure 1), we used an exact binomial test to compare the percentage of women among awardees to the percentage of women among US neurologist members. None of these tests were statistically significant; however, given the small number of awardees in each year, the statistical power was low and, thus, this result was not surprising.
Figure 4. Gender distribution among physician recognition award recipients by year, 1988–2017.
Each chart depicts the representation of men and women among physician recipients of recognition awards as well as the study benchmark for the equitable representation of women among recipients; the proportion of women among US neurologist members of the AAN. (A) Gender-related distribution of all included awards. To better understand how award criteria affected gender-related distribution of awards, all awards were then subdivided into groups based on descriptions of eligible recipients. (B) Categories open to any physician candidate (unrestricted). (C) Categories open to senior author candidates. (D) Categories open to lifetime achievement award candidates. AAN = American Academy of Neurology.
To develop a better understanding of how the representation of women may be related to award criteria and using published listings of applicant categories, award names, and/or recipient criteria, we subdivided the 20 awards by recipient category (table).26 These included one category for unrestricted recipients (awards open to all physicians) and 2 categories for restricted recipients: senior recipients (awards intended to recognize “senior authors”) and lifetime achievement recipients (awards intended to recognize “lifetime career achievements” or work “over a significant period of time”). Among the 11 unrestricted recipient awards, the proportional representation of women by year varied widely and ranged from 0% to 100%. The one instance of 100% representation of women among awardees in this recipient category occurred during the 10 years (1989–1998) in which only one award was presented to a single recipient (Bruce S. Schoenberg International Award in Neuroepidemiology; 1998). Overall, women were absent among awardees in this unrestricted recipient category in 12 (41.4%) of 29 years (table and figure 4B), including 3 years during which multiple awards were presented. Since 2014, the distribution of unrestricted awards to women among physician recipients appeared to be holding steady near equitable levels.
Almost one-half (n = 9 of 20; 45%) of the AAN recognition awards that met the inclusion criteria were awards meant to recognize senior author applicants26 or lifetime achievements (table). These awards are generally considered to be more prestigious, representing work by established physicians and/or a physician's body of work over an extended time period. Among the 7 senior author awards, the proportional representation of women by year ranged from 0% to 57.1%, including 20 (66.7%) of 30 years during which women were absent among recipients (figure 4C). Among the 2 lifetime achievement awards, the proportional representation of women by year ranged from 0% to 100%. The 2 instances of 100% representation of women among awardees occurred during the 18 years in which only one lifetime achievement award (A.B. Baker Award for Lifetime Achievement in Neurologic Education) was given to a single recipient. Overall, women were absent among recipients of lifetime achievement awards in 24 (85.7%) of 28 years (figure 4D).
We assessed the visibility of women physicians as leaders within the AAN by determining the representation of women among recipients of awards that included a documented opportunity to speak during the annual meeting. Of the 20 included awards, 15 (75%) were described as including an opportunity to speak during the annual meeting (table). Other than the A.B. Baker Award for Lifetime Achievement in Neurologic Education, which typically involves a keynote-type address to the membership, the speaking opportunities were described as 10- or 20-minute presentations during scientific sessions. Women were underrepresented among physician recipient speakers during the entire study period (19%; n = 51 of 272) and during the most recent 10 years (24%; n = 33 of 137).
Trends in distribution within each included award category were also examined and compared to the proportion of women among US neurologist members of the AAN in 1996 (18%).22 Overall, in 13 (65%) of the 20 recipient lists, women physicians were represented at a level that ranged from 0% to 18% (table; bold font). To account for unequal weighting caused by the absence of women among recipients before 1998 and growth in the membership of women physician members during the study period, we also examined distribution of each individual award during the most recent decade (2008–2017). Within the 12 award categories presented for more than 10 years, 9 (75%) recipient lists reflected recent increases in the distribution to women when compared to their distribution overall (Dreifuss-Penry Epilepsy Award; Harold Wolff-John Graham: An Award for Headache/Facial Pain Research; Kenneth M. Viste, Jr., MD, Patient Advocate of the Year Award; Michael S. Pessin Stroke Leadership Prize; John Dystel Prize for Multiple Sclerosis Research; Movement Disorders Research Award; Potamkin Prize for Research in Pick's, Alzheimer's, and Related Diseases; and Sheila Essey Award: An Award for ALS Research and Sleep Science Award). However, the distribution of 3 (25%) physician awards to women during the most recent decade either remained relatively constant (Bruce S. Schoenberg International Award in Neuroepidemiology and A.B. Baker Award for Lifetime Achievement in Neurologic Education) or decreased (Norman Geschwind Prize in Behavioral Neurology) when compared to their distribution overall. Moreover, within distribution of 4 (25%) of the 12 physician awards presented for more than 10 years, women remained represented at levels ≤18% (Kenneth M. Viste, Jr., MD, Patient Advocate of the Year Award; Norman Geschwind Prize in Behavioral Neurology; John Dystel Prize for Multiple Sclerosis Research; and A.B. Baker Award for Lifetime Achievement in Neurologic Education).
Discussion
This study addressed a single measure of diversity and inclusion within the AAN, the distribution of recognition awards to men and women physicians. Key findings include that women physicians were underrepresented for recognition awards overall and more recently over the past decade. Although the number and percentage of individual awards presented to women physicians trended upward during the study period, 65% of all recipient lists and 25% of recipient lists for awards presented to physicians for more than 10 years were associated with representation of women at levels ≤18%. Moreover, although prestige is not easily measured, notably, as the selectivity of the recipient category increased from unrestricted through senior author to lifetime achievement, the proportion of years during which women were absent from recipient lists increased from 40% to 85.7%. This suggests that some of the greatest gaps for women neurologists receiving awards are in the more prestigious categories. Distribution of the A.B. Baker Award for Lifetime Achievement in Neurologic Education is particularly important because this is a prestigious award and involves a keynote-type of address to the membership. Women were also underrepresented among some of the most visible (speaking) leaders in the field during the entire study period (19%) and during the most recent 10 years (24%). These findings are similar to what some of the authors of this report found in a study of recognition awards in physiatrists that demonstrated the greatest underrepresentation of women physicians was in the most prestigious award categories, particularly those associated with lectureships during which awardees have the opportunity to speak and offer their insights and vision for the future of the specialty.1
The proportion of women in the neurology workforce continues to grow overall and in academia; however, as in other medical specialties, there are areas in which proportional representation of women physicians is evident and areas in which documented gaps exist. For example, historical evidence from the American Medical Association notes that among neurologists in office-based practice, women had lower annual incomes after adjustment for workload and provider and practice characteristics.27 More recently, in a report assessing gender distribution among American Board of Medical Specialties boards of directors, researchers found that the American Board of Neurology included a more-than-equitable ratio of women (n = 4 of 8; 50%) than expected when compared to women in the specialty (31.8%) and women in training (44.7%).28 However, women neurologists were underrepresented on journal editorial boards.29 In the neurology departments of public medical schools, men received higher salaries, even after adjustment for faculty rank, age, years since residency, specialty, NIH funding, clinical trial participation, publication count, total Medicare payments, and graduation from a U.S. News & World Report top-20 medical school.30 Women neurologists were also underrepresented in the upper levels of academia and were less likely than men to be full professors of neurology at American medical schools, even after adjusting for age, years since residency, publications, NIH grants, clinical trials, and faculty appointment at a U.S. News & World Report top-20 medical school.31
Causality was not specifically addressed in this study, and gaps in workforce gender equity are often multifactorial. However, a “lack of qualified women in the pipeline” is a frequently cited reason for gender equity gaps. Although 1 in 4 AAN award categories demonstrated 0% to 18% representation of women among physician recipients during the most recent decade, it has been more than 2 decades since the proportion of women among US neurologist members of the AAN was lower than 18%. Moreover, the US pool of women neurology award candidates currently comprises, but is not limited to, 400+ successful and high-achieving women physicians including more than 170 full professors and more than 280 associate professors,16 suggesting that there were and are likely numerous qualified candidates for each award offered by the AAN and that pipeline is unlikely to be a major contributing factor. Keith Lillemoe, MD, also tackled the pipeline myth in his presidential address to the American Surgical Association, by saying, “The number of outstanding, qualified female candidates is more than adequate to fill every open surgical leadership position in America today. The problem is not the pipeline—it is the process.”32
This study suggests then that other factors may be involved and should be investigated,33 including, but not limited to, the role that implicit bias or other factors may have in the processes involved in selection of award committee members,34,35 calls and criteria for nominations,35,36 submission and evaluation of supporting materials,35,37–39 and selection of awardees.35,40 In addition and because many of the awards targeted defined subspecialties (e.g., neuroepidemiology, sleep medicine, or neuropathic pain) or specific positions (e.g., clerkship director or program director), it will be important to assess the representation of women within subsets of AAN physician members as has been done in studies of the representation of women among decanal roles at US medical schools.8
Following a previous study of recognition awards, some of the authors of this report3 suggested a 6-step plan and categories of metrics for evaluating the representation of women within medical societies (e.g., awards, committee chairs, and plenary speakers). Recommendations included the gathering and analyzing of data coupled with transparent reporting, investigation of causality, implementation of strategies to improve inclusion, tracking of outcomes, and considering the publication of results. Indeed, a task force recently used this plan to evaluate the representation of women among various subsets of members of the AAP,41 including, but not limited to, presidents, voting and nonvoting members of the board of trustees, award recipients, training program participants, and journal editors. Regarding awards, task force members found that causality was multifactorial, meaning that no women were nominated for some awards and women were nominated but not selected by the awards committee for other awards. The AAP is currently undertaking a multipronged approach to further study that includes, but is not limited to, actively encouraging the nomination of women for awards and implicit bias training for members of the awards selection committee. In addition, diversity stewards who will work with the task force and be responsible for tracking data have been assigned to each problem area. A follow-up report is planned within 3 years. As the largest organization of practicing neurologists,42 the AAN, whose mission is “to promote the highest quality patient-centered neurologic care and enhance member career satisfaction,”42 has an opportunity to expand investigation into gender disparities43 and similarly support the neurology physician workforce by implementing assessments and interventions to ensure equity in the provision of key resources, opportunities, and recognition.
This study had several limitations. Physician awards included in this report were presented during the most recent 30-year history of AAN physician recognition; comprising 20 awards and 323 recipients, with maximums of 21 recipients and 6 women in any one year. In addition, although the more inclusive and likely accurate benchmark for gender equity among recipients of physician recognition awards would equate to the percentage of women among all AAN physician members, only US physician member data was reported. Moreover, population data were not available from the AAMC or AAN for every year during the study period, and although percentages of women among all and US neurologists were reported as noted, actual numbers of women among these groups were not. Finally, data used for this analysis, including classification of recipients as man or woman through use of photographs or descriptions including the pronoun he or she, were gleaned from publicly available online resources and may be subject to error on the part of the authors.
Professional recognition is important in career advancement, especially for academic neurologists. The results of this study suggest that women in neurology are underrepresented for recognition awards. The reasons for this are likely multifactorial and deserve further investigation.
Acknowledgment
The authors thank Divya Singhal, MD, Vice Chair, Women's Issues in Neurology section, AAN, and Assistant Professor of Neurology, University of Oklahoma, for reviewing this manuscript before submission.
Glossary
- AAMC
Association of American Medical Colleges
- AAN
American Academy of Neurology
- AAP
Association for Academic Physiatrists
Footnotes
Editorial, page 291
Author contributions
Julie K. Silver, MD: study concept, design, and supervision, analysis and interpretation of data, critical revision of manuscript for intellectual content. Anna M. Bank, MD: collection and review of data. Chloe S. Slocum, MD: collection and review of data. Cheri A. Blauwet, MD: critical revision of the manuscript for intellectual content. Saurabha Bhatnagar, MD: analysis and review, and critical revision of the manuscript for intellectual content. Julie A. Poorman, PhD: collection, analysis, and interpretation of data, and critical revision of manuscript for intellectual content. Richard Goldstein, PhD: analysis and interpretation of data, statistical analysis and review, and critical revision of the manuscript for intellectual content. Julia M. Reilly, MD: collection and review of data. Ross D. Zafonte, DO: critical revision of the manuscript for intellectual content.
Study funding
No targeted funding reported.
Disclosure
The authors report no disclosures relevant to the manuscript. Go to Neurology.org/N for full disclosures.
References
- 1.Silver JK, Bhatnagar S, Blauwet CA, et al. Female physicians are underrepresented in recognition awards from the American Academy of Physical Medicine and Rehabilitation. PM R 2017;9:976–984. [DOI] [PubMed] [Google Scholar]
- 2.Silver JK, Blauwet CA, Bhatnagar S, et al. Women physicians are underrepresented in recognition awards from the Association of Academic Physiatrists. Am J Phys Med Rehabil 2018;97:34–40. [DOI] [PMC free article] [PubMed] [Google Scholar]
- 3.Silver JK, Slocum CS, Bank AM, et al. Where are the women? The underrepresentation of women physicians among recognition award recipients from medical specialty societies. PM R 2017;9:804–815. [DOI] [PubMed] [Google Scholar]
- 4.American Academy of Neurology. AAN Awards History. 2016. Available at: aan.com/education-and-research/research/awards-history/. Accessed August 24, 2017. Updated April 24, 2018.
- 5.American Academy of Neurology. Kenneth M. Viste, Jr., MD, Patient Advocate of the Year Award. 2017. Available at: tools.aan.com/science/awards/?fuseaction=home.info&id=27. Accessed August 24, 2017.
- 6.American Academy of Neurology. Clerkship Director Teaching Award. 2017. Available at: tools.aan.com/science/awards/?fuseaction=home.info&id=61. Accessed August 24, 2017.
- 7.American Academy of Neurology. Program Director Recognition Award. 2017. Available at: tools.aan.com/science/awards/?fuseaction=home.info&id=40. Accessed August 24, 2017.
- 8.Schor NF. The decanal divide: women in decanal roles at U.S. Medical schools. Acad Med 2018;93:237–240. [DOI] [PubMed] [Google Scholar]
- 9.Association of American Medical Colleges Center for Workforce Studies. 2008 Physician Specialty Data. 2008. Available at: aamc.org/download/47352/data/specialtydata.pdf. Accessed December 19, 2017. [Google Scholar]
- 10.Association of American Medical Colleges Center for Workforce Studies. 2012 Physician Specialty Data Book. 2012. Available at: aamc.org/download/313228/data/2012physicianspecialtydatabook.pdf. Accessed August 1, 2017. [Google Scholar]
- 11.Association of American Medical Colleges Center for Workforce Studies. 2014 Physician Specialty Data Book. Washington, DC: Association of American Medical Colleges Center for Workforce Studies; 2015. [Google Scholar]
- 12.Association of American Medical Colleges. 2016 Physician Specialty Data Report: Table 1.3. Active Physicians by Sex and Specialty, 2015. 2015. Available at: aamc.org/data/workforce/reports/458712/1-3-chart.html. Accessed January 30, 2017. [Google Scholar]
- 13.Association of American Medical Colleges. Table 4: Distribution of Women Faculty by Department, Rank, and Degree, 2009. 2009. Available at: aamc.org/download/53480/data/table4_2009.pdf. Accessed August 25, 2017. [Google Scholar]
- 14.Jolliff L, Leadley J, Coakley E, Sloane RA. Women in U.S. Academic Medicine and Science: Statistics and Benchmarking Report 2011–2012. Washington, DC: Association of American Medical Colleges; 2012. [Google Scholar]
- 15.Association of American Medical Colleges. Table 4A: Distribution of Women M.D. Faculty by Department and Rank, 2014. 2014. Available at: aamc.org/download/411788/data/2014_table4a.pdf. Accessed May 10, 2017. [Google Scholar]
- 16.Association of American Medical Colleges. Table 4A: Distribution of Full-time Women M.D. Faculty by Department and Rank, 2015. 2016. Available at: aamc.org/download/481184/data/2015table4a.pdf. Accessed September 7, 2017. [Google Scholar]
- 17.Association of American Medical Colleges. 2016 Physician Specialty Data Report: Table 2.2. ACGME Residents and Fellows by Sex and Specialty, 2015. 2016. Available at: aamc.org/data/workforce/reports/458766/2-2-chart.html. Accessed January 30, 2017. [Google Scholar]
- 18.Vidic TR, Branch CE Jr, Crumrine PK, et al. 2017 Insights Report: A Report from the Member Research Subcommittee of the American Academy of Neurology. Minneapolis: American Academy of Neurology; 2017. [Google Scholar]
- 19.Vidic TR, Branch CE Jr, Crumrine PK, et al. 2016 Insights Report: A Report from the Member Research Subcommittee of the American Academy of Neurology. Minneapolis: American Academy of Neurology; 2016. [Google Scholar]
- 20.Vidic TR, Branch CE Jr, Henderson VW, et al. 2015 Insights Report: A Report from the Member Research Subcommittee of the American Academy of Neurology. Minneapolis: American Academy of Neurology; 2015. [Google Scholar]
- 21.Adornato BT, Drogan O, Thoresen P, et al. The practice of neurology, 2000–2010: report of the AAN Member Research Subcommittee. Neurology 2011;77:1921–1928. [DOI] [PubMed] [Google Scholar]
- 22.Holloway RG, Vickrey BG, Keran CM, et al. US neurologists in the 1990's: trends in practice characteristics. Neurology 1999;52:1353–1361. [DOI] [PubMed] [Google Scholar]
- 23.Bickel J, Quinnie R. Women in Medicine: Statistics. Washington, DC: Association of American Medical Colleges; 1992. [Google Scholar]
- 24.Association of American Medical Colleges. Table 2: Distribution of Residents by Specialty, 2003 Compared to 2013. 2012. Available at: aamc.org/download/411784/data/2014_table2.pdf. Accessed September 30, 2016. [Google Scholar]
- 25.Association of American Medical Colleges. Table 2: Distribution of Residents by Specialty, 2005 Compared to 2015. 2016. Available at: aamc.org/download/481180/data/2015table2.pdf. Accessed August 25, 2017. [Google Scholar]
- 26.American Academy of Neurology. Awards & Fellowships. 2017. Available at: tools.aan.com/science/awards/index.cfm?fuseaction=home.awards. Accessed August 25, 2017.
- 27.Weeks WB, Wallace AE. The influence of provider sex on neurologists' annual incomes. Clin Neurol Neurosurg 2007;109:38–44. [DOI] [PubMed] [Google Scholar]
- 28.Walker LE, Sadosty AT, Colletti JE, Goyal DG, Sunga KL, Hayes SN. Gender distribution among American Board of Medical Specialties Boards of Directors. Mayo Clin Proc 2016;91:1590–1593. [DOI] [PubMed] [Google Scholar]
- 29.Amrein K, Langmann A, Fahrleitner-Pammer A, Pieber TR, Zollner-Schwetz I. Women underrepresented on editorial boards of 60 major medical journals. Gend Med 2011;8:378–387. [DOI] [PubMed] [Google Scholar]
- 30.Jena AB, Olenski AR, Blumenthal DM. Sex differences in physician salary in US public medical schools. JAMA Intern Med 2016;176:1294–1304. [DOI] [PMC free article] [PubMed] [Google Scholar]
- 31.Jena AB, Khullar D, Ho O, Olenski AR, Blumenthal DM. Sex differences in academic rank in US medical schools in 2014. JAMA 2015;314:1149–1158. [DOI] [PMC free article] [PubMed] [Google Scholar]
- 32.Lillemoe KD. Surgical mentorship: a great tradition, but can we do better for the next generation? Ann Surg 2017;266:401–410. [DOI] [PubMed] [Google Scholar]
- 33.Lincoln AE, Pincus SH, Leboy PS. Scholars' awards go mainly to men. Nature 2011;469:472. [DOI] [PubMed] [Google Scholar]
- 34.Bruguera M, Arrizabalaga P, Londono MC, Padros J. Professional recognition of female and male doctors. Rev Clin Esp 2014;214:69–73. [DOI] [PubMed] [Google Scholar]
- 35.Committee of Presidents of Statistical Societies (COPPS). Avoiding implicit bias: guidelines for COPSS awards committees. 2017. Available at: higherlogicdownload.s3.amazonaws.com/AMSTAT/71a758c7-5229-4729-bb64-caf9d1cf855f/UploadedFiles/RtuYkcvQxCMQemLzjpQb_Avoiding_Implicit_Bias_COPSS_v3.pdf. Accessed April 24, 2018.
- 36.Abbuhl S, Bristol MN, Ashfaq H, et al. Examining faculty awards for gender equity and evolving values. J Gen Intern Med 2010;25:57–60. [DOI] [PMC free article] [PubMed] [Google Scholar]
- 37.Young VN. Letters of recommendation: association with interviewers' perceptions and preferences. Otolaryngol Head Neck Surg 2017;156:1108–1113. [DOI] [PubMed] [Google Scholar]
- 38.Choo EK. Damned if you do, damned if you don't: bias in evaluations of female resident physicians. J Grad Med Educ 2017;9:586–587. [DOI] [PMC free article] [PubMed] [Google Scholar]
- 39.Trix F, Psenka C. Exploring the color of glass: letters of recommendation for female and male medical faculty. Discourse Soc 2003;14:191–220. [Google Scholar]
- 40.Carnes M, Geller S, Fine E, Sheridan J, Handelsman J. NIH Director's Pioneer Awards: could the selection process be biased against women? J Womens Health 2005;14:684–691. [DOI] [PubMed] [Google Scholar]
- 41.Silver JK, Cuccurullo S, Ambrose AF, et al. Association of Academic Physiatrists women's task force report. Am J Phys Med Rehabil Epub 2018 Apr 30. [DOI] [PubMed]
- 42.American Academy of Neurology. AAN Vision and Mission. 2017. Available at: aan.com/membership/aan-vision-and-mission/. Accessed August 1, 2017. [Google Scholar]
- 43.Avitzur O. Professionalism: women neurology chairs on gender disparity and what they are doing about it. Neurol Today 2018;18:12–14. [Google Scholar]
Associated Data
This section collects any data citations, data availability statements, or supplementary materials included in this article.
Data Availability Statement
All data are included in this report.


