

Abstract
The human prefrontal cortex (PFC) differs from that of other primates with respect to size, histology, and functional abilities. Here, we analyzed genome-wide expression data of humans, chimpanzees, and rhesus macaques to discover evolutionary changes in transcription factor (TF) networks that may underlie these phenotypic differences. We determined the co-expression networks of all TFs with species-specific expression including their potential target genes and interaction partners in the PFC of all three species. Integrating these networks allowed us inferring an ancestral network for all three species. This ancestral network as well as the networks for each species is enriched for genes involved in forebrain development, axonogenesis, and synaptic transmission. Our analysis allows us to directly compare the networks of each species to determine which links have been gained or lost during evolution. Interestingly, we detected that most links were gained on the human lineage, indicating increase TF cooperativity in humans. By comparing network changes between different tissues, we discovered that in brain tissues, but not in the other tissues, the human networks always had the highest connectivity. To pinpoint molecular changes underlying species-specific phenotypes, we analyzed the sub-networks of TFs derived only from genes with species-specific expression changes in the PFC. These sub-networks differed significantly in structure and function between the human and chimpanzee. For example, the human-specific sub-network is enriched for TFs implicated in cognitive disorders and for genes involved in synaptic plasticity and cognitive functions. Our results suggest evolutionary changes in TF networks that might have shaped morphological and functional differences between primate brains, in particular in the human PFC.
Keywords: transcription factor, co-expression, network evolution, primates, prefrontal cortex
Introduction
Understanding why humans have unique cognitive abilities requires the identification of morphological and molecular aspects that are unique to the human brain. Unique morphological features of the human brain include its larger size (Povinelli and Preuss 1995; Koechlin et al. 2003; Schoenemann et al. 2005; Enard 2015; Smaers et al. 2017; Donahue et al. 2018) its cell-type compositions (Sherwood et al. 2006; Oberheim et al. 2009; Spocter et al. 2012), and specific cortical architectural structures (Buxhoeveden et al. 2006; Smaers et al. 2011). At the molecular level, there are several genes with brain functions that have been shown to evolve under positive selection on the human lineage, making them prime candidates for having contributed to the evolution of human-specific features. For example, ASPM (Zhang 2003; Mekel-Bobrov et al. 2005; Montgomery and Mundy 2012) and MCPH1 (Ponting and Jackson 2005; Voight et al. 2006; Pulvers et al. 2015), which determine brain size, and FOXP2, which when mutated causes severe cognitive and speech deficits (Enard et al. 2002b; Fisher and Scharff 2009; Konopka et al. 2009). Moreover, evolutionary young KRAB zinc-fingers (ZNFs) genes have been shown to be preferentially expressed in the human developing prefrontal cortex (PFC) (Nowick et al. 2011) and to evolve rapidly in sequence and expression in primates (Nowick et al. 2009; Nowick et al. 2011), suggesting that this gene family has played an important role during the evolution of the human brain. In line with these findings, several studies identified expression differences in the human compared with the chimpanzee brain that might be linked to human-specific traits (Enard et al. 2002a; Cáceres et al. 2003; Somel et al. 2009; Babbitt et al. 2010; Liu et al. 2012). Since expression changes are often controlled by transcription factors (TFs) that are activating or repressing the expression of target genes it seems likely that TFs are responsible for driving some of the expression pattern differences and hence morphological differences between humans and other primates.
Despite the importance of TFs, only a limited number of studies so far have focused on evolutionary changes in TFs or TF networks in primates (Nowick et al. 2009; Schmidt et al. 2010; Schwalie et al. 2013; Ballester et al. 2014). These studies were limited in that the network analysis was based on ubiquitously expressed genes (i.e. not being able to reveal brain-specific differences) and only included human and chimpanzee samples (i.e. not being able to distinguish between changes on the human or chimpanzee lineage). Recent studies have investigated co-expression differences between humans and chimpanzees using an outgroup (Konopka et al. 2012; Sousa et al. 2017; Xu et al. 2018). This work has revealed human-specific co-expression modules especially in the frontal lobe, which are enriched for genes involved in neuronal processes and psychiatric diseases. However, due to the methods used in these studies (WGCNA; Langfelder and Horvath 2008), it is restricted to an analysis at the level of modules, thus not providing the possibility to pinpoint particular network links that have changed during evolution. Moreover, while progress in uncovering the biological cascades that take place during mammalian brain development has been made, how the morphological and functional differences of the human brain are determined is still not well understood.
To gain more insights into the gene regulatory processes that might underlie human-specific brain evolution, we investigate here how a TF co-expression network evolves in the primate PFC. To do so, we analyzed genome-wide expression data from PFC samples of humans, chimpanzees, and rhesus macaques to first determine the genes that are specifically changed in each species. In total, we identified 645 genes coding for TFs that show lineage-specific expression, among them 134 known to be involved in brain development, functions, and/or diseases. We then derived weighted topological overlap (wTO) networks from the changed TFs and their correlated genes and compare these networks between the three species to infer the ancestral network and evolutionary network changes in the human and chimpanzee lineages. To further evaluate which evolutionary changes might be specific to the brain, we used genome-wide expression data from multiple tissues. We found increased cooperation of TFs in the human brain compared to the chimpanzee brain, but not in the other tissues. We further showed that the network of the human PFC is enriched for TFs implicated in crucial brain functions and regulates genes involved in brain development, neuronal functions, synaptic plasticity, cognition, and others. In addition to these functionally characterized TFs, we suggest that at least some of the other TFs with prominent positions in the human PFC network or drastically changed connections are very good candidates for being also involved in human-specific functions of the PFC.
Materials and Methods
Data Sets
Raw RNA-Seq, Tag-Seq, and microarray data were downloaded from Gene Omibus Database (http://www.ncbi.nlm.nih.gov/geo/). For the differential expression profiling, we used Tag-Seq data of the PFC of 5 adult human, chimpanzee, and rhesus macaque individuals (GSE50782). For the correlation and network analyses, we used a microarray data set of PFC samples from which we selected 12 individuals for each species with different ages (GSE22521) (Somel et al. 2011) (supplementary table S8, Supplementary Material online). For a comparable age collection, we implemented a linear model using the specific life traits of each species such as sexual maturity, first reproduction, age at gestation, litter per year, weaning, and maximum life expectancy (Somel et al. 2011). We used a second data set to confirm network patterns: an RNA-Seq data set comprising multiple tissues of six adult human, chimpanzee, and rhesus macaque individuals (GSE49379) (Bozek et al. 2014).
Expression Profiling
RNA-Seq and microarrays were analyzed using the R programming language and Bioconductor packages. RNA-Seq reads were aligned to primate genomes (hg19, panTro3, rheMac3) using segemehl (Hoffmann et al. 2009). Unmapped and multi-mapped reads were further removed. Counts and Reads Per Kilobase of transcript, per Million mapped reads were calculated using GenomicRanges and biomaRt implemented on R (Durinck et al. 2005; Lawrence et al. 2013). LiftOver tool where implemented to translate the non-human primates coordinates into hg19 coordinates (Hinrichs et al. 2016). We retained expressed genes with RPKM > 0.5 in at least one species. Only orthologous genes were used and human gene names were selected for further analysis. Differential expression was calculated using the DESeq package (Anders and Huber 2012). Genes were defined as differentially expressed between species if having |log2FC| > 0.3 and False Discovery Rate < 0.05. For the microarray data set, we first analyzed the RNA-degradation patterns with the Affy package in R (Gautier et al. 2004). We identified no significant differences between the human, chimpanzee, and rhesus macaque samples. We next performed a computational mask procedure using the maskBAD package (http://bioinf.eva.mpg.de/masking/) (Dannemann et al. 2009). This removed probes with binding affinity differences between species. For further analysis, we only considered the probe sets with more than four probes left after masking. We determined gene expression levels (Robust MultiArray Average values) and MAS5 detection P value from the remaining probes using the “affy” package (Gautier et al. 2004). We considered only the probesets significantly detected in at least one individual (P < 0.05). Furthermore, for genes represented by more than one expressed probeset, we calculated the mean of the expression values of all its probesets.
Gene Sets
The list of all TFs was taken from TFcheckpoint (Chawla et al. 2013) in which they selected and manually curated genes coding for TFs in the human genome. For our analysis, we only included TFs with orthologs expressed in all three species. The “Brain TF” gene set was manually curated from different and independent sources, databases, and studies (Polymeropoulos 2000; Inlow and Restifo 2004; Greydanus and Pratt 2005; Hamosh et al. 2005; Buxhoeveden et al. 2006; Ropers 2008; Bertram 2009; Banerjee-Basu and Packer 2010; Jia et al. 2010; Kaufman et al. 2010; Darnell et al. 2011; van Bokhoven 2011; Voineagu et al. 2011; Iossifov et al. 2012; Lill et al. 2012; Parikshak et al. 2013; Schizophrenia Working Group of the Psychiatric Genomics Consortium 2014) and contains candidates of genes coding for TFs implicated with brain development, neurogenesis, and brain disorders (Berto et al. 2016). We required a positive signal from more than 2 GWAS studies for Alzheimer’s disease, Parkinson’s disease, and Schizophrenia (Bertram et al. 2007; Allen et al. 2008; Lill et al. 2012). The Autism gene set was downloaded from SFARI (Banerjee-Basu and Packer 2010).
Enrichment of cis-Regulatory Elements
Human PFC H3K27ac peaksets where downloaded from GSE67978. Genome coordinates were translated from hg38 to hg19 using liftOver (Hinrichs et al. 2016). A consensus peakset was calculated using bedtools (Quinlan and Hall 2010), retaining only peaks present in all the three replicates. Peak annotation was performed using HOMER (Heinz et al. 2010), resulting in 5,967 putative CREs located near genes. TF annotation and enrichment was performed using Enrich (Chen et al. 2013).
Correlation Analysis
We performed Spearman rank correlations between the expression values of each expression-changed TF and all expressed genes. To derive the wTO networks incorporating all significantly (P < 0.05) correlated genes, we calculated the wTO values as previously described (Nowick et al. 2009; Berto et al. 2016). Briefly, we calculated a wTO matrix starting from the adjacency matrix A = [], with = ϵ [−1, 1] or = 0 if i = j, where i and j represent the differentially expressed TFs. In contrast with method previously described (Zhang and Horvath 2005), our method incorporates the correlations of two TFs associated gene sets denoted as u. Our approach further considers positive and negative correlations as following: ϵ [−1, 1] when ≥ 0 ≥ 0 for all u and ϵ [−1, 1] when ≤ 0 ≤ 0 for all u. Inserting the weighted connectivity of a node i as , the wTO () is calculated as:
Network Robustness Tests
To test the robustness of the networks, we performed two different methods: Firstly, we performed a permutation test shuffling 1,000 times the expression values of all expressed genes for each individual. We then calculated the wTO values with these randomized expression values. The randomized networks showed fewer links and high structural differences compared with the empirical networks of all species for all tested cutoffs |wTO|= [0.2.0.6], resulting in a P value of 0.001. None of the randomized networks displayed edges with |wTO| > 0.4. Therefore, we chose |wTO| > 0.4 as cutoff for the network comparisons.
Robustness of the networks was examined through permutation and leave-one-out methods (|wTO| > 0.4; permutation test, P value < 0.001; supplementary fig. S3, Methods, Supplementary Material online). For the EC-sub-network, we also performed permutation tests by randomizing the expression values of all expressed genes 1,000 times. Also here, the structures of the randomized networks were considerably different from the empirical network for all tested cutoffs |wTO|= [0.2.0.6]. Since none of the 1,000 shuffled networks presented wTO values higher than 0.3 (P < 0.001), we chose |wTO| > 0.3 as cutoff for the EC-sub-networks. To test if the high number of species-specific links could be an artifact of particular individuals, we recalculated the networks using the “leave-one-out” method. This resulted in 12 networks per species constructed from 11 individuals each. All these networks clustered according to species, demonstrating that the strong divergence in network links between species is robust (supplementary figs. S7 and S8, Supplementary Material online).
Additional TF Enrichment
We performed the TF motif enrichment using the Jaspar and TRANSFAC databases (Matys et al. 2003; Mathelier et al. 2014). We compared the 5 kb upstream promoter regions to three different background data sets: 5 and 2 kb promoter regions of all human genes and human CpG islands. To perform the motif enrichment, we used the MEME suite (Bailey et al. 2009).
Other Statistics
To test for enrichment of “Brain-TFs” in the EC-sub-networks, P values were calculated with one-sided Fisher’s exact tests (confidence level = 0.99, simulated P value with 1,000 replicates). A one-sided Wilcoxon ranked test was implemented to evaluate the difference of the network connectivity between human compared with non-human primates (alternative = “g,” confidence level = 0.99, paired = FALSE). P values for the overlaps of differentially expressed TFs between data sets (Somel et al. 2011; Liu et al. 2012) and for differentially expressed TFs with “Brain-TFs” were calculated with the hypergeometric test. In each case we used an independent background for population size based on genes expressed in the human, BrainSpan data set (15,585 genes; Parikshak et al. 2013). Two-way permutation tests of 10,000 were employed to validate the overlaps. First we randomized the external gene sets (e.g. human-specifically changed genes) by randomly selecting the same number of genes from an independent brain expressed genes list (BrainSpan gene set = 15,585 genes) and subsequently calculating the overlap P values with the TF gene set. The second approach randomized the internal gene sets (e.g. TF gene set) by randomly selecting the same number as TFs detected from the expressed genes and subsequently calculating the overlap P values. Moreover, we used a permutation test to evaluate the detected differentially expressed genes, randomizing 1,000 times the RNA-seq data and recalculating the differentially expressed genes detecting that none of the permuted data showed the same number of differentially expressed genes.
Network Visualization and Analysis
Cytoscape v3.3.0 (Shannon et al. 2003) was used for the network visualizations and statistics (e.g. betweenness centrality, degree, and topology).
Interactive Networks and Input Tables
Using D3.js, we developed a method to visualize the wTO networks and associated conservation or specificities of the links per each lineage. The interactive networks are associated with the manuscript as additional files and can be downloaded here: http://www.nowick-lab.info/? page_id=470. Input tables containing TFs and their correlated genes are available upon request.
Gene Ontology Enrichment
Gene ontology (GO) enrichment was performed using FUNC (Prufer et al. 2007) and additionally confirmed with GOstat (Beissbarth and Speed 2004) and GOrilla (Eden et al. 2009). We ranked all genes based on the number of TFs the genes are correlated with and used the Wilcoxon ranked test implemented in FUNC for testing for enrichment of GO groups. We report GO groups with enrichment P values < 0.05 before and after refinement.
Results
TFs with Known Functions in the Brain are Enriched among Human-Specifically Changed TFs in the PFC
To identify species-specific expression patterns we analyzed genome-wide expression data, derived from PFC samples of 5 adult human, chimpanzee, and rhesus macaque individuals (see Materials and Methods section). Genes were defined as species-specifically changed if their difference in expression was significant (DESeq, FDR < 0.05, |log2 fold change| > 0.3) in one species compared to the other two species, but not significant between the other two species (fig. 1; supplementary table S1, Supplementary Material online). Among the genes with species-specific expression changes, we found 645 genes coding for TFs, consisting of 103 human-specifically changed TFs, 80 chimpanzee-specifically changed TFs, and 462 rhesus macaque-specifically changed TFs. This represents a significant enrichment of TFs among differentially expressed genes (8%, chi-square test, P = 0.02).
Fig. 1.

—Methodological workflow for calculating wTO networks. (A) Schematic of analytical workflow: data set comprising PFC samples of adult individuals per each species has been used to identify the species-specifically differentially expressed genes and TFs. Differentially expressed TFs and Genes were used for calculating two types of networks, (B) for inferring network evolution and (C) species-specifically changed EC-sub-networks, using a stringent criteria for correlation and nominal P value cutoffs. (B) Network evolution: We calculated Spearman rank correlations for each of the TFs with species-specific expression with all expressed genes. Correlated genes were filtered according to the criteria shown in red in each box, whereby pval stands for the P value of the correlation and rho for the correlation strength, which needed to have the same sign (positive or negative) in the species to inferred that a link was present in the networks of the ancestors of these species. We then calculated a wTO network from all genes that passed the respective filtering criteria for humans, chimpanzees, rhesus macaques, the HC-, and the HCR macaque-ancestor. A comparison of these five networks allowed us to investigate the evolution of network links. (C) Species-specific EC-sub-networks: For the species-specific EC-sub-networks we only considered TFs that were changed in expression in the respective species. Their correlated genes (Spearman rank correlation, P<0.05) were filtered for also being species-specifically expressed in the same species and for displaying an expression change that is in the direction that is in agreement with the direction of the expression change of the TF and the sign of the correlation to that TF (see text). In blue, species-specifically upregulated TFs and correlated genes; in orange, species-specifically downregulated TFs and correlated genes. The wTO of the species-specific sub-networks were calculated from the genes that passed this filter.
Due to its distant evolutionary relationship with great apes, we found the highest number of specifically changed genes in rhesus macaques. However, when we normalized the number of species-specific expression changes for divergence time, we found about equal numbers of changes in all three lineages (e.g. number of TF/divergence time in million years between species and common ancestor = H: 103/6 = 17.2; C: 80/6 = 13.5, R: 462/25 = 18.5), suggesting that overall gene expression changes are similar between lineages.
We validated the species-specific expression changes with data of an independent primate comparative study of the frontal lobe (Konopka et al. 2012), and observed significant overlap of species-specific differential expression (human-specific: P = 0.04; chimpanzee-specific: P = 0.02; rhesus macaque-specific: P = 0.001; hypergeometric test followed by permutation test, P < 0.0001). In addition, human-specifically changed genes are also over-represented among the genes with human-specific PFC expression detected in a study that used multiple different brain regions (Sousa et al. 2017) (P = 2.40e−06; hypergeometric test followed by permutation test, P < 0.0001), supporting our findings.
To conjecture potential impacts of the species-specific TF expression changes on species differences in brain functions, we first asked how many of the changed TFs are known to have a role in the brain. Our literature review discovered 134 changed TFs that are described to have a function during brain development or are implicated in a brain disease (Berto et al. 2016) (we will refer to them here in short as “Brain-TFs”; see Materials and Methods section). “Brain-TFs” are specifically overrepresented among human-specifically changed TFs (27 out of 103; Fisher’s exact test, P = 0.028) but not in chimpanzee (14 out of 80; Fisher’s exact test, P = 0.62) and rhesus macaque (93 out of 462; Fisher’s exact test, P = 0.15). Among these human-specifically changed “Brain-TFs” (fig. 2), are for example CLOCK, a circadian regulator involved in cognitive disorders (Vitaterna et al. 1994; Gekakis et al. 1998; Menet and Rosbash 2011; Fontenot et al. 2017) and a hub in a human-specific PFC co-expression module (Konopka et al. 2012); CC2D1A, which is implicated in non-syndromic mental retardation (Basel-Vanagaite et al. 2006; Rogaeva et al. 2007) with human-specific expression (Konopka et al. 2012); NR1D1, involved in brain development and autism (Goto et al. 2017); and EGR1, a gene implicated in brain plasticity, cognitive disorders, and social behavior (Robinson et al. 2008; Duclot and Kabbaj 2017).
Fig. 2.

—Human-specific differential expression. Expression patterns of human-specifically changed “Brain TFs,” that is, TFs that are known to be involved in brain functions and disorders are displayed. Shown are Z-scores. Red = high expression, blue = low expression in human PFC.
Species-Specific Changes in TF Networks
Only about 200 TFs are functionally characterized (Matys et al. 2003; Wang et al. 2013; Mathelier et al. 2014). Accordingly, the functions of many of the TFs with species-specific expression change are currently unknown (Encode Project Consortium 2004; Wang et al. 2013; Mathelier et al. 2014). Thus, we analyzed co-expression patterns of TFs to gain more insight into the functions of the species-specifically changed TFs and into the potential phenotypic impact of their expression changes. Further, since TFs with similar sets of co-expressed genes are likely functionally related, we aimed at capturing the co-expression patterns of the changed TFs and their similarities using a network approach. To not bias this analysis by the expression patterns that exist in the data sets we used for discovering differentially expressed genes, we utilized another independently derived data set for our network analyses (Somel et al. 2011). From this data set, we selected 12 age-matched individuals per species (see Materials and Methods section). We compared these TF networks between the three species aiming to answer two main questions: 1) How did the TF network evolve? 2) What underlies species-specific expression changes?
Connectivity of the TF Network Increased in the Human Brain
To answer the first question, we first identified for each of the species-specifically expressed TFs the genes with correlated expression patterns across the individuals of a species (fig. 1). Since TFs can activate or repress the expression of genes, we calculated positive and negative correlations. To analyze the overlap in the correlated gene sets between the TFs, we calculated the wTO using a method we developed previously that considers both, positive and negative correlations (Nowick et al. 2009). This allowed us constructing a wTO network for each species in which the nodes represent the TFs and the links the correlations between the TFs including the commonality of the TFs in their sets of correlated genes. From a biological perspective, TFs that are linked in the wTO network might cooperatively regulate a significant set of potential target genes.
We inferred the human-chimpanzee (HC) and the human-chimpanzee-rhesus (HCR) macaque ancestral networks based on correlations that are present in humans and chimpanzees or in all three species, respectively (fig. 1B). Using the rhesus macaque as outgroup, we further determined the network links that are likely specific to either the human or chimpanzee network (fig. 3). Only 531 links are shared between the three species (HCR ancestor) and 239 links between humans and chimpanzees (HC ancestor). In contrast, the human network contains 2,238, the chimpanzee network 1,113, and the rhesus macaque network 389 specific links (supplementary table S2, Supplementary Material online). Robustness and correlation Quality Control were tested by investigating different wTO cutoffs and using a “leave-one-out” test (supplementary methods, Supplementary Material online). In addition, to rule out the possibility that the differences in the number of links is driven by a general species difference in the number of correlations across all genes (e.g. caused by biological or technical differences), we compared the correlation distributions of all genes after P value cutoff (supplementary fig. S1, Supplementary Material online). All three species showed similar patterns of that distribution, suggesting that the species difference in connectivity is due to the number of genes correlated with TFs rather than an overall difference in correlations.
Fig. 3.

—Ancestral and species-specific links in the TF wTO network of the PFC. In light blue are links common to the human, chimpanzee, and rhesus macaque network; in purple are links common to the human and chimpanzee network; in green are rhesus macaque-specific links; in red are chimpanzee-specific links; and in blue are human-specific links. Highlighted are the hubs of each network. Note that we cannot predict links that have been lost during evolution.
The human network has significantly higher connectivity (number of links per nodes; c = 13.2; |wTO| > 0.4) than the chimpanzee network (c = 8.1, |wTO| > 0.4; Wilcoxon test, P value = 2.47 × 10⁻¹⁰) and the rhesus macaque network (c = 3.9, |wTO| > 0.4; Wilcoxon test, P value = 2.2 × 10⁻¹⁶). Higher connectivity points to an increased cooperation or coordination of TFs in the human compared to the chimpanzee and rhesus macaque brain. Taken together, this indicates that the network complexity increased on the human lineage.
Our data further allow us to follow how the network architecture has been changed during evolution. While, for example, BBX (fig. 4A), FOXG1, RAB37, ZMAT3, and ZNF436 are hubs in almost all networks, STAT6, is only a hub in the human, chimpanzee, and HC ancestor network, suggesting that it derived this status on the lineage to great apes. Several hubs are human-specific, that is, possess a relatively large number of human-specific links, such as CC2D1A (fig. 4B), GLIS3, KLF5, MEF2D, and ZNF286A. We invite the reader to further explore our interactive network visualization (supplementary data 1, Supplementary Material online) to discover more details about changes in this network during evolution.
Fig. 4.
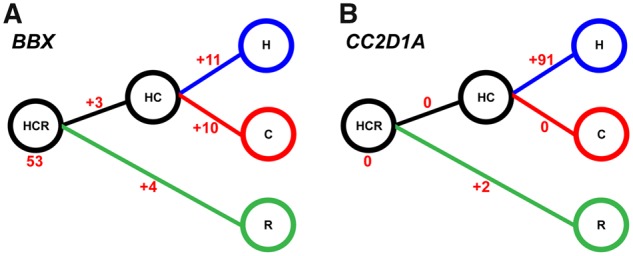
—Gain and loss of links during primate evolution. Shown are (A) BBX, as an example for a TF with relatively little changes in connectivity, and (B) CC2D1A, as an example for a TF with gain of many human-specific links. Numbers represent how many links were gained on each lineage.
Having found an increased connectivity between TFs in the human network, we asked whether this increase can also be found in other brain areas or in other tissues (Bozek et al. 2014). Networks clustered well by tissue (fig. 5A). We found a higher extent of connectivity changes in human brain regions compared with the non-human primates (fig. 5B). Human networks of all examined brain areas (PFC, cerebellum, and visual cortex) were characterized by higher connectivity compared to chimpanzee networks. However, we did not observe an increase in connectivity in the examined other tissues, muscle, and kidney (fig. 5C;supplementary table S3, Supplementary Material online).
Fig. 5.

—Species network differences in multiple tissues. (A) Multidimensional scaling plot representing the Euclidean distances between the wTO networks calculated based on all wTO values of each network. In red, the PFC samples of Bozek et al. (2014) (adPFC); in green, the visual cortec (VIS) samples of Bozek et al. (2014); in blue, the cerebellum (CBC) samples of Bozek et al. (2014); in black, the PFC; in brown, the kidney (KD) samples of Bozek et al. (2014); in pink, the muscle (MSC) samples of Bozek et al. (2014). The networks of the rhesus macaque PFC and CBC are the most different ones. (B) Change in connectivity per million years of all TF wTO networks. lsPFC refers to the data set from Somel et al. (2011), while adPFC represents the Bozek et al. (2014) data set. Human networks have a higher number of changes compared with the other primates in brain regions. (C) One-sided Wilcoxon signed rank test comparing connectivity between human and non-human primates. Humans showed a greater connectivity compared with chimpanzee and rhesus macaques in all brain regions whereas not in kidney and muscle.
Human-Specific Expression Changes are Associated with Higher TF Cooperation
While all TFs in the presented networks have changed in expression, it does not mean that the genes correlated with these TFs have also changed in expression. In fact, many of the lineage-specific network changes could have evolved to compensate for other mutations to keep the expression of the associated genes conserved. Since the genes with species-specific expression changes are most likely the ones that drive phenotypic differences between the three species, we determined next which TF correlated genes have species-specifically changed in expression.
To this end, we filtered all TF correlated genes requiring that their expression change in the PFC is consistent with the expression change of the TF in the PFC (supplementary methods, Supplementary Material online; fig. 1C). We then constructed another TF wTO network for each species. In contrast to the networks above, these TF wTO networks contain only the TFs specifically changed in expression in that species, which implies that the node sets do not overlap between the networks of the three species. Further, the wTO is only measured from correlated genes with species-specific expression changes in the respective species. Despite the conceptual difference between the two types of networks, the node set of the second type is a subset of the first type. The link set of the second network type is not an exact subset of the first network type, but wTO values correlate between the networks (Pearson correlation, r = 0.13, P < 2.2 × 10⁻¹⁶). We thus call the second type of networks species-specific expression-changed networks (EC-sub-networks), albeit they are not strict sub-networks of the first ones.
The EC-sub-networks are densely connected with high clustering coefficients (human C = 0.784 and chimpanzee C = 0.745, Bozek et al. 2014: human C = 0.687 and chimpanzee C = 0.641; supplementary fig. S2, Supplementary Material online) and show a bi-modular organization (fig. 6). The human EC-sub-network has significantly higher connectivity than the chimpanzee EC-sub-network (human c = 7.8, chimpanzee c = 3.4, Wilcoxon test, P = 4.85 × 10−05). Consistently with this result, we also found higher connectivity in the EC-sub networks derived from the PFC samples of Bozek et al. (2014) (human c = 15.7, chimpanzee c = 6.8, Wilcoxon test, P = 3.3 × 10−09) and significant overlap with the links determined with the Bozek et al. (2014) data set (human: hypergeometric test, P = 4.78e−29, chimpanzee: hypergeometric test, P = 2.00e−05; supplementary figs. S3 and S4, Supplementary Material online). Taken together, this indicates that human-specific expression changes in the PFC are, at least in part, driven by a particular set of TFs with human-specific expression levels in the PFC and higher cooperativity among them.
Fig. 6.

—Species-specific EC-sub networks. On the top part, the PFC from Bozek et al. (2014) (adPFC) EC-sub-networks and on the bottom, the PFC (adPFC) EC-sub-networks. (A) Human EC-sub-networks. (B) Chimpanzee EC-sub-networks. In blue, the up-regulated TFs are shown. In orange, the down-regulated TFs are shown. TFs with expression changes into the same direction are connected by a blue link whereas TFs with expression changes into opposite directions by an orange link. The size of the nodes is proportional to the number of links the node has.
Binding Sites and Enhancers
Several of the links between TFs, we discovered in the human PFC network had already been discovered experimentally, such as the interactions between MEF2C and HIRA (Yang et al. 2011), MEF2C and HDAC9 (Haberland et al. 2007; Potthoff and Olson 2007) and MEF2D and SP1 (Park et al. 2002), supporting the validity of our network inferences.
To provide further support for our network inferences, we tested for enrichment of TF binding sites in the promoters of genes that are correlated with the respective TF and have changed in expression (see Materials and Methods section). For instance, for the genes contributing to the human EC-sub-network we found enrichment for binding sites of several human-specifically changed TFs (e.g. CLOCK, EGR1, HNF4A, LMO2, PRDM14, and SMAD2), lending support for the biological relevance of the inferred EC-sub-networks.
In addition, we evaluated the relationship between genes contributing to the EC-sub-networks and cis-regulatory elements (CREs) regulated by H3K27ac in the human brain (Vermunt et al. 2016) (see Materials and Methods section). We detected a significant overlap between such CREs and genes of the human EC-sub-network (161 of 470, P = 0.02, hypergeometric test), and confirmed this significant overlap also with the EC-sub-network derived from the Bozek et al. (2014) data set (195 of 529, P = 3 × 10⁻⁴, hypergeometric test). For 15 TFs of the human EC-sub-network exists direct evidence of binding sites (Lambert et al. 2018). To refine the CRE enrichment, we next tested whether binding sites for these TFs are within the CREs near genes of the human EC-sub-networks. For EGR1, CLOCK, KLF8, and SP4 we detected significant enrichment of their binding sites (see Materials and Methods section). These results reflect that genes in the human EC-sub-networks are associated with active enhancers that are potentially bound and regulated by TFs of the human-specific EC-sub-network.
Human-Specific Network Changes Seem to be Related to Cognitive Functions
To gain insights into the TF network functions, we tested for enrichment of GO groups among the genes correlated with the TFs (see Materials and Methods section). The wTO networks of all three species, as well as the putative ancestral networks of humans and chimpanzees and of all three species are enriched for axonogenesis, synaptic transmission, learning and memory, and other brain functions (supplementary table S4 and fig. S5, Supplementary Material online). This suggests that, although species-specific links exist, overall the functions and pathways regulated by the TFs in the PFC are conserved. Still, the strongest enrichment for brain function related GO groups was for networks of the human PFC, while that enrichment was lower in the chimpanzee and rhesus macaque PFC and in the other brain areas and tissues, indicating that human-specific links are involved in regulating functions important for brain development and cognition.
To further test this possibility, we asked which functional groups are over-represented among the genes of the EC-sub-networks. The human EC-sub-networks are enriched for genes involved in axon guidance, myelination, and cell differentiation. Such functions are not over-represented in the chimpanzee EC-sub-networks (supplementary table S5, Supplementary Material online). This is remarkable given that very similar GO groups have been enriched in the chimpanzee and ancestral networks built from all correlated genes. While the overall function of the PFC network seems to be conserved since the HCR ancestor, TF genes with human-specific expression changes seem to particularly affect the expression of genes involved in certain brain processes such as axon guidance, myelination, and cell differentiation.
Indeed, “Brain TFs” had more links than other TFs in the human PFC (Wilcoxon test, P = 0.035; Bozek et al. 2014: Wilcox test, P = 0.006) compared with chimpanzee PFC (Wilcoxon test, P = 0.65; Bozek et al. 2014: Wilcox test, P = 0.53). Additionally, brain-TFs have more links in the human PFC compared with the chimpanzee PFC (Wilcoxon test, P = 0.08; Bozek et al. 2014: Wilcoxon test, P = 1.04 × 10−05), suggesting a more central role for those “Brain-TFs” in the human PFC network (supplementary fig. S6, Supplementary Material online). Examples of hubs in the human EC-sub-networks are the aforementioned CC2D1A, and ZNF24 and ZNF536, two zinc finger genes implicated in maintenance of neural progenitor cells (Khalfallah et al. 2009) and neuronal differentiation (Qin et al. 2009), respectively (supplementary table S5, Supplementary Material online). Besides hubs, nodes with high betweenness centrality are also important for networks. Such nodes typically have the highest number of shortest paths passing through them, making them in modular networks the nodes that are connecting the modules. Examples of TFs with high betweenness centrality scores in the human PFC networks are BBX, ZIC1, ZNF24, and ZNF331 (supplementary table S6, Supplementary Material online), of which ZIC1 is a Brain-TF.
To further evaluate the association of EC-sub-networks with brain functions, we used cell-type markers from single-cell RNA-Seq (sc-RNA) (Zhang et al. 2014). Genes of the human EC-sub-networks are significantly enriched for genes expressed in myelinating oligodendrocytes (Fisher’s exact test, P = 0.0008; Bozek et al (2014):, Fisher’s exact test, P = 0.003; Benjamini-Hochberg adjusted). In contrast, genes of the chimpanzee EC-sub-networks did not show any significant enrichment in any cell-type. We further confirmed the enrichment for cortical oligodendrocytes expressed genes in the human EC-sub networks with CSEA (Xu et al. 2014). Taken together, these data support the notion that the network with genes with human-specific expression changes is involved in myelination.
Because the EC-sub-networks are bi-modular, we also tested for GO enrichment among the genes of each module (see Materials and Methods section). While the chimpanzee modules did not show any significant enrichment, one human modules was enriched for genes involved in cellular differentiation and morphogenesis and the other one for axon guidance, synaptic plasticity, learning and memory, cognition, and brain development (supplementary table S7, Supplementary Material online).
Discussion
While a few studies have already analyzed co-expression networks in primate brains (Oldham et al. 2006; Konopka et al. 2012; Sousa et al. 2017), we particularly focused here on the evolution of TF species-specific networks in PFC. We found that TFs with a known function in the brain are enriched among the TFs with human-specific differential expression in the PFC. Using our system-level network approach, we determined potential interactions and target genes of all TFs with species-specific expression changes. We represent them in two types of networks. The first network type allowed us to directly compare links between all species and to inferred the ancestral HC and HCR networks as well as species-specific network features. The second type of networks are built only from TFs and other genes with species-specific expression changes. These networks enabled us to investigate TF interactions that might be responsible for driving lineage-specific changes in expression patterns. Higher connectivity in humans was observed with both types of networks, suggesting that cooperativity between TFs is stronger in the human brain. We further showed that this increase in connectivity is specific to the brain, while it was not observed in the investigated non-brain tissues. Similar GO groups have been found to be enriched among genes of all PFC networks; however, functions related to brain development and cognition were most pronounced in the human networks, and “Brain-TFs” were only enriched in the human EC-sub-networks. Our findings provide context to previous observation that gene co-expression might have undergone strong evolutionary remodeling in primates and point out not only TFs that had already previously been linked with human-specific networks but also novel candidates for human brain evolution and cognitive uniqueness.
Our findings provide context to previous observations of increased network connectivity in the human compared to non-human primates (Konopka et al. 2012). In our results, higher connectivity between TFs means that the TFs overlap more strongly in their potential target genes and interaction partners. Such higher connectivity can be interpreted as an increase in the complexity of gene regulatory mechanisms in the human brain. The fact that these two different methods applied to different data sets both found higher connectivity in the human PFC compared to other primates strongly supports the idea that the transcriptional landscape in human has undergone marked rewiring during evolution. This connectivity increase might not be restricted to the PFC, as we have observed it also in other brain areas, albeit not in other tissues. However, at date, accessibility to non-human primates tissues and sample size are limiting factors. Future studies that assess TF networks in different human brain regions compared with non-human primates should address these possibilities.
Our method allowed us to directly compare the network links between species, inferring ancestral networks, and the species-specific gain/loss of TF connections. For example, CC2D1A, a gene implicated in non-syndromic mental retardation (Basel-Vanagaite et al. 2006; Rogaeva et al. 2007), has gained 91 human-specific links. Loss of CC2D1A reduces dendritic complexity and regulates NF-kB signaling pathways implicated in neuronal morphology (Manzini et al. 2014). Therefore, the increased connectivity of CC2D1A might underline a more complex transcriptional regulation in the human lineage compared with non-human primates. We therefore hypothesized that CC2D1A might have had an important role during the evolution of the human PFC transcriptional landscape.
Despite the evolutionary differences, the ancestral as well as the species-specific TF networks are predicted to regulate the expression of similar sets of genes involved in axonogenesis, synaptic transmission, learning, and memory. This indicates that overall the functional output of the network is conserved. Our finding agrees with the hypothesis that many new network links can arise non-adaptively and can be added to or deleted from the network without changing its function (Sorrells and Johnson 2015).
An alternative explanation is that some of the rewiring we observed might compensate for other mutations during primate evolution to overall keep expression of genes in the brain conserved. This implies that in part some molecular pathways are regulated differentially across different primate species.
This prompted us to specifically investigate which TF changes might be related to expression changes of their potential target genes, reasoning that such changes should be more relevant for changing phenotypes. With this assumption in mind we calculated EC-sub-networks consisting of only the TFs and their potential targets that show species-specific expression patterns. These EC-sub-networks show an organization in two modules, with the human networks having higher connectivity than the chimpanzee networks. This data emphasize the complexity of the transcriptional regulation, often represented by modules of TFs that bind cooperatively or competitively promoter regions of target genes (Berman et al. 2002; Nowick et al. 2009). Interestingly, many hubs in the human EC-sub-network are “Brain-TFs.” Genes potentially regulated by TFs in the human EC-sub-network are enriched for axon guidance, myelination, and cell differentiation. Furthermore, genes that are specifically correlated in human but not in chimpanzee brains are significantly enriched for genes expressed in myelinating oligodendrocytes. This result is intriguing since the evolutionary dynamic of the human brain and cognitive enhancement are subjected to prolonged myelination when compared with close relatives such as chimpanzees (Roth and Dicke 2005; Miller et al. 2012). One of the modules of the human EC-sub-network, which includes for instance BBX, CLOCK, and ZNF24 as hubs, is linked to functions such as cellular proliferation and migration, implicating TFs in proliferative function in the human brain. The other module of the human EC-sub-network, with for instance CC2D1A, HOXD1, and KCNH3 as hubs, was strongly and specifically enriched for GO groups associated with synaptic plasticity, learning and memory, and cognition making that module an excellent candidate for setting the stage for the evolution of human-specific cognitive abilities.
Despite the fact that the samples we analyzed are bulk RNA-Seq from brain tissue, this allowed us to highlight genes that represent potential target genes or interaction partners of these TFs by co-expression. In fact, our results suggest that a network of TFs that regulates genes involved in brain development and cognitive processes has changed during primate evolution. Our work not only highlights the complexity of transcriptional networks in human brain regions with a focus on the PFC but also adds to previous findings on human-specific morphological changes in the PFC (Rilling et al. 2008; Semendeferi et al. 2011) and human-specific gene expression changes in the PFC (Somel et al. 2009; Babbitt et al. 2010; Konopka et al. 2012; Liu et al. 2012; Sousa et al. 2017; Xu et al. 2018), by suggesting candidate TFs and interactions that might drive these human-specific changes. In this respect our study points to TFs that should be further investigated in the future for understanding the evolution of the human brain.
Moreover, our observation of enrichment for and higher connectivity of “Brain TFs” specifically in the human PFC network, suggests that human-specific changes in expression and network integration of some “Brain-TFs” might in part be associated with the evolution of human-specific cognitive abilities. Interestingly, among the most highly connected TFs in the human EC-sub-network are TFs that have been implicated in cognitive disorders. It is possible that these TFs became risk genes for brain disorders, because they moved into such central position in the human network.
We yet have to better understand the complexity of gene regulatory networks and their phenotypic consequences, but the TF network changes we identified here might have changed the expression of genes that are involved in determining human-specific traits, such as bigger brain size, particular cognitive abilities, behavior, and brain disorders.
Supplementary Material
Acknowledgments
We thank Micheal Danneman for helping us to implement the mask procedure. We also thank Eivind Almaas and Daniel Gerighausen for implementing the wTO analysis and Sandra Gerstl for performing the leave-one-out analysis. We furthermore thank Jan Aerts for the visualization of network evolution. We finally thank Peter F. Stadler, Konstantin Klemm, and Jing Qin for their discussions and reviews. This work was supported by the Volkswagen Foundation within the initiative “Evolutionary Biology” (awarded to K.N.).
Literature Cited
- Allen NC, et al. 2008. Systematic meta-analyses and field synopsis of genetic association studies in schizophrenia: the SzGene database. Nat Genet. 40(7):827–834. [DOI] [PubMed] [Google Scholar]
- Anders S, Huber W.. 2012. Differential expression of RNA-Seq data at the gene level–the DESeq package. Heidelberg (Germany): European Molecular Biology Laboratory (EMBL). [Google Scholar]
- Babbitt CC, et al. 2010. Both noncoding and protein-coding RNAs contribute to gene expression evolution in the primate brain. Genome Biol Evol. 2:67–79. [DOI] [PMC free article] [PubMed] [Google Scholar]
- Bailey TL, et al. 2009. MEME SUITE: tools for motif discovery and searching. Nucleic Acids Res. 37(Web Server issue):W202–W208. [DOI] [PMC free article] [PubMed] [Google Scholar]
- Ballester B, et al. 2014. Multi-species, multi-transcription factor binding highlights conserved control of tissue-specific biological pathways. eLife 3:e02626.. [DOI] [PMC free article] [PubMed] [Google Scholar]
- Banerjee-Basu S, Packer A.. 2010. SFARI Gene: an evolving database for the autism research community. Dis Model Mech. 3(3-4):133–135. [DOI] [PubMed] [Google Scholar]
- Basel-Vanagaite L, et al. 2006. The CC2D1A, a member of a new gene family with C2 domains, is involved in autosomal recessive non-syndromic mental retardation. J Med Genet. 43(3):203–210. [DOI] [PMC free article] [PubMed] [Google Scholar]
- Beissbarth T, Speed TP.. 2004. GOstat: find statistically overrepresented Gene Ontologies within a group of genes. Bioinformatics 20(9):1464–1465. [DOI] [PubMed] [Google Scholar]
- Berman BP, et al. 2002. Exploiting transcription factor binding site clustering to identify cis-regulatory modules involved in pattern formation in the Drosophila genome. Proc Natl Acad Sci USA. 99(2):757–762. [DOI] [PMC free article] [PubMed] [Google Scholar]
- Berto S, Perdomo-Sabogal A, Gerighausen D, Qin J, Nowick K.. 2016. A consensus network of gene regulatory factors in the human frontal lobe. Front Genet. 7:31.. [DOI] [PMC free article] [PubMed] [Google Scholar]
- Bertram L. 2009. Alzheimer’s disease genetics current status and future perspectives. Int Rev Neurobiol. 84:167–184. [DOI] [PubMed] [Google Scholar]
- Bertram L, McQueen MB, Mullin K, Blacker D, Tanzi RE.. 2007. Systematic meta-analyses of Alzheimer disease genetic association studies: the AlzGene database. Nat Genet. 39(1):17–23. [DOI] [PubMed] [Google Scholar]
- Bozek K, et al. 2014. Exceptional evolutionary divergence of human muscle and brain metabolomes parallels human cognitive and physical uniqueness. PLoS Biol. 12(5):e1001871. [DOI] [PMC free article] [PubMed] [Google Scholar]
- Buxhoeveden DP, et al. 2006. Reduced minicolumns in the frontal cortex of patients with autism. Neuropathol Appl Neurobiol. 32(5):483–491. [DOI] [PubMed] [Google Scholar]
- Cáceres M, et al. 2003. Elevated gene expression levels distinguish human from non-human primate brains. Proc Natl Acad Sci USA. 100(22):13030–13035. [DOI] [PMC free article] [PubMed] [Google Scholar]
- Chawla K, Tripathi S, Thommesen L, Lægreid A, Kuiper M.. 2013. TFcheckpoint: a curated compendium of specific DNA-binding RNA polymerase II transcription factors. Bioinformatics 29(19):2519–2520. [DOI] [PubMed] [Google Scholar]
- Chen EY, et al. 2013. Enrichr: interactive and collaborative HTML5 gene list enrichment analysis tool. BMC Bioinformatics 14:128.. [DOI] [PMC free article] [PubMed] [Google Scholar]
- Dannemann M, Lorenc A, Hellmann I, Khaitovich P, Lachmann M.. 2009. The effects of probe binding affinity differences on gene expression measurements and how to deal with them. Bioinformatics 25(21):2772–2779. [DOI] [PubMed] [Google Scholar]
- Darnell JC, et al. 2011. FMRP stalls ribosomal translocation on mRNAs linked to synaptic function and autism. Cell 146(2):247–261. [DOI] [PMC free article] [PubMed] [Google Scholar]
- Donahue CJ, Glasser MF, Preuss TM, Rilling JK, Van Essen DC.. 2018. Quantitative assessment of prefrontal cortex in humans relative to nonhuman primates. Proc Natl Acad Sci USA. 115(22):E5183–E5192. [DOI] [PMC free article] [PubMed] [Google Scholar]
- Duclot F, Kabbaj M.. 2017. The role of early growth response 1 (EGR1) in brain plasticity and neuropsychiatric disorders. Front Behav Neurosci. 11:35.. [DOI] [PMC free article] [PubMed] [Google Scholar]
- Durinck S, et al. 2005. BioMart and bioconductor: a powerful link between biological databases and microarray data analysis. Bioinformatics 21(16):3439–3440. [DOI] [PubMed] [Google Scholar]
- Eden E, Navon R, Steinfeld I, Lipson D, Yakhini Z.. 2009. GOrilla: a tool for discovery and visualization of enriched GO terms in ranked gene lists. BMC Bioinformatics 10:48.. [DOI] [PMC free article] [PubMed] [Google Scholar]
- Encode Project Consortium. 2004. The ENCODE (ENCyclopedia of DNA elements) project. Science 306(5696):636–640. [DOI] [PubMed] [Google Scholar]
- Enard W. 2015. Human evolution: enhancing the brain. Curr Biol. 25(10):R421–R423. [DOI] [PubMed] [Google Scholar]
- Enard W, et al. 2002a. Intra-and interspecific variation in primate gene expression patterns. Science 296:340–343. [DOI] [PubMed] [Google Scholar]
- Enard W, et al. 2002b. Molecular evolution of FOXP2, a gene involved in speech and language. Nature 418(6900):869–872. [DOI] [PubMed] [Google Scholar]
- Fisher SE, Scharff C.. 2009. FOXP2 as a molecular window into speech and language. Trends Genet. 25(4):166–177. [DOI] [PubMed] [Google Scholar]
- Fontenot MR, et al. 2017. Novel transcriptional networks regulated by CLOCK in human neurons. Genes Dev. 31(21):2121–2135. [DOI] [PMC free article] [PubMed] [Google Scholar]
- Gautier L, Cope L, Bolstad BM, Irizarry RA.. 2004. affy–analysis of Affymetrix GeneChip data at the probe level. Bioinformatics 20(3):307–315. [DOI] [PubMed] [Google Scholar]
- Gekakis N, et al. 1998. Role of the CLOCK protein in the mammalian circadian mechanism. Science 280(5369):1564–1569. [DOI] [PubMed] [Google Scholar]
- Goto M, et al. 2017. Role of a circadian-relevant gene NR1D1 in brain development: possible involvement in the pathophysiology of autism spectrum disorders. Sci Rep. 7:43945.. [DOI] [PMC free article] [PubMed] [Google Scholar]
- Greydanus DE, Pratt HD.. 2005. Syndromes and disorders associated with mental retardation. Indian J Pediatr. 72(10):859–864. [DOI] [PubMed] [Google Scholar]
- Haberland M, et al. 2007. Regulation of HDAC9 gene expression by MEF2 establishes a negative-feedback loop in the transcriptional circuitry of muscle differentiation. Mol Cell Biol 27:518–525. [DOI] [PMC free article] [PubMed] [Google Scholar]
- Hamosh A, Scott AF, Amberger JS, Bocchini CA, McKusick VA.. 2005. Online Mendelian Inheritance in Man (OMIM), a knowledgebase of human genes and genetic disorders. Nucleic Acids Res. 33(Database issue):D514–D517. [DOI] [PMC free article] [PubMed] [Google Scholar]
- Heinz S, et al. 2010. Simple combinations of lineage-determining transcription factors prime cis-regulatory elements required for macrophage and B cell identities. Mol Cell 38(4):576–589. [DOI] [PMC free article] [PubMed] [Google Scholar]
- Hinrichs AS, et al. 2016. UCSC data integrator and variant annotation integrator. Bioinformatics 32(9):1430–1432. [DOI] [PMC free article] [PubMed] [Google Scholar]
- Hoffmann S, et al. 2009. Fast mapping of short sequences with mismatches, insertions and deletions using index structures. PLoS Comput Biol. 5(9):e1000502.. [DOI] [PMC free article] [PubMed] [Google Scholar]
- Inlow JK, Restifo LL.. 2004. Molecular and comparative genetics of mental retardation. Genetics 166(2):835–881. [DOI] [PMC free article] [PubMed] [Google Scholar]
- Iossifov I, et al. 2012. De novo gene disruptions in children on the autistic spectrum. Neuron 74(2):285–299. [DOI] [PMC free article] [PubMed] [Google Scholar]
- Jia P, Sun J, Guo A, Zhao Z.. 2010. SZGR: a comprehensive schizophrenia gene resource. Mol Psychiatry 15(5):453–462. [DOI] [PMC free article] [PubMed] [Google Scholar]
- Kaufman L, Ayub M, Vincent JB.. 2010. The genetic basis of non-syndromic intellectual disability: a review. J Neurodev Disord. 2(4):182–209. [DOI] [PMC free article] [PubMed] [Google Scholar]
- Khalfallah O, et al. 2009. Zinc finger protein 191 (ZNF191/Zfp191) is necessary to maintain neural cells as cycling progenitors. Stem Cells 27(7):1643–1653. [DOI] [PubMed] [Google Scholar]
- Koechlin E, Ody C, Kouneiher F.. 2003. The architecture of cognitive control in the human prefrontal cortex. Science 302(5648):1181–1185. [DOI] [PubMed] [Google Scholar]
- Konopka G, et al. 2009. Human-specific transcriptional regulation of CNS development genes by FOXP2. Nature 462(7270):213–217. [DOI] [PMC free article] [PubMed] [Google Scholar]
- Konopka G, et al. 2012. Human-specific transcriptional networks in the brain. Neuron 75(4):601–617. [DOI] [PMC free article] [PubMed] [Google Scholar]
- Lambert SA, et al. 2018. The human transcription factors. Cell 172(4):650–665. [DOI] [PubMed] [Google Scholar]
- Langfelder P, Horvath S.. 2008. WGCNA: an R package for weighted correlation network analysis. BMC Bioinformatics 9:559.. [DOI] [PMC free article] [PubMed] [Google Scholar]
- Lawrence M, et al. 2013. Software for computing and annotating genomic ranges. PLoS Comput Biol. 9(8):e1003118.. [DOI] [PMC free article] [PubMed] [Google Scholar]
- Lill CM, et al. 2012. Comprehensive research synopsis and systematic meta-analyses in Parkinson’s disease genetics: the PDGene database. PLoS Genet. 8(3):e1002548. [DOI] [PMC free article] [PubMed] [Google Scholar]
- Liu X, et al. 2012. Extension of cortical synaptic development distinguishes humans from chimpanzees and macaques. Genome Res. 22(4):611–622. [DOI] [PMC free article] [PubMed] [Google Scholar]
- Manzini MC, et al. 2014. CC2D1A regulates human intellectual and social function as well as NF-kappaB signaling homeostasis. Cell Rep. 8(3):647–655. [DOI] [PMC free article] [PubMed] [Google Scholar]
- Mathelier A, et al. 2014. JASPAR 2014: an extensively expanded and updated open-access database of transcription factor binding profiles. Nucleic Acids Res. 42(Database issue):D142–D147. [DOI] [PMC free article] [PubMed] [Google Scholar]
- Matys V, et al. 2003. TRANSFAC: transcriptional regulation, from patterns to profiles. Nucleic Acids Res. 31(1):374–378. [DOI] [PMC free article] [PubMed] [Google Scholar]
- Mekel-Bobrov N, et al. 2005. Ongoing adaptive evolution of ASPM, a brain size determinant in Homo sapiens. Science 309(5741):1720–1722. [DOI] [PubMed] [Google Scholar]
- Menet JS, Rosbash M.. 2011. When brain clocks lose track of time: cause or consequence of neuropsychiatric disorders. Curr Opin Neurobiol. 21(6):849–857. [DOI] [PMC free article] [PubMed] [Google Scholar]
- Miller DJ, et al. 2012. Prolonged myelination in human neocortical evolution. Proc Natl Acad Sci USA. 109(41):16480–16485. [DOI] [PMC free article] [PubMed] [Google Scholar]
- Montgomery SH, Mundy NI.. 2012. Evolution of ASPM is associated with both increases and decreases in brain size in primates. Evolution 66(3):927–932. [DOI] [PubMed] [Google Scholar]
- Nowick K, et al. 2011. Gain, loss and divergence in primate zinc-finger genes: a rich resource for evolution of gene regulatory differences between species. PLoS One 6(6):e21553.. [DOI] [PMC free article] [PubMed] [Google Scholar]
- Nowick K, Gernat T, Almaas E, Stubbs L.. 2009. Differences in human and chimpanzee gene expression patterns define an evolving network of transcription factors in brain. Proc Natl Acad Sci USA. 106(52):22358–22363. [DOI] [PMC free article] [PubMed] [Google Scholar]
- Oberheim NA, et al. 2009. Uniquely hominid features of adult human astrocytes. J Neurosci. 29(10):3276–3287. [DOI] [PMC free article] [PubMed] [Google Scholar]
- Oldham MC, Horvath S, Geschwind DH.. 2006. Conservation and evolution of gene coexpression networks in human and chimpanzee brains. Proc Natl Acad Sci USA. 103(47):17973–17978. [DOI] [PMC free article] [PubMed] [Google Scholar]
- Parikshak NN, et al. 2013. Integrative functional genomic analyses implicate specific molecular pathways and circuits in autism. Cell 155(5):1008–1021. [DOI] [PMC free article] [PubMed] [Google Scholar]
- Park SY, Shin HM, Han TH.. 2002. Synergistic interaction of MEF2D and Sp1 in activation of the CD14 promoter. Mol Immunol. 39(1-2):25–30. [DOI] [PubMed] [Google Scholar]
- Polymeropoulos MH. 2000. Genetics of Parkinson’s disease. Ann N Y Acad Sci. 920:28–32. [DOI] [PubMed] [Google Scholar]
- Ponting C, Jackson AP.. 2005. Evolution of primary microcephaly genes and the enlargement of primate brains. Curr Opin Genet Dev. 15(3):241–248. [DOI] [PubMed] [Google Scholar]
- Povinelli DJ, Preuss TM.. 1995. Theory of mind: evolutionary history of a cognitive specialization. Trends Neurosci. 18(9):418–424. [DOI] [PubMed] [Google Scholar]
- Potthoff MJ, et al. 2007. Histone deacetylase degradation and MEF2 activation promote the formation of slow-twitch myofibers. J Clin Invest 117:2459–2467. [DOI] [PMC free article] [PubMed] [Google Scholar]
- Prufer K, et al. 2007. FUNC: a package for detecting significant associations between gene sets and ontological annotations. BMC Bioinformatics 8:41. [DOI] [PMC free article] [PubMed] [Google Scholar]
- Pulvers JN, Journiac N, Arai Y, Nardelli J.. 2015. MCPH1: a window into brain development and evolution. Front Cell Neurosci. 9:92. [DOI] [PMC free article] [PubMed] [Google Scholar]
- Qin Z, et al. 2009. ZNF536, a novel zinc finger protein specifically expressed in the brain, negatively regulates neuron differentiation by repressing retinoic acid-induced gene transcription. Mol Cell Biol. 29(13):3633–3643. [DOI] [PMC free article] [PubMed] [Google Scholar]
- Quinlan AR, Hall IM.. 2010. BEDTools: a flexible suite of utilities for comparing genomic features. Bioinformatics 26(6):841–842. [DOI] [PMC free article] [PubMed] [Google Scholar]
- Rilling JK, et al. 2008. The evolution of the arcuate fasciculus revealed with comparative DTI. Nat Neurosci. 11(4):426–428. [DOI] [PubMed] [Google Scholar]
- Robinson GE, Fernald RD, Clayton DF.. 2008. Genes and social behavior. Science 322(5903):896–900. [DOI] [PMC free article] [PubMed] [Google Scholar]
- Rogaeva A, Galaraga K, Albert PR.. 2007. The Freud-1/CC2D1A family: transcriptional regulators implicated in mental retardation. J Neurosci Res. 85(13):2833–2838. [DOI] [PubMed] [Google Scholar]
- Ropers HH. 2008. Genetics of intellectual disability. Curr Opin Genet Dev. 18(3):241–250. [DOI] [PubMed] [Google Scholar]
- Roth G, Dicke U.. 2005. Evolution of the brain and intelligence. Trends Cogn Sci. 9(5):250–257. [DOI] [PubMed] [Google Scholar]
- Schizophrenia Working Group of the Psychiatric Genomics Consortium. 2014. Biological insights from 108 schizophrenia-associated genetic loci. Nature 511(7510):421–427. [DOI] [PMC free article] [PubMed] [Google Scholar]
- Schmidt D, et al. 2010. Five-vertebrate ChIP-seq reveals the evolutionary dynamics of transcription factor binding. Science 328(5981):1036–1040. [DOI] [PMC free article] [PubMed] [Google Scholar]
- Schoenemann PT, Sheehan MJ, Glotzer LD.. 2005. Prefrontal white matter volume is disproportionately larger in humans than in other primates. Nat Neurosci. 8(2):242–252. [DOI] [PubMed] [Google Scholar]
- Schwalie PC, et al. 2013. Co-binding by YY1 identifies the transcriptionally active, highly conserved set of CTCF-bound regions in primate genomes. Genome Biol. 14(12):R148.. [DOI] [PMC free article] [PubMed] [Google Scholar]
- Semendeferi K, et al. 2011. Spatial organization of neurons in the frontal pole sets humans apart from great apes. Cereb Cortex 21(7):1485–1497. [DOI] [PubMed] [Google Scholar]
- Shannon P, et al. 2003. Cytoscape: a software environment for integrated models of biomolecular interaction networks. Genome Res. 13(11):2498–2504. [DOI] [PMC free article] [PubMed] [Google Scholar]
- Sherwood CC, et al. 2006. Evolution of increased glia–neuron ratios in the human frontal cortex. Proc Natl Acad Sci USA. 103(37):13606–13611. [DOI] [PMC free article] [PubMed] [Google Scholar]
- Smaers JB, Gomez-Robles A, Parks AN, Sherwood CC.. 2017. Exceptional evolutionary expansion of prefrontal cortex in great apes and humans. Curr Biol. 27(10):1549.. [DOI] [PubMed] [Google Scholar]
- Smaers J, et al. 2011. Primate prefrontal cortex evolution: human brains are the extreme of a lateralized ape trend. Brain Behav Evol. 77(2):67.. [DOI] [PubMed] [Google Scholar]
- Somel M, et al. 2009. Transcriptional neoteny in the human brain. Proc Natl Acad Sci USA. 106(14):5743–5748. [DOI] [PMC free article] [PubMed] [Google Scholar]
- Somel M, et al. 2011. MicroRNA-driven developmental remodeling in the brain distinguishes humans from other primates. PLoS Biol. 9(12):e1001214. [DOI] [PMC free article] [PubMed] [Google Scholar]
- Sorrells TR, Johnson AD.. 2015. Making sense of transcription networks. Cell 161(4):714–723. [DOI] [PMC free article] [PubMed] [Google Scholar]
- Sousa AMM, et al. 2017. Molecular and cellular reorganization of neural circuits in the human lineage. Science 358(6366):1027–1032. [DOI] [PMC free article] [PubMed] [Google Scholar]
- Spocter MA, et al. 2012. Neuropil distribution in the cerebral cortex differs between humans and chimpanzees. J Comp Neurol. 520(13):2917–2929. [DOI] [PMC free article] [PubMed] [Google Scholar]
- van Bokhoven H. 2011. Genetic and epigenetic networks in intellectual disabilities. Annu Rev Genet. 45:81–104. [DOI] [PubMed] [Google Scholar]
- Vermunt MW, et al. 2016. Epigenomic annotation of gene regulatory alterations during evolution of the primate brain. Nat Neurosci. 19(3):494–503. [DOI] [PubMed] [Google Scholar]
- Vitaterna MH, et al. 1994. Mutagenesis and mapping of a mouse gene, Clock, essential for circadian behavior. Science 264(5159):719–725. [DOI] [PMC free article] [PubMed] [Google Scholar]
- Voight BF, Kudaravalli S, Wen X, Pritchard JK.. 2006. A map of recent positive selection in the human genome. PLoS Biol. 4(3):e72.. [DOI] [PMC free article] [PubMed] [Google Scholar]
- Voineagu I, et al. 2011. Transcriptomic analysis of autistic brain reveals convergent molecular pathology. Nature 474(7351):380–384. [DOI] [PMC free article] [PubMed] [Google Scholar]
- Wang J, et al. 2013. Factorbook. org: a Wiki-based database for transcription factor-binding data generated by the ENCODE Consortium. Nucleic Acids Res. 41(Database issue):D171–D176. [DOI] [PMC free article] [PubMed] [Google Scholar]
- Xu X, Wells AB, O’Brien DR, Nehorai A, Dougherty JD.. 2014. Cell type-specific expression analysis to identify putative cellular mechanisms for neurogenetic disorders. J Neurosci. 34(4):1420–1431. [DOI] [PMC free article] [PubMed] [Google Scholar]
- Xu C, et al. 2018. Human-specific features of spatial gene expression and regulation in eight brain regions. Genome Res. doi:10.1101/gr.231357.117. [DOI] [PMC free article] [PubMed] [Google Scholar]
- Yang JH, Choi JH, Jang H, Park JY, Han JW, Youn HD, Cho EJ.. 2011. Histone chaperones cooperate to mediate Mef2-targeted transcriptional regulation during skeletal myogenesis. Biochem Biophys Res Commun 407:541–547. [DOI] [PubMed] [Google Scholar]
- Zhang B, Horvath S.. 2005. A general framework for weighted gene co-expression network analysis. Stat Appl Genet Mol Biol. 4: Article17. [DOI] [PubMed] [Google Scholar]
- Zhang J. 2003. Evolution of the human ASPM gene, a major determinant of brain size. Genetics 165(4):2063–2070. [DOI] [PMC free article] [PubMed] [Google Scholar]
- Zhang Y, et al. 2014. An RNA-sequencing transcriptome and splicing database of glia, neurons, and vascular cells of the cerebral cortex. J Neurosci 34(36):11929–11947. [DOI] [PMC free article] [PubMed] [Google Scholar]
Associated Data
This section collects any data citations, data availability statements, or supplementary materials included in this article.