

Abstract
This study appraises the effectiveness and cost-effectiveness of consumption of plant sterol-enriched margarine-type spreads for the prevention of cardiovascular disease (CVD) in people with hypercholesterolemia in England, compared to a normal diet. A nested Markov model was employed using the perspective of the British National Health Service (NHS). Effectiveness outcomes were the 10-year CVD risk of individuals with mild (4–6 mmol/l) and high (above 6 mmol/l) cholesterol by gender and age groups (45–54, 55–64, 65–74, 75–85 years); CVD events avoided and QALY gains over 20 years. This study found that daily consumption of enriched spread reduces CVD risks more for men and older age groups. Assuming 50% compliance, 69 CVD events per 10,000 men and 40 CVD events per 10,000 women would be saved over 20 years. If the NHS pays the excess cost of enriched spreads, for the high-cholesterol group, the probability of enriched spreads being cost-effective is 100% for men aged over 64 years and women over 74, at £20,000/QALY threshold. Probabilities of cost-effectiveness are lower at younger ages, with mildly elevated cholesterol and over a 10-year time horizon. If consumers bear the full cost of enriched spreads, NHS savings arise from reduced CVD events.
Keywords: Plant sterols, Cardiovascular disease risk, England, Cost-effectiveness analysis
Introduction
Raised total or low-density-lipoprotein cholesterol (LDL-c) is a major risk factor predisposing an individual to cardiovascular disease (CVD), which can be modified by various prevention programs, such as changes in diet. Plant sterols and stanols (a saturated subgroup of sterols), hereafter referred to collectively as plant sterols, are plant equivalents of cholesterol with a very similar molecular structure [1]. They are found naturally in fruit, vegetables, nuts, seeds, grains, and legumes and prevent the absorption of cholesterol into the bloodstream, but are unlikely to be consumed in sufficient quantities to reduce cholesterol levels [2–4]. Research has shown that adding plant sterols into the daily diet can substantially enhance the cholesterol-lowering effects of diet change [2–5]. Functional foods enriched with plant sterols, including margarine-type spreads, mayonnaise and salad dressing, and dairy products (milk, yogurt, cheese), have been shown to achieve a beneficial effect on the serum lipid profile of the consumer [6].
Although the effectiveness of plant sterols in reducing LDL-c has been verified in a number of studies [2, 3, 7–13], evidence on whether use of plant sterols is a cost-effective preventive strategy for reducing CVD risks is limited. To date, only four modeling studies have been identified but their findings may not be applicable to the United Kingdom (UK) context [14–17]. Three of these studies based their CVD risk estimations on the Framingham equation, which has been shown to overestimate CVD risks for the UK population and is no longer recommended by the National Institute of Health and Clinical Excellence (NICE) [18, 19]. Moreover, health states in some studies are simplified for the convenience of the analysis [14, 16]. Also, it is instructive to look at the cost-effectiveness separately for different age and gender groups and at different compliance levels.
The study reported in this paper used a nested Markov model to assess the effectiveness and cost-effectiveness of plant sterol-enriched functional foods for the prevention of CVD disease in the English population with hypercholesterolemia, when compared to a normal diet (no plant sterol-enriched functional foods). The analysis takes the perspective of the British National Health Service (NHS), and considers costs borne by consumers for the purchase of functional foods. Health outcomes are represented by CVD events, mortality, and quality-adjusted life years (QALYs). Cost-effectiveness is defined by the NICE threshold of between £20,000 and £30,000 per QALY gained [20].
Methods
Model structure
A decision analytical model was used to synthesize epidemiological, clinical, and economic data to appraise the effectiveness and cost-effectiveness of plant sterol-enriched functional foods in the prevention of CVD in England. A nested Markov model structure, which allows the occurrence of both primary and secondary CVD events, was derived from a model used previously for a health technology assessment of the impact of statins [21]. All individuals start in the event-free (EF) health state. During each annual cycle of the model, individuals (depending on their risk) either remain EF or have a primary event and enter one of the event health states: stable angina, unstable angina, non-fatal myocardial infarction (MI), transient ischemic attack (TIA), non-fatal stroke, or death (either due to CVD or other causes). In each subsequent cycle, individuals in a non-fatal CVD event health state may move to a secondary event state, as shown in Table 1.
Table 1.
Model structure
| Primary events | Secondary events | ||
|---|---|---|---|
| From | To | From | To |
| Event-free | Event-free | ||
| Stable angina | Stable angina | Stable angina | |
| Unstable angina | |||
| Non-fatal MI | |||
| Death | |||
| Unstable angina | Unstable angina | Post-unstable angina | |
| Non-fatal MI | |||
| Death | |||
| Non-fatal MI | Non-fatal MI | Post non-fatal MI | |
| Non-fatal MI | |||
| Non-fatal stroke | |||
| Death | |||
| TIA | TIA | Post-TIA | |
| Non-fatal MI | |||
| Non-fatal stroke | |||
| Death | |||
| Non-fatal stroke | Non-fatal stroke | Post non-fatal stroke | |
| Non-fatal MI | |||
| Non-fatal stroke | |||
| Death | |||
| Death | |||
Population
The analysis focused on individuals aged 45 and above with baseline total cholesterol level ≥ 4 mmol/l [22]. Based on evidence in a recent meta-analysis, it was assumed that plant sterols are a primary prevention strategy and effective only for people in the EF state [4]. Hence, those with a history of CVD were excluded. The baseline cohort was drawn from the Health Survey for England (HSE) 2011, an annual survey conducted by the Health and Social Care Information Centre that uses random samples of the population living in private households to gather information about the nation’s health. In particular, the HSE 2011 focused on CVD and gathered information on an individual’s risk factors, including cholesterol level, CVD history, and other relevant health and demographic variables. Data from the HSE 2011 have been used to model CVD risks in various health economic studies [23, 24].
Two clinical scenarios were considered: individuals with cholesterol levels between 4 and 6 mmol/l (mildly elevated cholesterol population) and those with cholesterol levels above 6 mmol/l (high-cholesterol population) [22]. For each scenario, the population was modeled separately by gender and age group (45–54, 55–64, 65–74, 75–85 years). The age range was determined by the QRISK2 function (www.qrisk.org), which was used to predict CVD risks, and which only extends to 85 years.
Estimation of CVD risk and other-cause mortality
The primary estimation of CVD risk for the study population was based on the QRISK2 equation (QRISK2-2014). Recommended by NICE, QRISK2 is a new CVD risk prediction tool which provides a 10-year CVD risk estimation for the UK population (www.qrisk.org) [25]. It is a validated tool and has been used in various clinical studies [18, 19]. QRISK2 predicts CVD risks based on a wide range of risk factors including age, systolic blood pressure, smoking status, ethnicities, ratio of total serum cholesterol to high-density lipoprotein, body mass index, family history of coronary heart disease in first-degree relative, body mass index (BMI), Townsend deprivation score, treated hypertension, and diagnosis of rheumatoid arthritis, atrial fibrillation, type 2 diabetes, and chronic renal disease.
The 10-year individual risk prediction provided by QRISK2 was converted to a 1-year risk for each gender and age subgroups. The conversion is based on published and validated algorithms [16, 26]. The QRISK2 tool indicates the probability of a CVD event occurring, but not the type of event. The distribution of types of events within groups, and the transition probabilities to model the number of people moving from any particular health state to another over subsequent cycles, were based on the probabilities in a study conducted by Ward et al. [21]. The percentage of people dying from non-CVD causes was accounted for using age- and gender-specific mortality rates derived from Office of National Statistics data for 2015 [27]. Annual risks of non-CVD deaths were estimated from the causes of death register by subtracting the fraction of deaths due to CVD causes from the total mortality.
Clinical effectiveness of plant sterols on cholesterol lowering
The dose–response relationship for the cholesterol-lowering effect of plant sterols has been explored in a number of meta-analyses [2, 7, 9]. It is suggested that the LDL-c-lowering effect starts at intakes of 2–3 g/day with little additional benefit at higher intakes [1, 7]. It is also suggested that incorporating higher amounts of plant sterols into foods is technically unrealistic [28, 29]. Several health authorities include 3 g/day plant sterols from enriched foods as part of their diet and lifestyle guidelines in the management of hypercholesterolemia [30, 31]. Therefore, this study used 3 g/day as the dose value for plant sterols in the model.
A literature search was undertaken to identify the clinical effectiveness of plant sterols. A scientific opinion by the European Food Safety Authority (EFSA) suggested that an intake of plant sterols of 3 g/day (2.6–3.4 g) reduced the LDL-c levels effectively by 11.2–11.4% (95% CI 9.8–13.0), and that the minimum duration required to achieve the maximum effect is 2–3 weeks [4]. The conclusions of the effect size were consistent with other findings [2, 7]. The most recent clinical evidence (up to 2014) is provided by the meta-analysis of 129 studies by Ras et al. [9] concluding that intakes of approximately 3 g/day (plant sterols) led to an average LDL-cholesterol-lowering effect of 12%, and this was used as the basis for the modeling. In the absence of evidence for the time course of intervention effects, it was assumed that the protective effect of plant sterols continues, providing minimum intakes are maintained.
Impact of plant sterols on relative risk
The 10-year CVD risk was re-calculated for each individual in the study population using the QRISK2 assessment tool, and grouped by gender and age (as described above), assuming a 12% reduction to total cholesterol or LDL-c level caused by consuming 3 g/day of plant sterols. Relative risk (RR) was calculated as the ratio of the probability of a CVD event occurring with consumption of plant sterols to the probability of the event occurring in the non-exposed (normal diet) condition, for each gender and age group. Relative risks were used in the simulation, with standard errors of RRs taken into account to reduce parameter uncertainties. In this way, the difference in number of events between the functional food and normal diet conditions, and specifically the number of events avoided by sterol consumption, were identified.
Costs of health states and functional foods
One output of the model was annual numbers of individuals in different health states to which unit costs of treatment were applied. The cost of an event was included in the year in which it occurred, and a maintaining cost was applied in subsequent years. Costs of health states were largely obtained using 2014 NHS reference costs [32]. Where cost information was not available, costs from a published health technology evaluation of statins were used [21]. Information on the cost of health states can be found in Appendix 1.
Commonly available foods enriched with sterols include margarine-type spreads, yogurt, and milk. The analysis was based on spread, as this is the product that enables the required dose of plant sterols (3 g per day) to be consumed at the least cost. Margarine-type spreads are common items in the diet of the British population with median consumption in adults around 40 g per day [33], which is sufficient to ensure an intake of 3 g of sterols (Appendix 2). The costs of products were obtained from the websites of three national supermarket chains in the UK in April 2015, with the supermarket’s own brand used for the non-sterol-enriched spread. Unit costs were the same across retailers for each product. Calculation of food costs can be found in Appendix 2.
Quality-adjusted life years (QALYs)
Utility estimates for health states were derived from various sources following a review of the literature that focused on UK-based studies and use of the preference-based utility instrument, the EQ-5D, which is the recommended instrument for measuring QALYs [34–36]. Health utilities used in the analysis can be found in Appendix 1. These utility values were applied to annual health states for individuals, and a mean value was calculated.
Main analysis
The baseline population was described using summary statistics. CVD risks and RRs for the normal diet group and plant sterol condition were compared. A cost-effectiveness analysis was then conducted from the NHS perspective. The price of spread enriched with plant sterols is higher than that of non-enriched spread and this may discourage purchases. Therefore, in the base case, it was assumed that the NHS would subsidize the cost difference between the supermarket’s own brand of non-enriched spread (£54.10 pa) and the manufacturer-brand plant sterol spread (£111.04 pa), i.e., £56.94 pa, for each of the 20 years of the modeling (Appendix 1). Two compliance rates—10 and 50%, based around pessimistic and ideal levels identified in a Canadian study—were explored [17]. The modeling was conducted over 20 years until the average age of the baseline cohort reached the life expectancy of the UK population (85 years). In line with NICE recommendations for health technology assessments, a discount rate of 3.5% was used for both costs and utilities [37].
The number of events avoided by consuming plant sterols over the modeling period was calculated by a deterministic model. Incremental costs, incremental QALYs, and the incremental cost-effectiveness ratios (ICERs) were then calculated for each gender and age group. Incremental costs from the plant sterol diet, compared to the normal diet, were calculated as the cost of the NHS subsidy for the spread over the 20-year period less any treatment cost savings from reduced CVD events. Incremental QALYs are the difference in QALYs between the plant sterol group and the normal diet group. ICERs show the cost per QALY gained when a diet enriched with plant sterols is followed, rather than a diet without the functional food. Uncertainty around point estimates in the cost-effectiveness analysis was examined using probabilistic sensitivity analysis (PSA), and cost-effectiveness acceptability curves (CEAC) were plotted. For each age and gender group, a second-order Monte Carlo simulation using the probabilistic parameters based on 5000 replications was carried out [26].
Sensitivity analysis
Four sets of sensitivity analyses were conducted. First, a one-way sensitivity analysis related to the assumed clinical efficacy of plant sterols was conducted using the estimated upper (13.3%) and lower (10.7%) limits of 95% confidence intervals around the average LDL reduction level of 12% in the paper [9]. Second, it was assumed that the NHS pays the full food costs, and the compliance level was 50%. Third, it was assumed that individuals were responsible for the full costs of the plant sterol-enriched spread (no NHS subsidy), and for this model a very pessimistic scenario of 5% compliance was used [17]. Lastly, to align with the 10-year individual risk protection provided by QRISK2, ICERs were recalculated for the base case (NHS pays the excess cost of sterol enriched margarine) over a 10-year time horizon, at 50% compliance.
All analyses were carried out using STATA13 and Microsoft Excel 2013. Half cycle correction was used for costs and utilities. Detailed information of model parameters and distribution is shown in Appendix 3.
Results
Baseline description of study population
There were 1598 people with mildly elevated cholesterol (4–6 mmol/l) and 640 with high cholesterol (above 6 mmol/l) in the HSE 2011. The key risk factors are summarized in Table 2. The mean BMI, systolic blood pressure, and total cholesterol/HDL cholesterol ratio was higher in the high-cholesterol group, which also contained a larger proportion of women than the mild cholesterol group. Applying QRISK2, the average 10-year CVD risk for the mild-cholesterol group is 12.27, and 12.85% for the high-cholesterol group.
Table 2.
Baseline characteristics of modeled population by cholesterol level
| Mild-cholesterol population (N = 1598) | High-cholesterol population (N = 640) | |||
|---|---|---|---|---|
| Mean | SD | Mean | SD | |
| Age | 59.40 | 10.42 | 60.46 | 9.91 |
| Proportion of male | 0.41 | 0.49 | 0.35 | 0.48 |
| BMI | 27.61 | 4.95 | 28.04 | 4.90 |
| Systolic blood pressure (mmHg) | 129.73 | 17.41 | 132.10 | 17.41 |
| Total cholesterol (mmol/l)/HDL ratio (mmol/l) | 3.98 | 1.38 | 4.51 | 1.53 |
| 10-year CVD risk | 12.27 | 11.87 | 12.85 | 10.78 |
Risks and events avoided
For both cholesterol groups, the 10-year CVD risks increase with age. The plant sterol group is associated with lower 10-year CVD risks than the normal diet group at all ages (Fig. 1). Regarding relative risks, plant sterol-enriched functional foods reduce CVD risk more in men than women, and in older age groups, compared to the younger ones (Table 3).
Fig. 1.

Ten-year CVD risk for the mild- and high-cholesterol groups for the normal diet and plant sterol groups by age and gender
Table 3.
RR by risk groups by age and gender
| Mild-cholesterol population | High-cholesterol population | |||||||
|---|---|---|---|---|---|---|---|---|
| Male | Female | Male | Female | |||||
| Mean (%) | 95% CI | Mean | 95% CI | Mean (%) | 95% CI | Mean | 95% CI | |
| 45–54 | 91.29 | 0.909, 0.917 | 94.00 | 0.938, 0.942 | 89.99 | 0.893, 0.907 | 92.81 | 0.923, 0.933 |
| 55–64 | 91.65 | 0.913, 0.920 | 93.93 | 0.937, 0.942 | 89.90 | 0.892, 0.906 | 93.30 | 0.930, 0.936 |
| 65–74 | 91.90 | 0.915, 0.923 | 93.62 | 0.934, 0.939 | 91.18 | 0.906, 0.918 | 93.03 | 0.927, 0.934 |
| 75–84 | 92.07 | 0.916, 0.926 | 94.00 | 0.937, 0.943 | 91.00 | 0.900, 0.920 | 93.42 | 0.930, 0.938 |
Using deterministic parameters, a diet including the recommended levels of plant sterols avoids 69 CVD events (59 non-fatal and ten fatal CVD events) per 10,000 men and 40 (33 non-fatal and seven fatal) per 10,000 women, aged 45–85, at 50% compliance level, and 14 CVD events per 10,000 men and eight CVD events per 10,000 women at 10% compliance level.
Cost-effectiveness—base case
The age- and gender-specific QALYs, costs, and ICERs (costs per QALY gained from sterol-enriched spread, compared to normal spread) for different cholesterol populations over 20 years at 10 and 50% compliance levels, assuming the NHS pays the excess cost of the sterol-enriched product are shown in Table 4. The cost to the NHS of subsidizing sterol-enriched spread is lower in men because more CVD events are avoided than in women. Accordingly QALY gains, which rise with compliance level and age, are also higher for men.
Table 4.
Age- and gender-specific ICERs (£/QALY) over 20 years for mild- and high-cholesterol groups at 10 and 50% compliance levels: main analysis in which NHS pays excess cost of sterol-enriched spread
| Mild-cholesterol population | High-cholesterol population | |||||||||||||
|---|---|---|---|---|---|---|---|---|---|---|---|---|---|---|
| Control group QALY | Control group cost | 10% compliance | 50% compliance | 10% compliance | 50% compliance | |||||||||
| Incremental QALY | Incremental cost (£) | ICER: £/QALY | Incremental QALY | Incremental cost (£) | ICER: £/QALY | Incremental QALY | Incremental cost (£) | ICER: £/QALY | Incremental QALY | Incremental cost (£) | ICER: £/QALY | |||
| Male | ||||||||||||||
| 45–54 | 12.017 | 351.79 | 0.001 | 71.81 | 69,091.26 | 0.005 | 359.76 | 69,121.05 | 0.002 | 71.38 | 43,773.69 | 0.008 | 357.74 | 43,790.41 |
| 55–64 | 10.880 | 586.11 | 0.002 | 64.32 | 37,683.40 | 0.009 | 322.74 | 37,715.67 | 0.003 | 63.42 | 22,793.76 | 0.014 | 318.45 | 22,812.52 |
| 65–74 | 9.068 | 860.13 | 0.003 | 52.52 | 19,714.31 | 0.013 | 264.04 | 19,740.48 | 0.004 | 52.03 | 13,589.23 | 0.019 | 261.70 | 13,604.39 |
| 75–84 | 6.506 | 880.86 | 0.002 | 37.19 | 16,711.10 | 0.011 | 187.35 | 16,768.41 | 0.003 | 36.47 | 11,923.24 | 0.015 | 183.91 | 11,967.03 |
| Female | ||||||||||||||
| 45–54 | 12.142 | 185.60 | 0.000 | 76.06 | 223,033.15 | 0.002 | 380.54 | 223,064.18 | 0.001 | 75.84 | 135,436.10 | 0.003 | 379.53 | 135,453.23 |
| 55–64 | 11.134 | 362.13 | 0.001 | 70.78 | 104,760.51 | 0.003 | 354.37 | 104,788.67 | 0.001 | 70.57 | 69,283.84 | 0.005 | 353.37 | 69,298.86 |
| 65–74 | 9.448 | 663.35 | 0.002 | 59.64 | 33,269.93 | 0.009 | 299.09 | 33,287.32 | 0.003 | 59.31 | 22,526.23 | 0.013 | 297.53 | 22,534.68 |
| 75–84 | 6.779 | 753.95 | 0.002 | 42.97 | 22,811.15 | 0.009 | 215.86 | 22,855.54 | 0.003 | 42.62 | 16,659.74 | 0.013 | 214.20 | 16,692.58 |
The numbers in italics are plant sterol-enriched spread cost-effective at NICE threshold below £30,000 per QALY gained
The numbers in bold are plant sterol-enriched spread cost-effective at NICE threshold below £20,000 per QALY gained
Incremental QALYs show QALY gained from sterol-enriched spread compared to no sterol-enriched spread
Incremental costs show the cost to the NHS of sterol-enriched spread, less treatment cost savings from reduced CVD events
The ICERs (costs per QALY gained) are higher for mildly elevated cholesterol than for the high-cholesterol group. Hence, subsidizing sterol-enriched spread is more cost-effective at higher cholesterol levels. In both the 10 and 50% compliance models, the cost per QALY gained is below the £20,000 threshold for men over 64 years and women over 74 years with high cholesterol; it is below the £30,000 threshold for men over 54 and women over 64 (Table 4).
The cost-effectiveness acceptability curves (CEACs) for different age and gender groups at 10 and 50% compliance levels for the high- and mild-cholesterol groups are shown in Figs. 2 and 3. For the high-cholesterol group, when the NHS pays the excess cost, the enriched spread is likely to be cost-effective for men over the age of 64, and women over 74, at the £20,000 threshold, and for men over 54 and women over 64 at the £30,000 threshold, at both the 10 and 50% compliance levels. For the mild-cholesterol group, the probability that plant sterol-enriched spread is cost-effective for any age/gender group, compliance level or threshold is lower than for the high-cholesterol group.
Fig. 2.
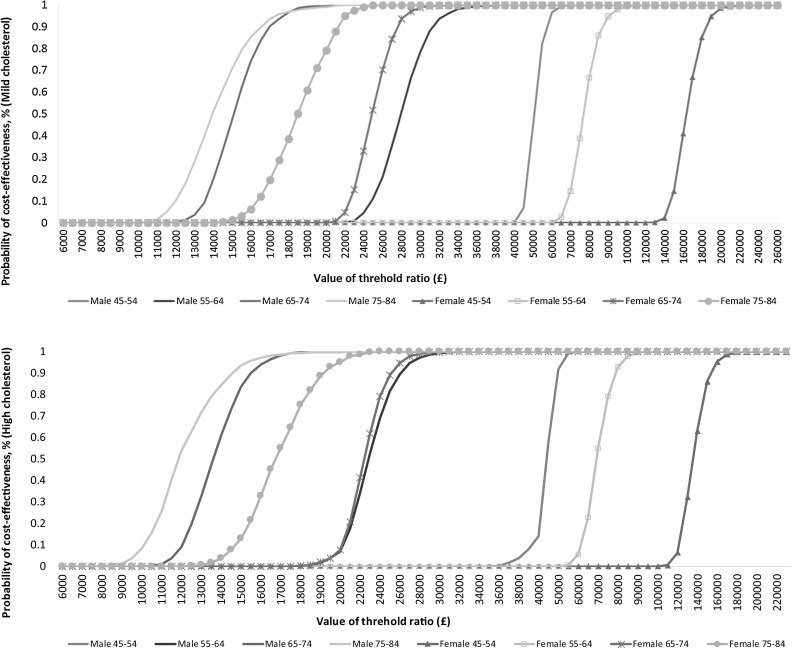
Cost-effectiveness acceptability curves at 10% compliance level (mild- and high-cholesterol population): main analysis in which NHS pays excess cost of sterol-enriched spread
Fig. 3.

Cost-effectiveness acceptability curves at 50% compliance level (mild- and high-cholesterol population): main analysis in which NHS pays excess cost of sterol-enriched spread
Sensitivity analysis
Using the upper limit (13.3%) of the 95% confidence interval instead of the assumed mean LDL reduction (12%) from use of plant sterols, with 50% compliance, and the NHS covering the excess cost, did not affect the groups for which enriched spread was cost-effective. However, with the lower limit of the 95% confidence interval, the likelihood of plant sterol-enriched spread being cost-effective is slightly increased for the mild-cholesterol group (Appendix 4).
When the assumption is adopted that the NHS is responsible for the full costs of providing sterol-enriched spread, and the compliance rate is 50%, the plant sterol-enriched diet is only cost-effective for men over 64 with high cholesterol and between 75 and 85 with mild cholesterol, and if the cost-effectiveness threshold is set at £30,000 per QALY gained. It is not cost-effective for women in any age group, or for either men or women at the lower threshold of £20,000 per QALY gained (Appendix 4).
If individuals are assumed to be responsible for the full cost of the sterol-enriched spread, the NHS realizes savings from reduced treatment costs due to fewer CVD events whilst incurring no charges for the products, even at a very pessimistic compliance rate of 5% (Appendix 4).
With a 10-year time horizon (instead of 20 years), at 50% compliance, sterol-enriched margarine becomes less cost-effective for all groups (Appendix 4).
Discussion
Summary of main findings
This study is among the first to model CVD outcomes from consumption of plant sterol-enriched foods, and appraise cost-effectiveness within the British NHS for an adult population with hypercholesterolemia. Multiple scenarios were considered involving varied cost-sharing arrangements between the consumer and the NHS (to affect consumption), and different assumptions about levels of compliance. Of several sterol-enriched foods available, the analysis was based on margarine-type spreads because these are commonly consumed, and an efficacious ‘dose’ of sterols is achievable within average daily consumption levels. Moreover, enriched spread is the cheapest means of providing the required intake.
Under the assumption that the difference in cost to the consumer between sterol-enriched and normal spread is subsidized, then the sterol-enriched spread is likely to be cost-effective for men with hypercholesterolemia over the age of 64, and for women with hypercholesterolemia over 74 years with the compliance level of 10 and 50% and the cost-effectiveness threshold of £30,000 per QALY gained. At the lower threshold of £20,000 per QALY gained, the subsidy is less likely to be cost-effective at lower age groups. Reducing the time horizon for the modeling diminishes the likelihood of sterol-enriched spread being cost-effective. Shifting the cost burden of the product to consumers increases the likelihood of cost-effectiveness. Ultimately, if consumers in the target groups bear the full cost, the NHS will maximally benefit from reduced CVD treatment costs. The other more costly sterol-enriched products are likely to be less cost-effective for the NHS.
Comparison to other studies
To date, only three other studies have evaluated the cost-effectiveness of plant sterols [14, 16, 17]. A cost–benefit analysis of plant sterol-enriched low-fat margarine for cholesterol reduction based on the German population found that the 10-year CVD risk and associated costs were significantly lower for the plant sterol group compared with the normal diet group. A projection at the level of the German population led to a reduction of 117,000 CVD cases over 10 years for the whole German population and a cost saving of €1.3 billion [14]. Similar results were demonstrated in Canada, where it was estimated that significant savings could be made annually for the publicly funded healthcare system if plant sterol-enriched food was approved for sale [17]. It has also been suggested that plant sterol-enriched spreads are potentially cost-effective in the prevention of CVD risks in adult men and in older women in Finland [16].
Limitations of the study
The results should be interpreted in light of the limitations of the study and the assumptions that were made. HSE only covers households in England so findings may not be more widely generalizable. Compliance levels were based on studies from Canada, but these may not reflect the consumption level of plant sterols in England. Complicating matters further, the duration of the effects of plant sterols on reduction in LDL-c level is not clear. Whilst some studies found that the cholesterol-lowering effect is established within a few weeks, and is proved to remain stable for at least a year [7, 8, 10], we have assumed a more enduring benefit. Research also shows that doses higher than 3 g/day could lead to negative side effects [8, 38, 39], but evidence on this is limited, and no effect has been allowed for. Furthermore, this study does not take account of potentially large inter-individual variability in absorption and turnover of non-cholesterol sterols that are increasingly under investigation. When these effects are better understood, they may influence screening policies and hence cost-effectiveness [40]. The study primarily adopted the perspective of the NHS. Societal effects associated with CVD are not included (productivity loss, family costs, social care). Consideration of these issues, however, would have increased the savings to the NHS and made sterol-enriched diets more likely to be cost-effective. The data for risk calculations used in this study are mainly derived from HSE. However, it was not possible to take account of other lifestyle factors that might affect future risks and outcomes (e.g., exercise, health awareness, smoking, alcohol consumption). Similarly, it is possible that some subjects in the survey already consume sterols in some form or another, and since the extent of this was unknown, it could not be incorporated into the analysis. Also, the time horizon was set as 20 years, while QRISK2 is based on the estimation of 10-year risk.
The policy implications of the study
Pending results from randomized controlled trials, NICE does not recommend routine use of plant sterols and stanols for CVD prevention if the patient has already received treatment [25], but focuses instead on promoting a more natural cardio-protective diet (low fat and sugar, whole grains, fruit, vegetables, oily fish, nuts, seeds, legumes) and use of statins [41]. This position is supported by some scholars who have pointed out that plant sterols have not been shown to reduce clinical end points and suggest that prescription drugs should be preferred to stanol/sterol esters for lowering cholesterol except in borderline hypercholesterolemia [42]. Despite this, an increasing number of experts and health organizations recommend consuming plant sterols to reduce CVD risks, including the American and British Heart Associations [31, 43]. Moreover, the European Commission has acknowledged the value of sterol-enriched foods for cholesterol lowering through approval of health claims on some products [4, 6].
The findings from this study add weight to calls for the increased use of plant sterol-enriched functional food as a preventive strategy for people with hypercholesterolemia, and suggest that encouraging the consumption of plant sterol-enriched functional food is likely to bring cost savings to health systems, as well as improving patient outcomes. In England, the annual cost of a subsidy equivalent to the excess cost of sterol-enriched spread (about £57 per subject in this study) is similar to the annual cost of many statins. Although subject to debate, a drawback that is raised regarding statins is that compliance is reduced because of side effects, and that adverse events may occur [44–47]. Such issues are less likely to be relevant to functional foods. Unlike statins, however, which are provided with doctor endorsement and on prescription, efforts may be needed to ensure that consumers are aware and motivated to use sterol-enriched products and are able to understand the claims made on them. Under some circumstances, mass media campaigns may be effective, but consideration needs to be given to costs and likely impact in policy deliberations [48].
Appendix 1
See Table 5.
Table 5.
Cost- and health-utility values for health states
| Health states | Costs (£) | Source | Utility | Source |
|---|---|---|---|---|
| EF | 0 | Ara et al. [36] | 1.060–0.004*age | Ara et al. [36] |
| Angina first year | 684.00 | NHS reference costs 2013/14 | 0.808 | Lenzen et al. [49], Ara et al. [36] |
| Angina subsequent years | 233.00 | Ara et al. [38] (inflated to 2015) | 0.9 | |
| Unstable angina first year | 1428.50 | NHS reference costs 2013/14 | 0.731 | Goodacre et al. [35], Kim et al. [50] |
| Unstable angina subsequent years | 233.00 | Ara et al. [38] (inflated to 2015) | 0.8 | |
| MI first year | 1377.00 | NHS reference costs 2013/14 | 0.7 | Goodacre et al. [35], Lacey and Walters [51] |
| MI subsequent years | 233.00 | Clarke et al. [57], 155 (inflated to 2015) | 0.8 | |
| TIA | 1419.00 | NHS reference costs 2013/14 | 1.060–0.004*age | Aprile et al. [52], Ara et al. [36] |
| TIA subsequent years | 373.00 | Ara et al. [38] (inflated to 2015) | 1.060–0.004*age | |
| Stroke | 4843.00 | NHS reference costs 2013/14 | 0.5 | Tengs and Lin [53], van Exel et al. [54], Leeds et al. [55] |
| Stroke subsequent years | 3055.00 | Youman et al. [56] (inflated to 2015) | 0.629 |
Appendix 2
See Table 6.
Table 6.
Calculation of the food costs
| Functional food | Unit cost (£) | Plant sterols | Annual cost (£) |
|---|---|---|---|
| Plant sterol yoghurt drink 6 × 67.5 G (manufacturer’s brand) | 3.78 | 2 g per bottle | 460.2 |
| Plant sterol yoghurt mini drink 6 × 100 ml (manufacturer’s brand) | 3.5 | 2 g per bottle | 426.13 |
| Plant sterol Milk 1L (manufacturer’s brand) | 1.39 | 3 g per 1 L mil2l | 507.7 |
| Plant sterol Light Spread 250 G (manufacturer’s brand) | 1.9 | 18.75 g per 250 G spread | 111.04 |
| Non-sterol-enriched spread 500 G (supermarket’s own brand) | 1.85 | N/A | 54.1 |
The calculation of annual cost is based on 3 g/day intake and 365.25 days per year. One unit (bottle) of plant sterol yoghurt drink contains 2 g plant sterols, so the daily cost is based on a consumption of 2 units. There are currently two plant sterol enriched spreads available in the UK, and costs were based on the leading brand
Appendix 3
See Table 7.
Table 7.
Parameters and distributions
| Base-line value | Distribution | Source | |
|---|---|---|---|
| Annual CVD risks | Derived from HSE 2011 using QRISK2 function | Log-normal | Authors’ own |
| RR | Age- and gender-specific RR | Log-normal | Authors’ own |
| Transition probabilities | Age- and gender-specific transition probabilities | Beta | Derived from Ward et al. [21] |
| Costs of health states | Cost for the first year and subsequent year of each health state was allowed | Gamma | First-year costs were derived from NHS reference costs. Subsequent year costs were derived from Ward et al. [21] |
| Costs of the functional food | Supermarket price in April, 2014 | Deterministic | Derived from supermarket websites in April, 2014 |
| Utility of health states | Utilities of the first year and subsequent year of each health state was used in the analysis | Beta | Derived from Ara et al., Ward et al. [21], D’Agostino et al. [34], Goodacre et al. [35], Lensen et al., Kim et al., Lacey et al. |
| Compliance level | Varying compliance level at 50 and 100% for the main analysis. | Beta | Derived from National Diet and Nutrition Survey |
| Discount rate | 3.5% for both cost and utility | Deterministic | Derived from NICE technology appraisals methods guide 2013 |
Parameter distributions are consistent with Briggs et al. 2014
Appendix 4
See Table 8.
Table 8.
ICER (£/QALY): results of sensitivity analyses
| Mild-cholesterol population | High-cholesterol population | |||
|---|---|---|---|---|
| Male | Female | Male | Female | |
| NHS pays the cost difference between sterol-enriched and normal spread 50% compliance level | ||||
| LDL reduction at 10.7% | ||||
| 45–54 | 75,009.93 | 251,029.38 | 47,023.289 | 149,367.506 |
| 55–64 | 41,170.06 | 117,946.26 | 24,539.187 | 77,118.267 |
| 65–74 | 21,675.50 | 37,354.67 | 14,832.649 | 25,045.405 |
| 75–84 | 18,506.26 | 25,913.87 | 13,069.377 | 18,724.213 |
| LDL reduction at 13.3% | ||||
| 45–54 | 64,061.41 | 200,643.05 | 40,957.433 | 123,877.587 |
| 55–64 | 34,767.54 | 94,212.97 | 21,297.750 | 62,882.757 |
| 65–74 | 18,096.92 | 29,982.24 | 12,547.142 | 20,458.145 |
| 75–84 | 15,297.62 | 20,403.12 | 11,015.281 | 15,031.192 |
| NHS pays the cost difference between sterol-enriched and normal spread 50% compliance level | ||||
| Time horizon as 10 years | ||||
| 45–54 | 144,664.38 | 481,921.45 | 98,721.807 | 304,097.157 |
| 55–64 | 73,227.38 | 231,149.10 | 46,967.747 | 158,458.671 |
| 65–74 | 36,043.75 | 70,154.82 | 25,600.421 | 48,643.878 |
| 75–84 | 19,820.82 | 30,012.02 | 13,320.681 | 20,488.245 |
| Individual pays the full cost of the plant sterol-enriched spread | ||||
| 5% compliance level | ||||
| 45–54 | − 2032.06 | − 2311.43 | − 2032.08 | − 2311.44 |
| 55–64 | − 1892.32 | − 2219.71 | − 1892.37 | − 2219.72 |
| 65–74 | − 1593.21 | − 1486.11 | − 1593.25 | − 1486.13 |
| 75–84 | − 2002.72 | − 1573.18 | − 2002.83 | − 1573.21 |
| NHS pays the cost difference between sterol enriched and normal spread 50% compliance level | ||||
| Time horizon as 10 year | ||||
| 45–54 | 144,664.38 | 481,921.45 | 98,721.807 | 304,097.157 |
| 55–64 | 73,227.38 | 231,149.10 | 46,967.747 | 158,458.671 |
| 65–74 | 36,043.75 | 70,154.82 | 25,600.421 | 48,643.878 |
| 75–84 | 19,820.82 | 30,012.02 | 13,320.681 | 20,488.245 |
Plant sterol-enriched spread cost-effective at NICE threshold below £30,000 per QALY gained
Plant sterol-enriched spread cost-effective at NICE threshold below £20,000 per QALY gained
Contributor Information
Wei Yang, Phone: + 44 (0)7912 6229 01, Email: wei.yang@kcl.ac.uk.
Heather Gage, Phone: +44 (0) 148 368 6948, Email: h.gage@surrey.ac.uk.
Daniel Jackson, Phone: +44 (0) 148 368 2947, Email: d.jackson@surry.ac.uk.
Monique Raats, Phone: +44 (0) 01483 68 9431, Email: m.raats@surrey.ac.uk.
References
- 1.Genser, B., Silbernagel, G., De Backer, G., et al. Plant sterols and cardiovascular disease: a systematic review and meta-analysis. Eur. Heart J. 33(4), 444-U28 (2012) [DOI] [PMC free article] [PubMed]
- 2.Musa-Veloso K, Poon TH, Elliot JA, Chung C. A comparison of the LDL-cholesterol lowering efficacy of plant stanols and plant sterols over a continuous dose range: results of a meta-analysis of randomized, placebo-controlled trials. Prostaglandins Leukot Essent Fatty Acids. 2011;85(1):9–28. doi: 10.1016/j.plefa.2011.02.001. [DOI] [PubMed] [Google Scholar]
- 3.Gylling H, Plat J, Turley S, Ginsberg HN, Ellegard L, Jessup W, Jones PJ, Luetjohann D, Maerz W, Masana L, Silbernagel G, Staels B, Boren J, Catapano AL, De Backer G, Deanfield J, Descamps OS, Kovanen PT, Riccardi G, Tokgozoglu L, Chapman MJ, Soc European Atherosclerosis. Plant sterols and plant stanols in the management of dyslipidaemia and prevention of cardiovascular disease. Atherosclerosis. 2014;232(2):346–360. doi: 10.1016/j.atherosclerosis.2013.11.043. [DOI] [PubMed] [Google Scholar]
- 4.European Food and Safety Authority Scientific Opinion on the substantiation of a health claim related to 3 g/day plant stanols as plant stanol esters and lowering blood LDL-cholesterol and reduced risk of (coronary) heart disease pursuant to Article 14 of Regulation (EC) No 1924/20061. EFSA J. 2012;10:2692. doi: 10.2903/j.efsa.2012.2692. [DOI] [Google Scholar]
- 5.European Food and Safety Authority Scientific Opinion on the modification of the authorisation of a health claim related to plant sterol esters and lowering blood LDL-cholesterol; high blood LDL-cholesterol is a risk factor in the development of (coronary) heart disease pursuant to Article 14 of Regulation (EC) No 1924/2006, following a request in accordance with Article 19 of Regulation (EC) No 1924/2006. EFSA J. 2014;12:1–14. [Google Scholar]
- 6.Commission European. Commission Regulation (EU) No 686/2014 of 20 June 2014 amending Regulations (EC) No 983/2009 and (EU) No 384/2010 as regards the conditions of use of certain health claims related to the lowering effect of plant sterols and plant stanols on blood LDL-cholesterol Text with EEA relevance. Off. J. EU. 2014;182:1. [Google Scholar]
- 7.Demonty I, Ras RT, van der Kniap HCM, Duchateau GSMJF, Meijer L, Zock PL, Geleijnse JM, Trautwein EA. Continuous dose-response relationship of the LDL-cholesterol-lowering effect of phytosterol intake. J. Nutr. 2009;139(2):271–284. doi: 10.3945/jn.108.095125. [DOI] [PubMed] [Google Scholar]
- 8.Katan M, Grundy S, Jones P, Law M, Miettinen T, Paoletti R, Stresa Workshop Participants Efficacy and safety of plant stanols and sterols in the management of blood cholesterol levels. Mayo Clin. Proc. 2003;78(8):965–978. doi: 10.1016/S0025-6196(11)63144-3. [DOI] [PubMed] [Google Scholar]
- 9.Ras RT, Geleijnse JM, Trautwein EA. LDL-cholesterol-lowering effect of plant sterols and stanols across different dose ranges: a meta-analysis of randomised controlled studies. Br. J. Nutr. 2014;112(2):214–219. doi: 10.1017/S0007114514000750. [DOI] [PMC free article] [PubMed] [Google Scholar]
- 10.Law M. Plant sterol and stanol margarines and health. West. J. Med. 2000;173(1):43–47. doi: 10.1136/ewjm.173.1.43. [DOI] [PMC free article] [PubMed] [Google Scholar]
- 11.Devaraj S, Jialal I. The role of dietary supplementation with plant sterols and stanols in the prevention of cardiovascular disease. Nutr. Rev. 2006;64(7):348–354. doi: 10.1111/j.1753-4887.2006.tb00219.x. [DOI] [PubMed] [Google Scholar]
- 12.Sehayek E, Fung YY, Yu HJ, Lembcke J, Ceglarek U, Teupser D, Thiery J, Lutjohann D, von Bergmann K, Breslow JL. A complex plasma plant sterol locus on mouse chromosome 14 has at least two genes regulating intestinal sterol absorption. J. Lipid Res. 2006;47(10):2291–2296. doi: 10.1194/jlr.M600202-JLR200. [DOI] [PubMed] [Google Scholar]
- 13.Chan Y, Varady KA, Lin Y, Trautwein E, Mensink RP, Plat J, Jones PJH. Plasma concentrations of plant sterols: physiology and relationship with coronary heart disease. Nutr. Rev. 2006;64(9):385–402. doi: 10.1111/j.1753-4887.2006.tb00224.x. [DOI] [PubMed] [Google Scholar]
- 14.Gerber A, Evers T, Haverkamp H, Lauterbach KW. Cost-benefit analysis of a plant sterol containing low-fat margarine for cholesterol reduction. Eur. J. Health Econ. HEPAC Health Econ. Prev. Care. 2006;7(4):247–254. doi: 10.1007/s10198-006-0363-0. [DOI] [PubMed] [Google Scholar]
- 15.Eussen SRBM, Feenstra TL, Toxopeus IB, Hoekstra J, Klungel OH, Verhagen H, van Kranen HJ, Rompelberg CJM. Costs and health effects of adding functional foods containing phytosterols/-stanols to statin therapy in the prevention of cardiovascular disease. Eur. J. Pharmacol. 2011;668:S91–S100. doi: 10.1016/j.ejphar.2011.05.081. [DOI] [PubMed] [Google Scholar]
- 16.Martikainen JA, Ottelin A, Kivinlemi V, Gylling H. Plant stanol esters are potentially cost-effective in the prevention of coronary heart disease in men: Bayesian modelling approach. Eur. J. Cardiovasc. Prev. Rehabil. 2007;14(2):265–272. doi: 10.1097/01.hjr.0000216550.74258.12. [DOI] [PubMed] [Google Scholar]
- 17.Gyles CL, Carlberg JG, Gustafson J, Davlut DA, Jones PJH. Economic valuation of the potential health benefits from foods enriched with plant sterols in Canada. Food Nutr. Res. 2010 doi: 10.3402/fnr.v54i0.5113. [DOI] [PMC free article] [PubMed] [Google Scholar]
- 18.Collins GS, Altman DG. An independent and external validation of QRISK2 cardiovascular disease risk score: a prospective open cohort study. Br. Med. J. 2010;340:c2442. doi: 10.1136/bmj.c2442. [DOI] [PMC free article] [PubMed] [Google Scholar]
- 19.Collins GS, Altman DG. Predicting the 10 year risk of cardiovascular disease in the United Kingdom: independent and external validation of an updated version of QRISK2. Br. Med. J. 2012;344:e4181. doi: 10.1136/bmj.e4181. [DOI] [PMC free article] [PubMed] [Google Scholar]
- 20.Devlin N, Parkin D. Does NICE have a cost-effectiveness threshold and what other factors influence its decisions? A binary choice analysis. Health Econ. 2004;13(5):437–452. doi: 10.1002/hec.864. [DOI] [PubMed] [Google Scholar]
- 21.Ward S, Jones ML, Pandor A, Holmes M, Ara R, Ryan A, Yeo W, Payne N. A systematic review and economic evaluation of statins for the prevention of coronary events. Health Technol. Assess. 2007;11(14):1. doi: 10.3310/hta11140. [DOI] [PubMed] [Google Scholar]
- 22.NHS Choice: High cholesterol. http://www.nhs.uk/conditions/cholesterol/Pages/Introduction.aspx (2015). Last updated: 30/12/2015
- 23.Ara R, Pandor A, Tumur I, Paisley S, Duenas A, Williams R, Rees A, Wilkinson A, Durrington P, Chilcott J. Cost effectiveness of ezetimibe in patients with cardiovascular disease and statin intolerance or contraindications. A Markov model. Am J Cardiovasc Drugs. 2008;8(6):419–427. doi: 10.2165/0129784-200808060-00005. [DOI] [PubMed] [Google Scholar]
- 24.Ara R, Brazier JE. Populating an economic model with health state utility values: moving toward better practice. Value Health. 2010;13(5):509–518. doi: 10.1111/j.1524-4733.2010.00700.x. [DOI] [PubMed] [Google Scholar]
- 25.National Institute for Health and Care Excellence: Cardiovascular disease: risk assessment and reduction, including lipid modification. https://www.nice.org.uk/guidance/cg181. Last updated: 07/2014
- 26.Briggs AH. Decision Modelling for Health Economic Evaluation. Oxford: Oxford University Press; 2006. [Google Scholar]
- 27.Office of National Statistics: Deaths registered in England and Wales. https://www.ons.gov.uk/peoplepopulationandcommunity/birthsdeathsandmarriages/deaths/bulletins/deathsregistrationsummarytables/2015 (2015). Updated 2016. Accessed 10 Jul 2017
- 28.Wolfs M, de Jong N, Ocke MC, Verhagen H, Verschuren WMM. Effectiveness of customary use of phytosterol/-stanol enriched margarines on blood cholesterol lowering. Food Chem. Toxicol. 2006;44(10):1682–1688. doi: 10.1016/j.fct.2006.05.006. [DOI] [PubMed] [Google Scholar]
- 29.de Jong N, Zuur A, Wolfs MCJ, Wendel-Vos GCW, Van Raaij JMA, Schuit AJ. Exposure and effectiveness of phytosterol/-stanol-enriched margarines. Eur. J. Clin. Nutr. 2007;61(12):1407–1415. doi: 10.1038/sj.ejcn.1602660. [DOI] [PubMed] [Google Scholar]
- 30.Lichtenstein AH, Deckelbaum RJ, Amer Heart Assoc Nutr Comm Stanol/sterol ester-containing foods and blood cholesterol levels—a statement for healthcare professionals from the nutrition committee of the council on nutrition, physical activity, and metabolism of the American Heart Association. Circulation. 2001;103(8):1177–1179. doi: 10.1161/01.CIR.103.8.1177. [DOI] [PubMed] [Google Scholar]
- 31.British Heart Foundation: “Reducing your blood cholesterol”, British Heart Foundation, Birmingham, UK, Technical Report 2014, (2014)
- 32.Department of Health . National schedule of reference costs year: 2013–14—all NHS trusts and NHS foundation trusts—HRG data. London: Department of Health; 2014. [Google Scholar]
- 33.Public Health England . National diet and nutrition survey results from years 1, 2, 3 and 4 (combined) of the rolling programme (2008/2009–2011/2012) London: Public Health England; 2014. [Google Scholar]
- 34.D’Agostino RB, Vasan RS, Pencina MJ, Wolf PA, Cobain M, Massaro JM, Kannel WB. General cardiovascular risk profile for use in primary care: the Framingham Heart Study. Circulation. 2008;118(4):E86. doi: 10.1161/CIRCULATIONAHA.108.190154. [DOI] [PubMed] [Google Scholar]
- 35.Goodacre S, Nicholl J, Dixon S, Cross E, Angelini K, Arnold J, Revill S, Locker T, Capewell S, Quinney D, Campbell S, Morris F. Randomised controlled trial and economic evaluation of a chest pain observation unit compared with routine care. Br. Med. J. 2004;328(7434):254–257. doi: 10.1136/bmj.37956.664236.EE. [DOI] [PMC free article] [PubMed] [Google Scholar]
- 36.Ara R, Tumur I, Pandor A, Duenas A, Williams R, Wilkinson A, Paisley S, Chilcott J. Ezetimibe for the treatment of hypercholesterolaemia: a systematic review and economic evaluation. Health Technol. Assess. 2008;12(21):3–212. doi: 10.3310/hta12210. [DOI] [PubMed] [Google Scholar]
- 37.National Institute for Health and Care Excellence . Update to the NICE technology appraisals methods guide. London: National Institute for Health and Care Excellence; 2013. [Google Scholar]
- 38.Nguyen TT. The cholesterol-lowering action of plant stanol esters. J. Nutr. 1999;129(12):2109–2112. doi: 10.1093/jn/129.12.2109. [DOI] [PubMed] [Google Scholar]
- 39.Hallikainen MA, Sarkkinen ES, Uusitupa MIJ. Plant stanol eaters affect serum cholesterol concentrations of hypercholesterolemic men and women in a dose-dependent manner. J. Nutr. 2000;130(4):767–776. doi: 10.1093/jn/130.4.767. [DOI] [PubMed] [Google Scholar]
- 40.Lin X, Racette SB, Ma L, Wallendorf M, Spearie CA, Ostlund RE., Jr Plasma biomarker of dietary phytosterol intake. Plos One. 2015;10(2):e0116912. doi: 10.1371/journal.pone.0116912. [DOI] [PMC free article] [PubMed] [Google Scholar]
- 41.NHS Choice: Lower your cholesterol. http://www.nhs.uk/Livewell/Healthyhearts/Pages/Cholesterol.aspx. Last updated: 28/07/2015
- 42.Doggrell SA. Lowering LDL cholesterol with margarine containing plant stanol/sterol esters: is it still relevant in 2011? Complement Ther. Med. 2011;19(1):37–46. doi: 10.1016/j.ctim.2010.12.004. [DOI] [PubMed] [Google Scholar]
- 43.British Heart Foundation . Economic Costs of Physical Inactivity. Loughborough: British Heart Foundation National Centre, Loughborough University; 2013. [Google Scholar]
- 44.NHS Choices. Statins-Side effects. Available: http://www.nhs.uk/Conditions/Cholesterol-lowering-medicines-statins/Pages/Side-effects.aspx Accessed 29 Sept 2017
- 45.Malachowski SJ, Quattlebaum AM, Miladinovic B. Adverse effects of statins. J. Am. Med. Assoc. 2017;317(10):1079–1080. doi: 10.1001/jama.2017.0148. [DOI] [PubMed] [Google Scholar]
- 46.Gotzsche PC. Adverse effects of Statin: muscular adverse effects are common with statins. BMJ. 2014;348:g3724. doi: 10.1136/bmj.g3724. [DOI] [PubMed] [Google Scholar]
- 47.Gupta A, Thompson D, Whitehouse A, Collier T, Dahlof B, Poulter N, Collins R, Sever P, on behalf of the ASCOT Investigators Adverse events associated with unblinded, but not with blinded, statin therapy in the Anglo-Scandinavian Cardiac Outcomes Trial—Lipid-Lowering Arm (ASCOT-LLA): a randomised double-blind placebo-controlled trial and its non-randomised non-blind extension phase. Lancet. 2017 doi: 10.1016/S0140-6736(17)31075-9. [DOI] [PubMed] [Google Scholar]
- 48.Wakefield MA, Loken B, Hornik RC. Use of mass media campaigns to change health behaviour. Lancet. 2010;376(9748):1261–1271. doi: 10.1016/S0140-6736(10)60809-4. [DOI] [PMC free article] [PubMed] [Google Scholar]
- 49.Lenzen M, Scholte op Reimer W, Norekval TM, et al. Pharmacological treatment and perceived health status during 1-year follow up in patients diagnosed with coronary artery disease, but ineligible for revascularization. Results from the euro heart survey on coronary revascularization. Eur. J. Cardiovasc. Nurs. 2006;5(2):115–121. doi: 10.1016/j.ejcnurse.2006.01.003. [DOI] [PubMed] [Google Scholar]
- 50.Kim J, Henderson RA, Pocock SJ, Clayton T, Sculpher MJ, Fox KAA. Health-related quality of life after interventional or conservative strategy in patients with unstable angina or non-ST-segment elevation myocardial infarction: one-year results of the third randomized intervention trial of unstable angina. J. Am. Coll. Cardiol. 2005;45(2):221–228. doi: 10.1016/j.jacc.2004.10.034. [DOI] [PubMed] [Google Scholar]
- 51.Lacey EA, Walters SJ. Continuing inequality: gender and social class influences on self perceived health after a heart attack. J. Epidemiol. Community. Health. 2003;57(8):622–627. doi: 10.1136/jech.57.8.622. [DOI] [PMC free article] [PubMed] [Google Scholar]
- 52.Aprile I, Di Stasio E, Tonali P, Padua L, Piazzini DB, Bertolini C. Long-term outcome after stroke evaluating health-related quality of life using utility measurement. Stroke. 2006;37(9):2218–2219. doi: 10.1161/01.STR.0000237142.71578.8b. [DOI] [PubMed] [Google Scholar]
- 53.Tengs TO, Lin TH. A meta-analysis of quality-of-life estimates for stroke. Pharmacoeconomics. 2003;21(3):191–200. doi: 10.2165/00019053-200321030-00004. [DOI] [PubMed] [Google Scholar]
- 54.Van Exel NJA, Reimer WJMS, Koopmanschap MA. Assessment of post-stroke quality of life in costeffectiveness studies: the usefulness of the barthel index and the EuroQoL-5D. Qual. Life. Res. 2004;13(2):427–433. doi: 10.1023/B:QURE.0000018496.02968.50. [DOI] [PubMed] [Google Scholar]
- 55.Leeds L, Meara J, Hobson P. The impact of discharge to a care home on longer term stroke outcomes. Clin. Rehabil. 2004;18(8):924–928. doi: 10.1191/0269215504cr807oa. [DOI] [PubMed] [Google Scholar]
- 56.Youman P, Wilson K, Harraf F, Kalra L. The economic burden of stroke in the United Kingdom. Pharmacoeconomics. 2003;21(5):43–50. doi: 10.2165/00019053-200321001-00005. [DOI] [PubMed] [Google Scholar]
- 57.Clarke P, Gray A, Legood R, Briggs A, Holman R. The impact of diabetes-related complications on healthcare costs: results from the United Kingdom prospective diabetes study (UKPDS study no. 65) Diabetic. Med. 2003;20(6):442–450. doi: 10.1046/j.1464-5491.2003.00972.x. [DOI] [PubMed] [Google Scholar]