

Abstract
Of nine ependymoma molecular groups detected by DNA methylation profiling, the posterior fossa type A (PFA) is most prevalent. We used DNA methylation profiling to look for further molecular heterogeneity among 675 PFA ependymomas. Two major subgroups, PFA-1 and PFA-2, and nine minor subtypes were discovered. Transcriptome profiling suggested a distinct histogenesis for PFA-1 and PFA-2, but their clinical parameters were similar. In contrast, PFA subtypes differed with respect to age at diagnosis, gender ratio, outcome, and frequencies of genetic alterations. One subtype, PFA-1c, was enriched for 1q gain and had a relatively poor outcome, while patients with PFA-2c ependymomas showed an overall survival at 5 years of >90%. Unlike other ependymomas, PFA-2c tumors express high levels of OTX2, a potential biomarker for this ependymoma subtype with a good prognosis. We also discovered recurrent mutations among PFA ependymomas. H3 K27M mutations were present in 4.2%, occurring only in PFA-1 tumors, and missense mutations in an uncharacterized gene, CXorf67, were found in 9.4% of PFA ependymomas, but not in other groups. We detected high levels of wildtype or mutant CXorf67 expression in all PFA subtypes except PFA-1f, which is enriched for H3 K27M mutations. PFA ependymomas are characterized by lack of H3 K27 trimethylation (H3 K27-me3), and we tested the hypothesis that CXorf67 binds to PRC2 and can modulate levels of H3 K27-me3. Immunoprecipitation / mass spectrometry detected EZH2, SUZ12, and EED, core components of the PRC2 complex, bound to CXorf67 in the Daoy cell line, which shows high levels of CXorf67 and no expression of H3 K27-me3. Enforced reduction of CXorf67 in Daoy cells restored H3 K27-me3 levels, while enforced expression of CXorf67 in HEK293T and neural stem cells reduced H3 K27-me3 levels. Our data suggest that heterogeneity among PFA ependymomas could have clinicopathologic utility and that CXorf67 may have a functional role in these tumors.
Keywords: Ependymoma, molecular heterogeneity, DNA methylation profiling, CXorf67 PRC2, H3 K27M, H3 K27-trimethylation
Introduction
Ependymomas are neuroepithelial tumors of the central nervous system (CNS), presenting in both adults and children, but accounting for almost 10% of all pediatric CNS tumors and up to 30% of CNS tumors in children under three years [4,28,40]. Increasing understanding of the genomic landscape of ependymoma and the discovery of distinct molecular groups by DNA methylation or gene expression profiling have begun to refine approaches to disease classification, but have yet to be translated into routine clinical practice [18,27,32,31,34,50,52].
Our comprehensive study of DNA methylation profiling across the entire disease demonstrated three molecular groups for each major anatomic compartment: supratentorial, posterior fossa (PF), and spinal [32]. Among PF ependymomas, two of three molecular groups, PFA (PF-EPN-A) and PFB (PF-EPN-B), account for nearly all tumors; PF-SE tumors are rare, mostly showing the morphology of a subependymoma [32]. PFA tumors are found mainly in infants and young children (median age ≈ 3yrs) and have a relatively poor outcome, while PFB tumors are generally found in young adults (median age ≈ 30yrs) and are associated with a better prognosis [32,52].
In this study, we have focused on the commonest ependymomas, those in the PFA molecular group. Two observations informed the hypotheses behind our experiments: (i) two robust subgroups of PFA ependymomas emerged in a pilot study when a series of infant ependymomas from the St. Jude RT1 trial were analyzed by DNA methylation profiling and gene expression profiling [37], and (ii) a review of published sequencing datasets for PF ependymomas revealed recurrent single nucleotide variants (SNVs) in an uncharacterized gene, CXorf67, which is expressed at high levels in PFA ependymomas [34]. Through a collaboration involving the DNA methylation profiling of 675 PFA ependymomas, we tested two broad hypotheses: (i) PFA ependymomas are heterogeneous and composed of subgroups with clinical utility and (ii) CXorf67 is implicated in the pathogenesis of PFA ependymoma.
Materials and Methods
For analysis by genome-wide DNA methylation profiling, the study series consisted of 675 PFA tumors (Table S1), nearly all from infants and young children (median age = 2.8 years). This was a multicenter collaboration between St. Jude Children’s Research Hospital (SJ), the German Cancer Research Center (DKFZ), the Hospital for Sick Children in Toronto (SK), and the University of Nottingham, England (UN-UK). The DKFZ brain tumor methylation classifier (www.molecularneuropathology.org), which is based upon a reference series of 2682 CNS tumors representing 82 distinct tumor methylation classes [6], was used to confirm that all 675 tumors were PFA ependymomas (see Experimental Procedures in Supplemental Material for further details).
DNA methylation profiling was undertaken on Illumina Infinium HumanMethylation450 arrays as previously described [32]. Copy number variation (CNV) analysis from 450K methylation array data was performed using the Conumee package, version 1.9.0 [20]. The 5000 most variable methylation probes were selected by standard deviation. Based on these probes a consensus clustering was performed using the ConsensusClusterPlus package version 1.38 [51]. Two methods were employed for gene expression profiling: transcriptome sequencing and analysis on Affymetrix U133 Plus 2.0 arrays (Supplemental Material). Amplicon sequencing across the CXorf67 coding region was undertaken for 234 PFA ependymomas (Supplemental Material). Sanger sequencing was used to screen for H3 K27M mutations in H3F3A, HIST1H3A, HIST1H3B, and HIST1H3C, as previously described [53]. Immunohistochemistry and immunoblotting employed antibodies to OTX2 (GeneTex, Inc. Irvine, CA), CXorf67 (Sigma-Aldrich, St. Louis, MO), histone H3 K27M (EMD Millipore, Millerica, MA), and EZH2 (BD Biosciences). Antibodies to ß-Actin, SUZ12, and the trimethylation mark at H3 Lys27 were from Cell Signaling Technology, Danvers, MA. Cloning and lentiviral production, CXorf67 infection studies, and CXorf67 CRISPR-Cas-9 gene editing are described in Supplemental Material. Whole cell lysates from the Daoy and U2OS cell lines and nuclear extracts from Daoy were prepared for co-immunoprecipitation and mass spectrometry as described in Supplemental Material.
For outcome analyses, progression-free survival (PFS) was defined as the interval between date of diagnosis and date of progression or death. Overall survival (OS) was defined as the interval between date of diagnosis and death. Patients without an event in PFS or OS were censored at the time of last contact. PFA and OS distributions were estimated using the Kaplan-Meier method and compared between two or more groups of patients using the log-rank test. Further statistical analysis of clinical data and the evaluation of intraoperative macroscopic pathology and assessment of abnormalities on MRI scans relating to 40 St. Jude patients are provided in Supplemental Material.
Results
Molecular heterogeneity among PFA ependymomas – two subgroups and nine subtypes
Clustering analyses of all 675 methylation profiles, using unsupervised consensus hierarchical clustering or t-distributed stochastic neighbor embedding (t-SNE) analysis [48], revealed two distinct major subgroups of PFA ependymoma, which we termed PFA-1 and PFA-2 (Fig. 1). Further heterogeneity among PFA-1 and PFA-2 ependymomas was observed with both types of clustering analysis; in total, we discovered nine minor subtypes, six within PFA-1 and three within PFA-2 (Fig. 1). In a parallel analysis, clear separation of PFA-1, PFA-2, and PFB tumors was observed when the present series was supplemented with 50 PFB ependymomas (Fig. S1). Validating the subtype data in an analysis of the cumulative distribution function (CDF) of consensus matrices (Fig. S2A), we found that nine clusters appear optimal. In a complementary analysis exploring how well PFA ependymoma subtype data correlate with clinical outcome, nine clusters again appear optimal (Fig. S2B). These findings indicate that, despite some overlap, nine clusters are most stable and clinically meaningful and that increasing the number of clusters further will not significantly improve cluster stability or risk predication. We observed no bias related to array data collected at different institutions.
Figure 1. PFA ependymomas comprise two subgroups and nine subtypes.
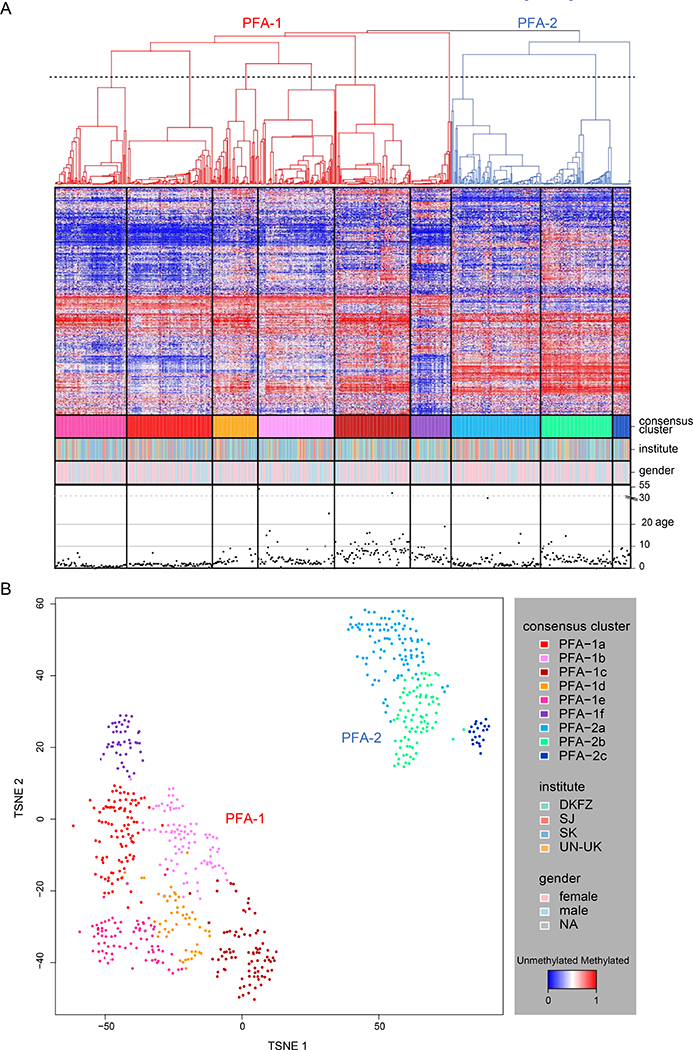
(A) Heat map representation of an unsupervised consensus hierarchical clustering of DNA methylation profiles from 675 PFA ependymomas using the 5000 most differentially methylated probes across all tumors. Each row represents a probe, and each column represents a sample. The level of DNA methylation (beta-value) is represented by a red-blue color scale, as depicted in the key (lower right). For each sample, subtype association, institutional origin, gender, and patient age (years) are provided in four rows below the heat map. Dendrograms related to the two subgroups, PFA-1 and PFA-2, are depicted in red and blue, respectively. The dotted line transecting the dendrogram represents the cut-off for nine subtypes as established through an analysis of the cumulative distribution function (see Figure S2). (B) TSNE plot of DNA methylation array data from 675 PFA ependymomas. Samples are colored according to their respective consensus cluster affiliation in Figure 1A and as shown in the key at lower right.
Gene expression profiles generated by transcriptome sequencing and derived from a subset of PFA ependymomas (n=28) also showed two distinct molecular subgroups (Fig. 2A). With a larger number of tumors analyzed by Affymetrix U133 Plus 2.0 arrays (n=79), an unsupervised analysis showed more heterogeneity (Fig. S3A), and genes specifically up-regulated or down-regulated were identified for each of the nine subtypes in a supervised analysis of these data (Fig. S2C). In a comparison of DNA methylation profiling and gene expression profiling, all ependymomas were assigned to the same subgroup, PFA-1 or PFA-2, across all three analytic platforms. Gene set enrichment analysis (GSEA) using data from Affymetrix arrays showed that PFA-1 tumors specifically activate genes involved in immune and inflammatory responses, angiogenesis and CNS patterning, while classes of genes related to the function of cilia are relatively upregulated in PFA-2 ependymomas (Fig. S3B).
Figure 2. Differential expression of genes involved at brain stem sites during CNS embryogenesis in PFA-1 and PFA-2 ependymomas.
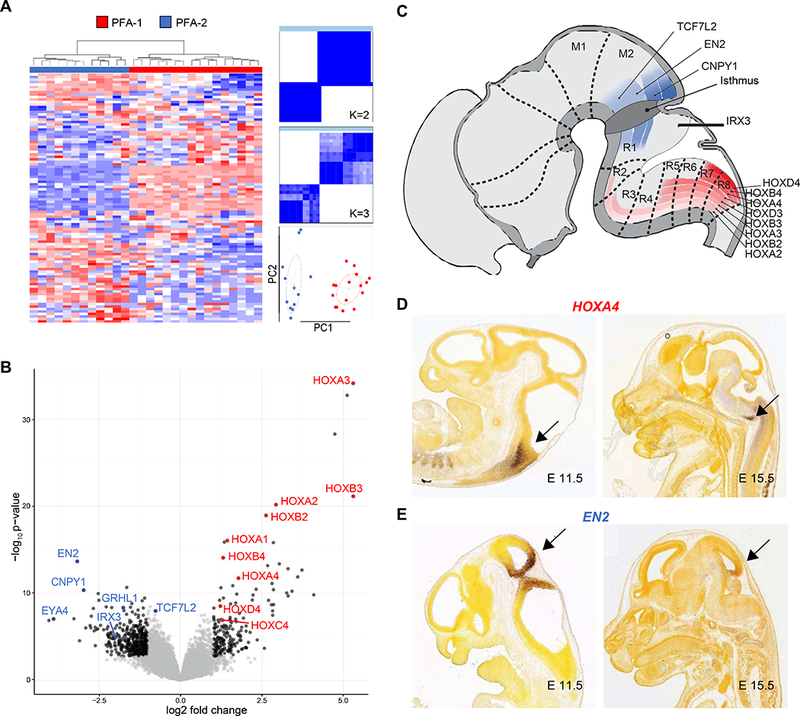
(A) Unsupervised clustering analysis of gene expression profiles generated by transcriptome sequencing on a subset of PFA ependymomas (n=28) and using the top 100 most differentially expressed genes. Consensus matrix heat maps and a principal components analysis (PCA) plot were used to demonstrate stable cluster number and two subgroups, PFA-1 and PFA-2 (PC1 & PC2 = standard deviation / dispersion ellipses). (B) Volcano plot of transcriptome sequencing data showing genes overexpressed in PFA-1 (red) and PFA-2 ependymomas (blue). Many genes overexpressed in PFA-1 tumors, relative to PFA-2 tumors, belong to the HOX family of genes that encode transcription factors involved in CNS patterning. Relatively overexpressed patterning genes in the two subgroups have actions at different levels of the brain stem during development. PFA-1 HOX genes are active in the caudal brain stem (red), while PFA-2 genes are active more rostrally, at the midbrain-hindbrain boundary (blue), illustrated diagrammatically (C), or in preparations from the Allen Brain Atlas of mouse embryogenesis (Image credit: Allen Institute), where expression levels of HOXA4 (D) and EN2 (E) are detected by in situ hybridization (arrows).
Gene expression profiling identified HOX family genes as highly expressed in PFA-1 ependymomas (Fig. 2B and Table S2). HOX genes are involved in CNS patterning during embryogenesis, and other genes with similar function, such as EN2, CNPY1, and IRX3, were highly expressed in PFA-2 ependymomas. However, EN2, CNPY1, and IRX3 are active at the midbrain-hindbrain boundary during development, while HOX genes are expressed at more caudal locations in the brain stem and spinal cord (Fig. 2C-E). These data suggest that PFA-1 and PFA-2 ependymomas could arise from cells at different anatomic locations in the hindbrain.
To investigate the potential clinical significance of a distinct histogenesis for PFA-1 and PFA-2 ependymomas, involving a cell of origin at different anatomic locations, we analyzed the operative findings and magnetic resonance imaging (MRI) characteristics at diagnosis of a subset of PFA-1 (n=23) and PFA-2 (n=17) ependymomas from the SJ cohort (Fig. S4). The likely origin of each tumor based on a combination of MRI and operative findings was the lateral recess (n=23), floor of the fourth ventricle (n=6), and roof of the fourth ventricle (n=11) [38,39,46]. Significantly more PFA-1 than PFA-2 ependymomas were located laterally (p=0.007), and the fraction of tumors with a likely origin in the roof of the fourth ventricle was significantly greater among PFA-2 than PFA-1 ependymomas (p=0.03).
Our findings confirm the hypothesis that molecular heterogeneity exists among PFA ependymomas. Two major subgroups, PFA-1 and PFA-2, appear robust on independent profiling platforms, and their expression profiles suggest a distinct histogenesis in the brain stem. Nine minor subtypes were identified among the PFA-1 and PFA-2 subgroups, and some of these have distinct clinical and genetic characteristics, as detailed below.
PFA ependymomas – clinical heterogeneity among subgroups and subtypes
In order to test the hypothesis that molecular subgroups or subtypes of PFA ependymoma have clinical utility, we analyzed the characteristics of patients and their tumors for which complete clinical data were available (n=569). Data collected from each collaborating center were comparable with respect to age at diagnosis and gender, but therapeutic approaches varied across cohorts (Table S1); frequencies for gross total resection, radiotherapy and chemotherapy ranged from 47–74%, 64–96%, and 35–91%, respectively.
Across the entire series, PFA-1 ependymomas occurred at a frequency of 69% (PFA-2; 31%), and this metric was similar for patients from different cohorts (range; 66–73%). Almost no significant differences were found when the clinical characteristics of PFA-1 and PFA-2 ependymomas were compared (Fig. S5). One exception was the pattern of relapse; PFA-1 ependymomas were associated with local and PFA-2 ependymomas with distant relapse (P=0.02). In univariate outcome analyses with all PFA tumors, clinical variables significantly associated with both PFS and OS were gender, extent of resection, and whether the patient had received radiotherapy (Table S3). When data for each subgroup were analyzed separately, variables associated with outcome among PFA-1 ependymomas were the same as those for all PFA ependymomas, perhaps reflecting the relatively high frequency of PFA-1 tumors. However, only extent of resection was significantly associated with outcome among PFA-2 ependymomas (Table S3). A comparison of the histopathologic features shown by each subgroup disclosed no differences, and this result was reflected by similar frequencies for the two applicable WHO grades (Fig. S5). Additionally, WHO grade was not associated with outcome (Table S3). Chromosome ploidy changes related to outcome were 1q gain and 6q loss (Table S3).
Molecular subtypes embedded within the two subgroups differed significantly with respect to several clinical and pathologic metrics, including a patient’s age at diagnosis, gender ratio, WHO grade, and outcome (Fig.s 3A-E). Subtypes PFA-1c, PFA-1d, and PFA-1e were associated with a particularly poor PFS and OS; PFS values at 10 years were 16%, 27%, and 22%, respectively. In contrast, patients with PFA-2c ependymomas had a 10-year PFS of 84% and a 10-year OS of 94%. PFA-2c tumors, but not ependymomas from other molecular subtypes, demonstrated high levels of OTX2 expression (Fig. 3F), suggesting that OTX2 expression could be used as an immunohistochemical prognostic biomarker for these tumors with a good prognosis (Fig. 3G).
Figure 3. Clinical and genetic heterogeneity among nine subtypes of PFA ependymoma.
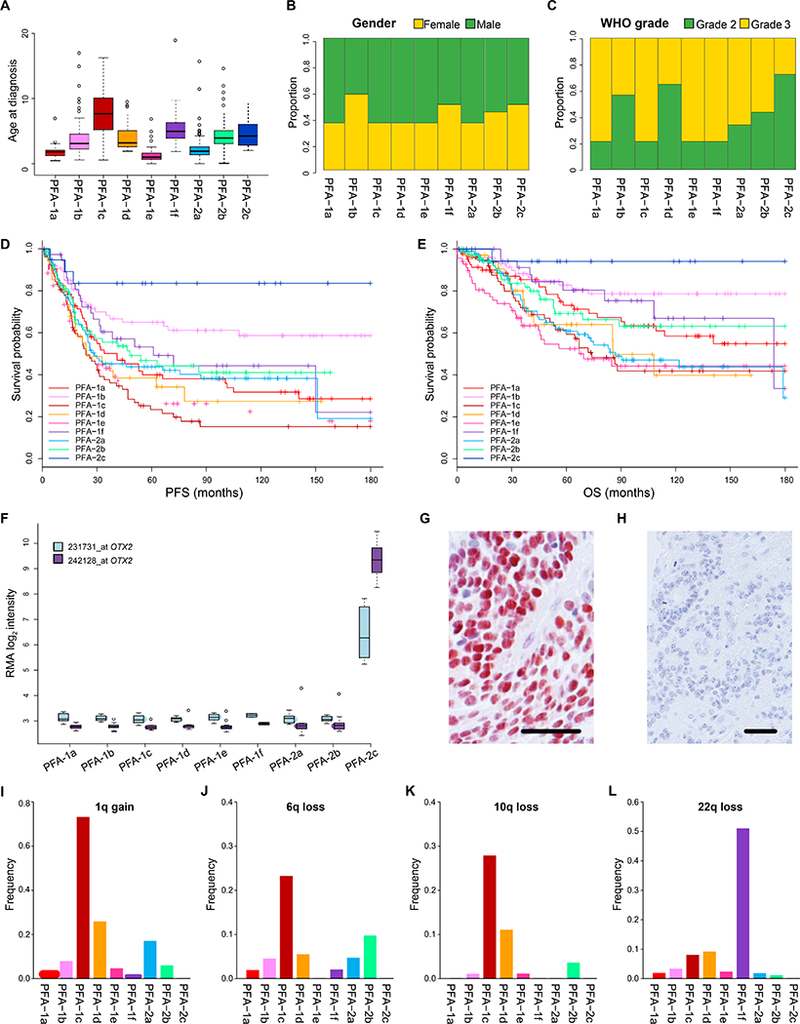
Nine subtypes of PFA ependymoma displaying variability in: (A) age at diagnosis (years), (B) gender ratio, (C) ratio of pathological grade, (D) progression-free survival (PFS), and (E) overall survival (OS). (F) Elevated OTX2 expression in PFA-2c ependymomas demonstrated by gene expression profiling (2x Affymetrix u133 v2 array probes) and immunohistochemistry (G). Immunonegative PFA ependymoma of another subtype (H). Varying frequencies across subtypes of the four commonest chromosome arm copy number alterations found in PFA ependymomas; 1q gain (I), 6q loss (J), 10q loss (K), 22q loss (L). Scale bars (G/H) = 100μm.
Three PFA subtypes were associated with a median age at diagnosis of less than two years (Fig. 3A and Table S4); PFA-1a (1.8yrs), PFA-1e (1yr), PFA-2a (1.9yrs), while two had a median age of five years or more; PFA-1c (7.7yrs), PFA-1f (5yrs). The gender ratio for the series demonstrated a predominance of male patients (1.4:1), but the ratio was reversed (<1:1) in subtypes PFA-1b, PFA-1f, and PFA-2c (Fig. 3B). WHO tumor grade also differed across subtypes. Overall, the ratio of WHO grade II to WHO grade III tumors was 1:1.7, which accords with findings from several studies [16,45,49], but across subtypes it varied from 2.7:1 (PFA-2c) to 1:4.5 (PFA-1f).
PFA ependymomas – genetic heterogeneity among subgroups and subtypes
Genome-wide CNAs were abstracted from DNA methylation profiles (Fig.s S5D-E and Fig. S6; n=669, six profiles showing too much signal scatter for satisfactory analysis). Across the entire series, no recurrent focal amplifications or losses were detected, but relatively common (frequency >5%) copy number gains or losses involving chromosome arms were: 1q gain (17.3%), 22q loss (6.9%), 6q loss (6.4%), and 10q loss (5.2%). Whole chromosome gains, especially those for chromosomes 2, 8, 9, 11, and 19, were more frequent in PFA-2 than PFA-1 ependymomas, while 1q gain, 10q loss, and 22q loss were more frequent in PFA-1 (Fig. S5).
Differences in the frequencies of common chromosome arm gain or loss were also detected among the nine PFA subtypes (Fig. 3 and Table S4). Gain of 1q is the most frequent CNA (17.3%) in PFA ependymomas (Table S4), but its frequency across subtypes is highly variable, ranging from 0% in PFA-2c to 73.3% in PFA-1c (Fig. 3I-L). The PFA-1c subtype represents 13% of PFA tumors, but incorporates 54.3% of all tumors with 1q gain. PFA-1c tumors also show relatively high frequencies of 6q loss (23.3%) and 10q loss (27.9%) and include 46.5% of all tumors with 6q loss and 68.6% of tumors with 10q loss. The frequency of 22q loss in PFA-1f ependymomas is 51.1%, representing 52.2% of all tumors with 22q loss (Fig. 3L).
Genes on 1q show a relatively higher expression in PFA-1c ependymomas than in other PFA subtypes (Fig. S7A–C). Multiple studies have proposed chromosome 1q gain as an adverse prognostic indicator in PF ependymoma [7,16,23,24,29]. In our series of PFA ependymomas, 1q gain is significantly (p<0.0001) associated with a poor outcome (Fig. S7D). Three minor subtypes with a relatively high frequency (>10%) of 1q gain (PFA-1c, PFA-1d, and PFA-2a) are associated with poor clinical outcomes, but 1q status carries no prognostic significance among tumors in each of these three subtypes (Fig. S7). Patients in the PFA-1e subtype, which have a relatively low frequency of 1q gain (4.8%), also have poor PFS and OS. Of the other relatively common CNAs in PFA ependymomas, only 6q loss is significantly associated with a poor PFS and OS, and in the PFA-1 subgroup only (Table S3). However, within the PFA-1c subtype itself, which has the highest frequency of 6q loss (23.3%), 6q status is not associated with outcome.
PFA ependymomas – recurrent CXorf67 and H3 mutations
Whole genome sequencing studies using small cohorts of ependymomas reported no recurrent SNVs or indels in PF tumors [27,26,34]. We reviewed these published sequencing datasets for novel alterations, finding recurrent mutations in CXorf67 at Xp11.22 (5 of 30 PF ependymomas; 17% [34]). Subsequent targeted sequencing of a subset of PFA tumors (n=234) disclosed a CXorf67 SNV in 22 tumors (9.4%) (Fig. 4A). Germline DNA was available from five patients whose tumors contained a CXorf67 mutation and allowed us to demonstrate that the mutations are somatic. Expression of the mutant allele was confirmed in all tumors for which matching transcriptome data were available. Half of the patients (11/22) with CXorf67-mutant tumors are male, and no other clinical or pathologic variables appear to be associated with the presence of a CXorf67 mutation. CXorf67 missense mutations are found in seven of nine subtypes at the following frequencies: PFA-1a 10.3%, PFA-1b 18.8%, PFA-1c 4.2%, PFA-1d 6.3%, PFA-1e 9.7%, PFA-2a 6.8%, and PFA-2b 12.5% (Fig. 4B and Table S4). CXorf67 mutation and 1q gain are mutually exclusive, and our data show no copy number variation at the CXorf67 locus.
Figure 4. Mutations of CXorf67 and H3 K27M in PFA ependymomas.
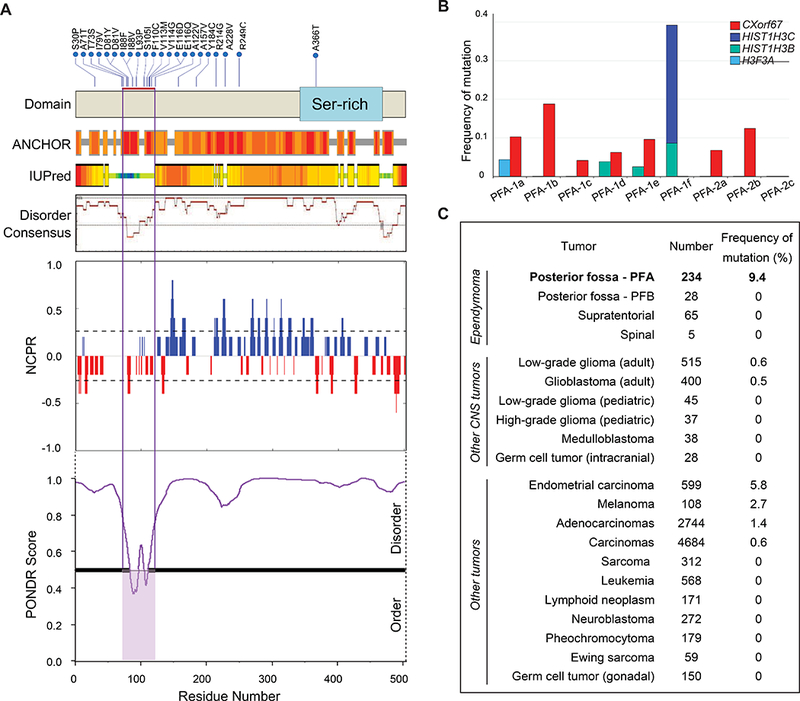
(A) Upper: CXorf67 missense SNVs (upper) detected in 22/234 (9.4%) PFA ependymomas. The red bar marks a hotspot between codons 71 and 122. Lower: In silico analysis of CXorf67 protein. Based on IUPred [10], combined disorder score by DisMeta [19], and the meta-predictor PONDR-FIT [54], CXorf67 is predicted to be largely disordered. The SNV hotspot is located within a small ordered region that is predicted by ANCHOR to be a protein-protein interaction domain [11]. The NCPR (linear net charge per residue) plot shows a net negative charge in the mutation hotspot. (B) Frequencies of CXorf67 mutation are listed for various tumors (source data are: SJ PCGP, TCGA, TARGET and dbGaP study phs000754). (C) Frequencies of CXorf67 mutation and different H3 gene mutations across PFA ependymoma subtypes.
CXorf67 is a gene of unknown function, which is expressed mainly in the nucleus. It has only one exon, and 15 of 22 mutations (68%) are concentrated in a hotspot region between codons 71 and 122 (Fig. 4A). Three codons in this hotspot, D81, I88, and E116, have SNVs present in two tumors. Based on IUPred [10], a combined disorder score by DisMeta [19], and the meta-predictor PONDR-FIT [54], CXorf67 is predicted to be an intrinsically disordered protein (Fig. 4A). However, the SNV hotspot appears to be a limited segment of relative order that is predicted by ANCHOR to be a protein-protein interaction domain [11].
No CXorf67 mutation was discovered in a screen of ependymomas belonging to other molecular groups from across the CNS, including PFB tumors. CXorf67 mutations occur rarely across a range of other cancers; only endometrial carcinomas have a mutation rate above 5% (Fig. 4C). CXorf67 mutations in PFA ependymomas are not associated with any specific clinical feature, including outcome.
A report of an H3 K27M mutation in two PFA ependymomas led us to determine the frequency of these mutations and whether they are enriched in any subtype [14]. We discovered H3 K27M mutations in 13 of 310 (4.2%) tumors. HIST1H3B (n=4) and HIST1H3C (n=7) were mutated more frequently than H3F3A (n=2). All H3 K27M mutations were found in PFA-1 ependymomas (P=0.0104), at a frequency of 6.3%, and they were enriched in PFA-1f tumors (9/13; 69%), the nine mutant tumors representing 39% of tested tumors in this subtype. The remaining four mutations occurred at lower frequencies in three other PFA-1 subtypes, PFA-1a (4.4%), PFA-1d (3.8%) and PFA-1e (2.6%). H3F3A:p.K27M mutations were detected in PFA-1a tumors (Fig. 4B). CXorf67 and H3 K27M mutations were mutually exclusive in our dataset.
A comparative analysis of PFA-1f ependymomas and diffuse midline gliomas showed that these two gliomas with H3 K27M mutations have distinct DNA methylation profiles (Fig. S8). The average age at presentation for children with HIST1H3C-mutant PFA-1f ependymomas is 6.1 years. The number of H3 mutation-positive cases with clinical data was too low for us to determine reliably, within PFA-1 subtypes, whether tumors with H3 mutations have a poorer outcome than other ependymomas with wild-type H3.
CXorf67 is highly expressed in PFA ependymomas
CXorf67 is expressed at high levels in PFA ependymomas, but not in other molecular groups of ependymoma (Fig. 5A-C). It is rarely expressed in other CNS tumors, with the exception of germinomas among CNS germ cell tumors (Fig. 5B). Elevated CXorf67 expression was evident across PFA subtypes, with the exception of PFA-1f tumors (Fig. 5C). This distinction was also observed at the protein level; PFA-1f ependymomas are practically immunonegative for CXorf67, while other subtypes show strong and widespread nuclear expression of CXorf67 (Fig. 5D-E). No difference was detected in the expression of CXorf67 between wild-type and mutant PFA tumors (Fig. 5F).
Figure 5. Expression of CXorf67 in PFA ependymomas.
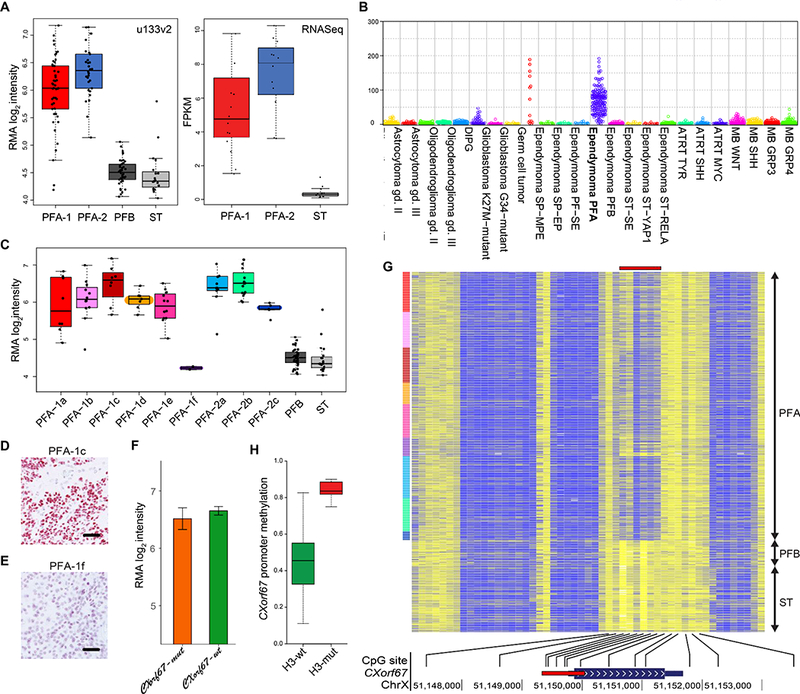
(A) Affymetrix u133v2 array and transcriptome sequencing (RNA-seq) data demonstrating significantly higher CXorf67 expression in PFA than in PFB or supratentorial (ST) ependymomas (Affymetrix u133 data, p=3×10–29 Welch ANOVA; RNA-seq data, p=4×10⁻⁹, Welch ANOVA). (B) CXorf67 expression at the RNA level in different types and molecular groups of CNS tumor (data derived from DKFZ cohorts). (C) CXorf67 expression at the RNA level (Affymetrix u133v2 array data) across PFA subtypes and in PFB or ST ependymomas. PFA-1f tumors express CXorf67 at the same level as PFB and ST tumors, significantly different (p=7×10–18, Welch ANOVA) from other PFA tumors. (D) Strong CXorf67 immunoreactivity in a PFA-1c tumor. (E) Negligible CXorf67 expression in a PFA-1f ependymoma that has an H3 K27M mutation. (F) Almost identical expression levels of CXorf67 (Affymetrix u133v2 array data) in PFA ependymomas with or without a CXorf67 mutation (p=0.51 Welch t-test). (G) Heat map of methylation at CpG sites across the CXorf67 gene demonstrating relative hypomethylation (blue) in the promoter region (red bar) for PFA ependymomas, but relative hypermethylation (yellow) at the same sites for PFB / ST ependymomas. (H) Significantly higher CXorf67 promoter region methylation in H3-mutant tumors than in H3-wildtype tumors – average beta for 6 probes (p=3×10–13 Welch t-test). Scale bars (D/E) = 100μm.
High levels of CXorf67 expression in PFA ependymomas were generally associated with CXorf67 promoter region hypomethylation (Fig. 5G). However, a comparison of H3-wildtype and H3-mutant PFA ependymomas showed significantly higher levels of CXorf67 promoter region methylation in H3-mutant tumors (Fig. 5H). H3-mutant tumors were enriched in the PFA-1f subtype, which shows relatively low levels of CXorf67 expression at the level of RNA or protein.
CXorf67 binds to Polycomb Repressive Complex 2 (PRC2) and reduces levels of H3 K27-trimethylation
An important epigenetic alteration and hallmark of PFA ependymomas is a markedly reduced level of H3 K27-trimethylation (H3 K27-me3) [2,33]. In the setting of another PF glioma of childhood, the diffuse pontine glioma, an H3 K27M mutation produces a global reduction of the repressive histone mark H3 K27-me3 in 70% of tumors [3,35,53]. The presence of H3 K27M mutations in a small proportion (4.2%) of PFA ependymomas characterized by low levels of CXorf67 and CXorf67 promoter region hypermethylation, when H3-wildtype PFA ependymomas show the reverse, led us to ask whether CXorf67 binds to Polycomb Repressive Complex 2 (PRC2) and can influence cellular levels of H3 K27-me3.
CXorf67 is highly expressed in the non-ependymoma tumor cell lines Daoy and U2-OS (on-line data). Having confirmed this by transcriptome sequencing and immunoblotting, we undertook immunoprecipitation (IP) studies followed by mass spectrometry (MS) to show that CXorf67 binds to the three core components of PRC2: EZH2, SUZ12, and EED (Fig. 6A). Subsequent IP/MS data, which were generated from protein lysates of Daoy cell nuclei and utilized anti-CXorf67, anti-SUZ12, and anti-EZH2 antibodies for IP, confirmed these findings. Combined in a 3-D SAINT plot (Fig. 6B), our data reveal other proteins that interact with CXorf67, and which are closely related to PRC2 or its functions, including EZH1, RBBP4, and RBBP7 (Fig. 6B and Table S5). Additionally, we used the PFA ependymoma cell line EPD210FH, which was confirmed to express CXorf67 and to have low levels of H3 K27-me3 (Fig. 6D), for an IP study with an anti-CXorf67 antibody and showed that CXorf67 interacts with EZH2 and SUZ12 (Fig. 6E).
Figure 6. CXorf67 binds core elements of PRC2.
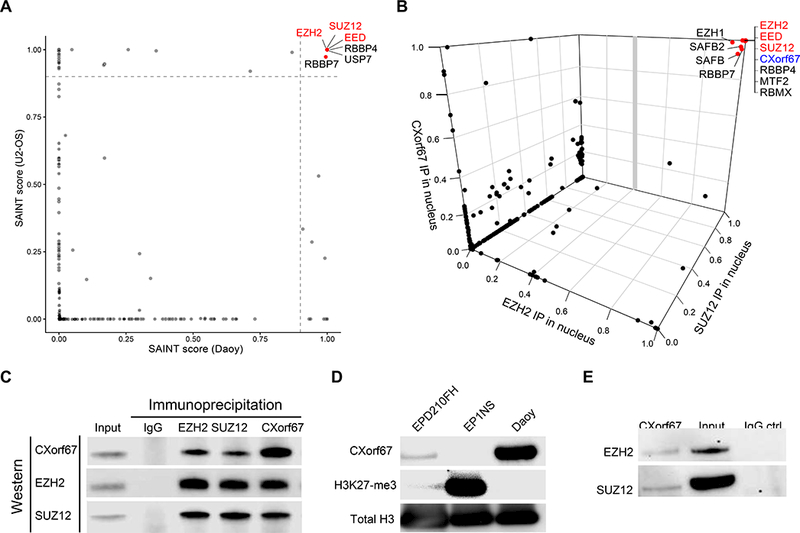
(A) A 2-D SAINT plot from data generated by immunoprecipitation (IP) / mass spectrometry (MS) and using an anti-CXorf67 antibody against protein lysates from two cell lines, Daoy and U2-OS, which express high levels of CXorf67. (B) A 3-D SAINT plot from data generated by IP / MS and using anti-CXorf67, anti-EZH2, and anti-SUZ12 antibodies against protein lysates of nuclear extracts from Daoy (see also Table S5). Both SAINT plots show that CXorf67 binds to EZH2, SUZ12, and EED, the three core elements of PRC2, as well as to other proteins related to the PRC2 complex. (C) Composite image of immunoblotting lysates used in IP / MS to generate the 3-D SAINT plot. Anti-CXorf67, anti-EZH2, and anti-SUZ12 antibodies were used to pull down and then detect proteins in the nuclear fraction of Daoy cells. (D) Immunoblot showing that the PFA ependymoma cell line, EPD210FH, expresses CXorf67, but not H3 K27-me3, in contrast to the RELA fusion-positive ependymoma cell line, EP1NS. (E) IP with an anti-CXorf67 antibody on lysates from EPD210FH demonstrating interactions between CXorf67 and EZH2 and SUZ12.
Neural stem cells (NSCs) and the HEK293 cell line express negligible amounts of CXorf67 and high levels of H3 K27-me3. Lentiviral infection of NSCs and HEK293 cells with a viral construct expressing wildtype CXorf67 produced a reduction in H3 K27-me3 levels, which we could demonstrate by immunofluorescence and immunoblotting (Fig. 7). Reduced H3 K27-me3 levels in both cell lines were associated with increased H3 K27-acetylation (Fig. 7B-C). Lentiviral infection with constructs containing three mutant variants of CXorf67 produced the same effect on H3 K27-me3. The three mutant variants were SNVs found in our series of PFA ependymomas; two within and one outside the hotspot region (T73S, I88F, Y184C).
Figure 7. Expression of CXorf67 reduces H3 K27-me3 in HEK293 and NSCs and eliminating CXorf67 restores H3 K27-me3 in Daoy cells.
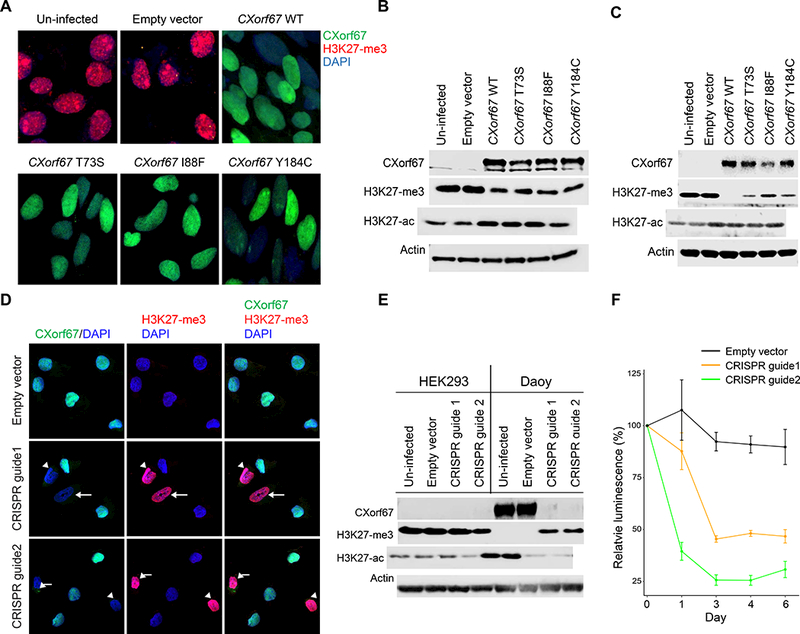
(A) Reduced H3 K27-me3 in HEK293 cells infected with a lentiviral vector expressing wildtype or mutant CXorf67. The population of infected HEK293 cells was enriched by flow sorting, and dual immunofluorescence with antibodies to CXorf67 (green) and H3 K27-me3 (red) demonstrates a reciprocal relationship between levels of these two proteins (DAPI – blue). (B) Immunoblotting of cell lysates from the experimental conditions in Figure 7A. A reduction of H3 K27-me3 follows expression of wildtype or mutant CXorf67. An increase in H3 K27-acetylation (H3 K27-ac) is evident following CXorf67 expression. (C) Immunoblotting showing similar results in neural stem cells infected with wildtype or mutant CXorf67. A reduction of H3 K27-me3 follows expression of wildtype or mutant CXorf67 and a slight increase in H3 K27-ac is evident following CXorf67 expression. (D) Daoy cells carrying vector with or without CRISPR guide 1 or 2. With an empty vector, Daoy cells express CXorf67, but not H3 K27-me3. Introduction of either CRISPR guide into some cells produces combined lack of CXorf67 expression and elevated H3 K27-me3 expression (arrows). (E) In Daoy cells flow-sorted to contain only those infected with vector, immunoblotting confirms knock-out of CXorf67 in those containing either CRISPR guide. Concomitantly, H3 K27-me3 expression is restored, while H3 K27-ac is reduced. HEK293 cells are included as a control (composite image from blots run in parallel). Elimination of CXorf67 expression reduced the growth of Daoy cells by more than half, as illustrated by a change in relative luminescence (F).
A CRISPR-Cas9 strategy was used to delete CXorf67 from Daoy cells. In immunofluorescence preparations, cells without detectable CXorf67 showed an increase in H3 K27-me3 levels, and these changes were replicated by immunoblotting (Fig. 7 D, E). Subsequently, flow sorting of Daoy provided us with cells enriched for those with deleted CXorf67, and these cultures showed a significant decrease in cell growth (Fig. 7F).
Discussion
The present study aimed to discover molecular heterogeneity of potential clinical and biological relevance among PFA ependymomas, and DNA methylation profiling yielded two subgroups and nine subtypes. PFA-1 and PFA-2 ependymomas exhibit expression profiles that suggest an origin in progenitor cells at different levels of the brain stem [1,17,36,42], and in our imaging analysis of 40 PFA ependymomas some radiologic features were preferentially associated with each subgroup. PFA-1 and PFA-2 ependymomas present at the same age and have a similar gender ratio, but show different patterns of relapse and are associated with different prognostic indicators. The two subgroups appear genetically distinct, demonstrating different patterns of chromosomal loss and gain. Additionally, we found that PFA-1 ependymomas have a much higher frequency of 1q gain, the commonest ploidy change in PF ependymomas and a biomarker of poor outcome [12,7,16,29], and that only PFA-1 tumors have H3 K27M mutations.
Several PFA subtypes emerged with particular clinical or molecular characteristics. PFA-1c, PFA-1f, and PFA-2c stand out as being distinctive for: their older age at presentation and high frequency of 1q gain (PFA-1c), a high frequency of H3 K27M mutations and low levels of CXorf67 expression (PFA-1f), and a good prognosis and high levels of OTX2 expression (PFA-2c). However, heatmaps and TSNE plots generated from DNA methylation profiling show that some subtypes separate more clearly than others. For example, PFA-1f and PFA-2c, with their distinctive clinical or genetic features, demonstrate more discrete profiles than PFA-1a and PFA-1e, which have similar clinical and genetic features. Ultimately, the more discrete clusters of tumors with clear clinical and biological associations could be taken forward into more refined tumor classifications based around molecular characteristics.
Identification of PFA-2c ependymomas will have clinical utility if its good prognosis in our study can be replicated in prospective clinical trials. Overexpressed in PFA-2c ependymomas, OTX2 is a transcription factor with roles in CNS development, including at the midbrain-hindbrain boundary [9]. In disease, it is implicated in malformations of the CNS and eye and in the pathogenesis of medulloblastoma. Expression of OTX2 is elevated in WNT, Group 3, and Group 4 medulloblastomas. However, its expression is highest in Group 3 tumors, in which OTX2 is consistently found at active enhancers and is implicated in chromatin remodeling [5]. OTX2 is also implicated as a key regulator in the TYR group of atypical teratoid rhabdoid tumors [21]. However, while increased OTX2 expression appears to be a feature of three different high-grade CNS tumors of childhood, any role for OTX2 in ependymoma has yet to be defined.
Contrary to the prevailing view, which asserts that PF ependymomas lack recurrent mutations, we have shown that ependymomas in the PFA molecular group harbor recurrent SNVs in histone H3 genes and an uncharacterized gene, CXorf67. Recent reports of rare PF ependymomas with an H3 K27M mutation have been published [14,41], but our data have established the frequency of these mutations in PFA ependymomas (4.2%) and shown that they are restricted to PFA-1 tumors, at a frequency of 6.3%, and occur at high frequency (39%) in PFA-1f ependymomas. Initially thought to be specific for pediatric midline high-grade gliomas, H3 K27M mutations have now been reported in adult gliomas and at low frequency in an increasing range of CNS tumors, including some low-grade gliomas and glioneuronal tumors, as well as ependymomas [14,15,22,55]. Review of our previously reported genomic data on ependymomas revealed no H3 K27M mutations in supratentorial or PFB tumors [27,34].
Recurrent mutations at a frequency of almost 10% in PFA ependymomas were discovered in CXorf67, a single-exon gene at Xp11.22, which encodes a protein of unknown function. The human gene’s mRNA contains 1939 bases (open reading frame, 1512 bases), producing a 51.9kD protein of 503 amino acids. It shows no sequence elements in common with other proteins across the human genome. CXorf67 is poorly conserved throughout evolution; the proportions of residues that the human gene shares with those of gorillas, chimpanzees, and mice are 97%, 85%, and 39%, respectively. Genes that evolve rapidly, showing relatively low levels of sequence similarity across species, are often involved in sexual reproduction [44], and oocytes, placenta, and testis are the only adult tissues in which CXorf67 expression is detected [47]. CXorf67 is also expressed at high levels during pre-implantation embryonic development, but levels decrease considerably by the blastocyst stage.
Mining various genomic databases, we found a relatively low frequency of CXorf67 SNVs or indels in a few tumor types and none in most. Also, there was no concentration of mutations in one ‘hotspot’ region of the gene, as we see for CXorf67 in PFA ependymomas. There is only one report of a CXorf67 alteration in the literature. Dewaele et al. found an MBTD1-CXorf67 fusion in two endometrial stromal sarcomas [8]. Endometrial stromal sarcomas are rare, accounting for less than 10% of uterine sarcomas, and are included among the family of endometrial stromal tumors (ESTs). ESTs frequently contain chromosomal translocations. The most common, t(7;17)(p15;q21), creates a JAZF1-SUZ12 fusion, and other fusions in ESTs involve PHF1 [30]; thus, fusion gene partners are either part of the PRC2 complex or involved in its functions. The JAZF1-SUZ12 fusion modulates PRC2 activity, decreasing levels of H3 K27-me3 in ESTs [25]. The reported MBTD1-CXorf67 fusion results in a greatly enhanced expression of the 3’ region of CXorf67 and a truncated protein that lacks the initial 254 (of 503) amino acids but retains a serine-rich region. While the functions of CXorf67 are unknown, its protein product is predicted in silico to be intrinsically disordered. There is a folded domain towards the N-terminus, between residues 70 and 125, and it is notable that most mutations in PFA ependymomas occur in this region, which is less disordered than elsewhere.
Wild-type CXorf67 is generally expressed at high levels in PFA ependymomas, but not in ependymomas from other molecular groups. Various datasets show that only germinomas among many other cancers express CXorf67 at similar levels to those in PFA ependymomas; but germinomas do not appear to have CXorf67 mutations. Increased expression of CXorf67 in ependymomas and germinomas is associated with promoter region hypomethylation, a phenomenon not seen in multiple other tumor types across the PCGP and The Cancer Genome Atlas (TCGA) datasets [13].
A key distinction between PFA and PFB ependymomas relates to the status of H3 K27-me3, a histone mark on the tail of H3 proteins incorporated into nucleosomes [33]. Levels of H3 K27-me3 are high in PFB tumors, but low enough in PFA tumors that immunoreactivity for H3 K27-me3 is undetectable. Similarly low levels of H3 K27-me3 are found in most diffuse pontine gliomas and are associated with H3 K27M mutations [43,53]. H3 K27M-mutant PFA ependymomas are rare, but these tumors are characterized by relatively low levels of CXorf67 and hypermethylation of the gene’s promoter region. In sharp contrast, H3-wildtype PFA ependymomas express high levels of CXorf67, which are associated with a relatively hypomethylated promoter region of the gene. Because a fusion gene involving CXorf67 has been described in ESTs, and other alterations in these tumors, mainly structural variants, involve genes that are associated with the functions of PRC2, we hypothesized that, in PFA ependymomas, CXorf67 can bind to PRC2 and modulate levels of H3 K27-me3. We have shown in IP studies that CXorf67 is associated with the core elements of PRC2, though it is unclear whether CXorf67 binds to one of the three core proteins. In further studies of CXorf67’s function, we modulated levels of CXorf67 in three cell lines, HEK293 and neural stem cells, which do not express CXorf67 and have high levels of H3 K27-me3, and Daoy cells, which have markedly reduced H3 K27-me3 and express CXorf67 at levels comparable to those seen in PFA ependymomas. Expression of CXorf67 in HEK293 cells reduced levels of H3 K27-me3, as it also did in neural stem cells. In contrast, a CRISPR-Cas approach to knock out CXorf67 in Daoy cells resulted in the restoration of H3 K27-me3. While mutant CXorf67 has a similar effect to the wildtype protein, modulating H3 K27-me3, a CXorf67 mutation does not further enhance expression of the gene at the RNA level.
Our findings suggest that high levels of CXor67 in PFA ependymomas might lead to reduced H3 K27-me3, a hallmark of PFA ependymomas, by binding to the core components of PRC2 and inhibiting EZH2, which generates H3 K27-me3 through its role as a methyltransferase. This process only operates in H3-wildtype PFA ependymomas. In rare PFA ependymomas with an H3 K27M mutation, CXorf67 expression is low and not apparently needed to inhibit EZH2; instead, EZH2 is trapped and inhibited by H3 K27M [3,43,53].
The data described in this manuscript reveal the molecular and clinical heterogeneity of PFA ependymomas. On the basis of their expression profiles, subgroups PFA-1 and PFA-2 might have distinct histogenetic origins, while some PFA subtypes are characterized by distinctive clinical or genetic characteristics of potential relevance to clinical practice. Our findings suggest that dysregulated CXorf67 and mutated H3 proteins have central and complementary roles in defining the epigenetic status of PFA ependymomas, raising the possibility of therapeutically targeting CXorf67 or elements of PRC2.
Ethical approval
All procedures performed in studies involving human participants were in accordance with the ethical standards of the institutional and/or national research committee and with the 1964 Helsinki declaration and its later amendments or comparable ethical standards. For this type of study formal consent is not required.
Supplementary Material
Acknowledgements
Support at St. Jude was provided by the American Lebanese Syrian Associated Charities and by NCI grants CA-96832 (to M.R.) and CA096832–13 (to D.W.E.). The work was supported by the CERN Research Fellowship (to K.W.P.), the ICGC PedBrain Tumour Project funded by the German Cancer Aid (109252) and the German Federal Ministry of Education and Research (to S.M.P.), the KIKA grant (#90) (to M.K.). Support at the University of Nottingham was provided by ‘Fighting Ependymoma’ and the ‘Connie and Albert Taylor Trust’.
References
- 1.Alexander T, Nolte C, Krumlauf R (2009) Hox genes and segmentation of the hindbrain and axial skeleton. Annu Rev Cell Dev Biol 25:431–456. doi: 10.1146/annurev.cellbio.042308.113423 [DOI] [PubMed] [Google Scholar]
- 2.Bayliss J, Mukherjee P, Lu C, Jain SU, Chung C, Martinez D, et al. (2016) Lowered H3K27me3 and DNA hypomethylation define poorly prognostic pediatric posterior fossa ependymomas. Science translational medicine 8:366ra161. doi: 10.1126/scitranslmed.aah6904 [DOI] [PMC free article] [PubMed] [Google Scholar]
- 3.Bender S, Tang Y, Lindroth AM, Hovestadt V, Jones DT, Kool M, et al. (2013) Reduced H3K27me3 and DNA hypomethylation are major drivers of gene expression in K27M mutant pediatric high-grade gliomas. Cancer Cell 24:660–672. doi: 10.1016/j.ccr.2013.10.006 [DOI] [PubMed] [Google Scholar]
- 4.Bouffet E, Tabori U, Huang A, Bartels U (2009) Ependymoma: lessons from the past, prospects for the future. Childs Nerv Syst 25:1383–1384. doi: 10.1007/s00381-009-0915-6 [DOI] [PubMed] [Google Scholar]
- 5.Boulay G, Awad ME, Riggi N, Archer TC, Iyer S, Boonseng WE, et al. (2017) OTX2 Activity at Distal Regulatory Elements Shapes the Chromatin Landscape of Group 3 Medulloblastoma. Cancer discovery 7:288–301. doi: 10.1158/2159-8290.CD-16-0844 [DOI] [PMC free article] [PubMed] [Google Scholar]
- 6.Capper D, Jones DTW, Sill M, Hovestadt V, Schrimpf D, Sturm D, et al. (2018) DNA methylation-based classification of central nervous system tumours. Nature 555:469–474. doi: 10.1038/nature26000 [DOI] [PMC free article] [PubMed] [Google Scholar]
- 7.Carter M, Nicholson J, Ross F, Crolla J, Allibone R, Balaji V, et al. (2002) Genetic abnormalities detected in ependymomas by comparative genomic hybridisation. Br J Cancer 86:929–939 [DOI] [PMC free article] [PubMed] [Google Scholar]
- 8.Dewaele B, Przybyl J, Quattrone A, Finalet Ferreiro J, Vanspauwen V, Geerdens E, et al. (2014) Identification of a novel, recurrent MBTD1-CXorf67 fusion in low-grade endometrial stromal sarcoma. Int J Cancer 134:1112–1122. doi: 10.1002/ijc.28440 [DOI] [PubMed] [Google Scholar]
- 9.Di Giovannantonio LG, Di Salvio M, Omodei D, Prakash N, Wurst W, Pierani A, et al. (2014) Otx2 cell-autonomously determines dorsal mesencephalon versus cerebellum fate independently of isthmic organizing activity. Development 141:377–388. doi: 10.1242/dev.102954 [DOI] [PubMed] [Google Scholar]
- 10.Dosztanyi Z, Csizmok V, Tompa P, Simon I (2005) IUPred: web server for the prediction of intrinsically unstructured regions of proteins based on estimated energy content. Bioinformatics 21:3433–3434. doi: 10.1093/bioinformatics/bti541 [DOI] [PubMed] [Google Scholar]
- 11.Dosztanyi Z, Meszaros B, Simon I (2009) ANCHOR: web server for predicting protein binding regions in disordered proteins. Bioinformatics 25:2745–2746. doi: 10.1093/bioinformatics/btp518 [DOI] [PMC free article] [PubMed] [Google Scholar]
- 12.Dyer S, Prebble E, Davison V, Davies P, Ramani P, Ellison D, et al. (2002) Genomic imbalances in pediatric intracranial ependymomas define clinically relevant groups. Am J Pathol 161:2133–2141 [DOI] [PMC free article] [PubMed] [Google Scholar]
- 13.Gao J, Aksoy BA, Dogrusoz U, Dresdner G, Gross B, Sumer SO, et al. (2013) Integrative analysis of complex cancer genomics and clinical profiles using the cBioPortal. Science signaling 6:pl1. doi: 10.1126/scisignal.2004088 [DOI] [PMC free article] [PubMed] [Google Scholar]
- 14.Gessi M, Capper D, Sahm F, Huang K, von Deimling A, Tippelt S, et al. (2016) Evidence of H3 K27M mutations in posterior fossa ependymomas. Acta Neuropathol 132:635–637. doi: 10.1007/s00401-016-1608-3 [DOI] [PubMed] [Google Scholar]
- 15.Gessi M, Gielen GH, Dreschmann V, Waha A, Pietsch T (2015) High frequency of H3F3A (K27M) mutations characterizes pediatric and adult high-grade gliomas of the spinal cord. Acta Neuropathol 130:435–437. doi: 10.1007/s00401-015-1463-7 [DOI] [PubMed] [Google Scholar]
- 16.Godfraind C, Kaczmarska JM, Kocak M, Dalton J, Wright KD, Sanford RA, et al. (2012) Distinct disease-risk groups in pediatric supratentorial and posterior fossa ependymomas. Acta Neuropathol 124:247–257. doi: 10.1007/s00401-012-0981-9 [DOI] [PMC free article] [PubMed] [Google Scholar]
- 17.Hirate Y, Okamoto H (2006) Canopy1, a novel regulator of FGF signaling around the midbrain-hindbrain boundary in zebrafish. Curr Biol 16:421–427. doi: 10.1016/j.cub.2006.01.055 [DOI] [PubMed] [Google Scholar]
- 18.Hoffman LM, Donson AM, Nakachi I, Griesinger AM, Birks DK, Amani V, et al. (2014) Molecular sub-group-specific immunophenotypic changes are associated with outcome in recurrent posterior fossa ependymoma. Acta Neuropathol 127:731–745. doi: 10.1007/s00401-013-1212-8 [DOI] [PMC free article] [PubMed] [Google Scholar]
- 19.Huang YJ, Acton TB, Montelione GT (2014) DisMeta: a meta server for construct design and optimization. Methods Mol Biol 1091:3–16. doi: 10.1007/978-1-62703-691-7_1 [DOI] [PMC free article] [PubMed] [Google Scholar]
- 20.Huber W, Carey VJ, Gentleman R, Anders S, Carlson M, Carvalho BS, et al. (2015) Orchestrating high-throughput genomic analysis with Bioconductor. Nat Methods 12:115–121. doi: 10.1038/nmeth.3252 [DOI] [PMC free article] [PubMed] [Google Scholar]
- 21.Johann PD, Erkek S, Zapatka M, Kerl K, Buchhalter I, Hovestadt V, et al. (2016) Atypical Teratoid/Rhabdoid Tumors Are Comprised of Three Epigenetic Subgroups with Distinct Enhancer Landscapes. Cancer Cell 29:379–393. doi: 10.1016/j.ccell.2016.02.001 [DOI] [PubMed] [Google Scholar]
- 22.Joyon N, Tauziede-Espariat A, Alentorn A, Giry M, Castel D, Capelle L, et al. (2017) K27M mutation in H3F3A in ganglioglioma grade I with spontaneous malignant transformation extends the histopathological spectrum of the histone H3 oncogenic pathway. Neuropathol Appl Neurobiol 43:271–276. doi: 10.1111/nan.12329 [DOI] [PubMed] [Google Scholar]
- 23.Kilday JP, Mitra B, Domerg C, Ward J, Andreiuolo F, Osteso-Ibanez T, et al. (2012) Copy number gain of 1q25 predicts poor progression-free survival for pediatric intracranial ependymomas and enables patient risk stratification: a prospective European clinical trial cohort analysis on behalf of the Children’s Cancer Leukaemia Group (CCLG), Societe Francaise d’Oncologie Pediatrique (SFOP), and International Society for Pediatric Oncology (SIOP). Clin Cancer Res 18:2001–2011. doi: 10.1158/1078-0432.CCR-11-2489 [DOI] [PubMed] [Google Scholar]
- 24.Korshunov A, Witt H, Hielscher T, Benner A, Remke M, Ryzhova M, et al. (2010) Molecular staging of intracranial ependymoma in children and adults. J Clin Oncol 28:3182–3190. doi:JCO.2009.27.3359 [DOI] [PubMed] [Google Scholar]
- 25.Ma X, Wang J, Wang J, Ma CX, Gao X, Patriub V, et al. (2017) The JAZF1-SUZ12 fusion protein disrupts PRC2 complexes and impairs chromatin repression during human endometrial stromal tumorogenesis. Oncotarget 8:4062–4078. doi: 10.18632/oncotarget.13270 [DOI] [PMC free article] [PubMed] [Google Scholar]
- 26.Mack SC, Pajtler KW, Chavez L, Okonechnikov K, Bertrand KC, Wang X, et al. (2018) Therapeutic targeting of ependymoma as informed by oncogenic enhancer profiling. Nature 553:101–105. doi: 10.1038/nature25169 [DOI] [PMC free article] [PubMed] [Google Scholar]
- 27.Mack SC, Witt H, Piro RM, Gu L, Zuyderduyn S, Stutz AM, et al. (2014) Epigenomic alterations define lethal CIMP-positive ependymomas of infancy. Nature 506:445–450. doi: 10.1038/nature13108 [DOI] [PMC free article] [PubMed] [Google Scholar]
- 28.McGuire CS, Sainani KL, Fisher PG (2009) Incidence patterns for ependymoma: a surveillance, epidemiology, and end results study. J Neurosurg 110:725–729. doi: 10.3171/2008.9.JNS08117 [DOI] [PubMed] [Google Scholar]
- 29.Mendrzyk F, Korshunov A, Benner A, Toedt G, Pfister S, Radlwimmer B, et al. (2006) Identification of gains on 1q and epidermal growth factor receptor overexpression as independent prognostic markers in intracranial ependymoma. Clin Cancer Res 12:2070–2079. doi:12/7/2070 [pii] 10.1158/1078-0432.CCR-05-2363 [DOI] [PubMed] [Google Scholar]
- 30.Micci F, Panagopoulos I, Bjerkehagen B, Heim S (2006) Consistent rearrangement of chromosomal band 6p21 with generation of fusion genes JAZF1/PHF1 and EPC1/PHF1 in endometrial stromal sarcoma. Cancer Res 66:107–112. doi: 10.1158/0008-5472.CAN-05-2485 [DOI] [PubMed] [Google Scholar]
- 31.Pajtler KW, Mack SC, Ramaswamy V, Smith CA, Witt H, Smith A, et al. (2017) The current consensus on the clinical management of intracranial ependymoma and its distinct molecular variants. Acta Neuropathol 133:5–12. doi: 10.1007/s00401-016-1643-0 [DOI] [PMC free article] [PubMed] [Google Scholar]
- 32.Pajtler KW, Witt H, Sill M, Jones DT, Hovestadt V, Kratochwil F, et al. (2015) Molecular Classification of Ependymal Tumors across All CNS Compartments, Histopathological Grades, and Age Groups. Cancer Cell 27:728–743. doi: 10.1016/j.ccell.2015.04.002 [DOI] [PMC free article] [PubMed] [Google Scholar]
- 33.Panwalkar P, Clark J, Ramaswamy V, Hawes D, Yang F, Dunham C, et al. (2017) Immunohistochemical analysis of H3K27me3 demonstrates global reduction in group-A childhood posterior fossa ependymoma and is a powerful predictor of outcome. Acta Neuropathol 134:705–714. doi: 10.1007/s00401-017-1752-4 [DOI] [PMC free article] [PubMed] [Google Scholar]
- 34.Parker M, Mohankumar KM, Punchihewa C, Weinlich R, Dalton JD, Li Y, et al. (2014) C11orf95-RELA fusions drive oncogenic NF-kappaB signalling in ependymoma. Nature 506:451–455. doi: 10.1038/nature13109 [DOI] [PMC free article] [PubMed] [Google Scholar]
- 35.Piunti A, Hashizume R, Morgan MA, Bartom ET, Horbinski CM, Marshall SA, et al. (2017) Therapeutic targeting of polycomb and BET bromodomain proteins in diffuse intrinsic pontine gliomas. Nat Med 23:493–500. doi: 10.1038/nm.4296 [DOI] [PMC free article] [PubMed] [Google Scholar]
- 36.Puelles E, Acampora D, Lacroix E, Signore M, Annino A, Tuorto F, et al. (2003) Otx dose-dependent integrated control of antero-posterior and dorso-ventral patterning of midbrain. Nat Neurosci 6:453–460. doi: 10.1038/nn1037 [DOI] [PubMed] [Google Scholar]
- 37.Punchihewa C, Lee R, Lin T, Orisme W, Dalton J, Aronica E, et al. (2014) Pediatric posterior fossa ependymomas consist of two molecular subgroups defined by gene expression and methylation profiling. Neuro Oncol 16:EM-011 [Google Scholar]
- 38.Raybaud C (2016) MR assessment of pediatric hydrocephalus: a road map. Childs Nerv Syst 32:19–41. doi: 10.1007/s00381-015-2888-y [DOI] [PubMed] [Google Scholar]
- 39.Raybaud C, Ramaswamy V, Taylor MD, Laughlin S (2015) Posterior fossa tumors in children: developmental anatomy and diagnostic imaging. Childs Nerv Syst 31:1661–1676. doi: 10.1007/s00381-015-2834-z [DOI] [PubMed] [Google Scholar]
- 40.Rodriguez D, Cheung MC, Housri N, Quinones-Hinojosa A, Camphausen K, Koniaris LG (2009) Outcomes of malignant CNS ependymomas: an examination of 2408 cases through the Surveillance, Epidemiology, and End Results (SEER) database (1973–2005). J Surg Res 156:340–351. doi:S0022-4804(09)00219-4 [DOI] [PMC free article] [PubMed] [Google Scholar]
- 41.Ryall S, Guzman M, Elbabaa SK, Luu B, Mack SC, Zapotocky M, et al. (2017) H3 K27M mutations are extremely rare in posterior fossa group A ependymoma. Childs Nerv Syst 33:1047–1051. doi: 10.1007/s00381-017-3481-3 [DOI] [PubMed] [Google Scholar]
- 42.Sgaier SK, Lao Z, Villanueva MP, Berenshteyn F, Stephen D, Turnbull RK, et al. (2007) Genetic subdivision of the tectum and cerebellum into functionally related regions based on differential sensitivity to engrailed proteins. Development 134:2325–2335. doi: 10.1242/dev.000620 [DOI] [PMC free article] [PubMed] [Google Scholar]
- 43.Sturm D, Bender S, Jones DT, Lichter P, Grill J, Becher O, et al. (2014) Paediatric and adult glioblastoma: multiform (epi)genomic culprits emerge. Nature Reviews Cancer 14:92–107. doi: 10.1038/nrc3655 [DOI] [PMC free article] [PubMed] [Google Scholar]
- 44.Swanson WJ, Vacquier VD (2002) The rapid evolution of reproductive proteins. Nat Rev Genet 3:137–144. doi: 10.1038/nrg733 [DOI] [PubMed] [Google Scholar]
- 45.Tihan T, Zhou T, Holmes E, Burger PC, Ozuysal S, Rushing EJ (2008) The prognostic value of histological grading of posterior fossa ependymomas in children: a Children’s Oncology Group study and a review of prognostic factors. Mod Pathol 21:165–177. doi:3800999 [pii] 10.1038/modpathol.3800999 [DOI] [PubMed] [Google Scholar]
- 46.U-King-Im J, Taylor MD, Raybaud C (2010) Posterior fossa ependymomas: new radiological classification with surgical correlation. Childs Nerv Syst 26:1765–1772. doi: 10.1007/s00381-010-1251-6 [DOI] [PubMed] [Google Scholar]
- 47.Uhlen M, Fagerberg L, Hallstrom BM, Lindskog C, Oksvold P, Mardinoglu A, et al. (2015) Proteomics. Tissue-based map of the human proteome. Science 347:394. doi: 10.1126/science.1260419 [DOI] [PubMed] [Google Scholar]
- 48.van der Maaten L, Hinton G (2008) Visualizing Data using t-SNE. J Mach Learn Res 9:2579–2605 [Google Scholar]
- 49.Vinchon M, Leblond P, Noudel R, Dhellemmes P (2005) Intracranial ependymomas in childhood: recurrence, reoperation, and outcome. Childs Nerv Syst 21:221–226 [DOI] [PubMed] [Google Scholar]
- 50.Wani K, Armstrong TS, Vera-Bolanos E, Raghunathan A, Ellison DW, Gilbertson R, et al. (2012) A prognostic gene expression signature in infratentorial ependymoma. Acta Neuropathol 123:727–738. doi: 10.1007/s00401-012-0941-4 [DOI] [PMC free article] [PubMed] [Google Scholar]
- 51.Wilkerson MD, Hayes DN (2010) ConsensusClusterPlus: a class discovery tool with confidence assessments and item tracking. Bioinformatics 26:1572–1573. doi: 10.1093/bioinformatics/btq170 [DOI] [PMC free article] [PubMed] [Google Scholar]
- 52.Witt H, Mack SC, Ryzhova M, Bender S, Sill M, Isserlin R, et al. (2011) Delineation of two clinically and molecularly distinct subgroups of posterior fossa ependymoma. Cancer Cell 20:143–157. doi: 10.1016/j.ccr.2011.07.007 [DOI] [PMC free article] [PubMed] [Google Scholar]
- 53.Wu G, Diaz AK, Paugh BS, Rankin SL, Ju B, Li Y, et al. (2014) The genomic landscape of diffuse intrinsic pontine glioma and pediatric non-brainstem high-grade glioma. Nat Genet 46:444–450. doi: 10.1038/ng.2938 [DOI] [PMC free article] [PubMed] [Google Scholar]
- 54.Xue B, Dunbrack RL, Williams RW, Dunker AK, Uversky VN (2010) PONDR-FIT: a meta-predictor of intrinsically disordered amino acids. Biochim Biophys Acta 1804:996–1010. doi: 10.1016/j.bbapap.2010.01.011 [DOI] [PMC free article] [PubMed] [Google Scholar]
- 55.Zhang J, Wu G, Miller CP, Tatevossian RG, Dalton JD, Tang B, et al. (2013) Whole-genome sequencing identifies genetic alterations in pediatric low-grade gliomas. Nat Genet 45:602–612. doi: 10.1038/ng.2611 [DOI] [PMC free article] [PubMed] [Google Scholar]
Associated Data
This section collects any data citations, data availability statements, or supplementary materials included in this article.