

Abstract
Objective
To identify novel causes of recessive ataxias, including spinocerebellar ataxia with saccadic intrusions, spastic ataxias and spastic paraplegia.
Methods
In an international collaboration, we independently performed exome sequencing in seven families with recessive ataxia and/or spastic paraplegia. To evaluate the role of VPS13D mutations, we evaluated a Drosophila knock-out model and investigated mitochondrial function in patient-derived fibroblast cultures.
Results
Exome sequencing identified compound heterozygous mutations in VPS13D on chromosome 1p36 in all seven families. This included a large family with 5 affected siblings with spinocerebellar ataxia with saccadic intrusions (SCASI), or spinocerebellar ataxia, recessive, type 4, SCAR4. Linkage to chromosome 1p36 was found in this family with a LOD score of 3.1. The phenotypic spectrum in our 12 patients was broad. Although most presented with ataxia, additional or predominant spasticity was present in 5 patients. Disease onset ranged from infancy to 39 years, and symptoms were slowly progressive and included loss of independent ambulation in 5. All but two patients carried a loss-of-function (nonsense or splice site) mutation on one and a missense mutation on the other allele. Knock-down or removal of Vps13D in Drosophila neurons led to changes in mitochondrial morphology and impairment in mitochondrial distribution along axons. Patient fibroblasts showed altered morphology and functionality including reduced energy production.
Interpretation
Our study demonstrates that compound heterozygous mutations in VPS13D cause movement disorders along the ataxia-spasticity spectrum, making VPS13D the fourth VPS13 paralog involved in neurological disorders.
Introduction
Ataxia is a symptom of over 400 syndromic neurological conditions or can be the sole symptom of >80 recessively, dominantly, or X-linked inherited genetically defined conditions.1–3 Recessive forms of ataxia are clinically and genetically more heterogeneous than dominant ataxias. Only in a minor fraction (~20%) of idiopathic or suspected recessive ataxia cases can a mutation in a known ataxia gene be identified,4 suggesting that much of the genetic heterogeneity still remains to be discovered. In addition to heterogeneity, there is also pleiotropy, as the spectrum of ataxias also includes clinical and molecular overlap with, for example, the spastic paraplegias.5
Here, we report 12 patients from 7 families with compound heterozygous mutations in VPS13D. All patients > 2 years old have ataxia and/or spasticity, while the one 2 year old patient shows developmental delay, hypotonia, and is nonambulatory (Table 1). The phenotype in one of these families, comprising 5 patients (Figure 1), has previously been described in detail.6, 7 Briefly, patients in this family demonstrated early adult-onset cerebellar ataxia with neuropathy and pyramidal signs, as well as striking saccadic intrusions, hence initially referred to as spinocerebellar ataxia with saccadic intrusion (SCASI),6 later renamed spinocerebellar ataxia, recessive 4 (SCAR4). Analysis of a Drosophila knock-out model and patient-derived fibroblasts suggests that mutations in this new ataxia/spasticity gene impact on mitochondrial structure and function.
Table 1.
Clinical presentations of each ataxia case with VPS13D mutations identified
| UM1.1–5 | LUB1.1–2 | NIJ1 | NIJ2 | NIJ3 | NIJ4 | WF1 | |
|---|---|---|---|---|---|---|---|
| Mutation | p.Gln1106* p.Gly1190Asp |
p.Tyr1803* p.Ala4210Val |
p.Gln662* p.Met1307Leu |
p.Gln2572* p.Gly4149Ser |
p.Val2987Glyfs*14 c.941+3A>G |
c.2237-1G>C p.Asn4107Ile |
p.Leu2277* c.9998+4A>C |
|
| |||||||
| Sex | M; M; F; M; M | F; F | M | F | M | F | F |
|
| |||||||
| Origin | Slovenian | German | Dutch | Javanese | Dutch | Dutch | Lumbee/German/ Scottish |
|
| |||||||
| Age at last evaluation | 54; 52; 50; 49; 47 | 35; 29 | 43 | 29 | 37 | 6 | 2 |
|
| |||||||
| Onset age | 39; 36; 28; 23; 34 | 29; 20 | <5 | 28 | <3–4 | <1 | <1 |
|
| |||||||
| Presenting symptom | Gait (1–4) and reading (1–5) difficulties | Gait (1,2) and speech (2) difficulties | Delayed walking, spastic gait | Gait difficulties | Delayed walking, abnormal gait | Developmental delay | Delayed gross motor skills |
|
| |||||||
| Core phenotype | Cerebellar ataxia | Spastic ataxia | Spastic ataxia | Spastic paraplegia | Spastic ataxia | Ataxia and neuropathy | Hypotonia |
|
| |||||||
| Mobility | Wheelchair (1,3); Walker (2,4); Independent (5) | Independent (1); Wheelchair (2) | Wheelchair | Independent | Wheelchair | Independent | Not walking |
|
| |||||||
| Cerebellar signs | + | + | + | − | + | − | + |
| Oculomotor | Horizontal saccadic oscillations | Saccadic pursuit, SWJ, hypermetric vertical saccades (1); NA (2) | SWJ | − | Jerky pursuit, slow hypermetric saccades | Gaze-evoked nystagmus | NA |
| Dysarthria | + | − (1); + (2) | − | − | + | + | NA |
| UL ataxia | + | + | + | − | + | + | NA |
| LL ataxia | + | + | NA | − | + | + | NA |
| Gait ataxia | + | + | NA | − | + (stance) | + | nonambulatory secondary to balance/coordination difficulties |
|
| |||||||
| Pyramidal signs | + | + | + | + | + | − | − |
| UL spasticity | NA | − (1); NA (2) | − | − | − | − | − |
| LL spasticity | NA | + | − | + | + | − | − |
| Spastic gait | − | + | NA | + | NA | − | NA |
| Plantar response | Extensor | Extensor (1); NA (2) | Extensor | Equivocal to extensor | Extensor | Equivocal | Flexor |
|
| |||||||
| Tendon reflexes | Increase at knees, decrease at ankles | Increased UL/ LL (1); NA (2) | Increased UL/ LL | Increased LL | Absent ankle jerks, rest increased | Areflexia | Increased UL/ LL |
|
| |||||||
| Weakness/atrophy | Mild calf atrophy (1–4); None (5) | Moderate LL (1); NA (2) | Severe LL | Mild LL | Severe LL | Mild proximal/distal UL and LL | None |
|
| |||||||
| Seizures | − | − | − | − | − | + | − |
|
| |||||||
| Cognitive state | Normal | Mild executive dysfunction (1); Normal (2) | Normal | Normal | Normal | Mild ID | Speech delayed |
|
| |||||||
| Extrapyramidal signs | Myoclonus | − | − | − | Cervical dystonia | − | − |
|
| |||||||
| Sensory exam | Impaired joint position sense | Reduced deep sensory functions LL (1); NA (2) | Deep sensory loss distal LL | Normal | Sensory loss distal LL | NA | Normal |
|
| |||||||
| Brain MRI | Mild cerebellar atrophy with dorsal vermis involvement | Normal (1); NA (2) | Signal changes in corticospinal tract | Normal | Atrophy /hypoplasia cerebellar vermis inferior; subtle white matter changes centrum semiovale | Cerebellar atrophy | Normal |
|
| |||||||
| NCS/EMG | Mild to moderate sensorimotor axonal neuropathy | Normal (1); NA (2) | Normal | NA | NA | Axonal neuropathy | NA |
|
| |||||||
| Additional information | SEP:LL prolonged latencies & MEP: increased cortical latencies (1); Deterioration due to pregnancies (2) | Macrocephaly Oligospermia |
Azoospermia | Optic atrophy OPA1 mutation: c.1156_1157del, p.Leu386Glufs*2 | Poor eye contact; frequent hand flapping and head banging | ||
M: male, F: female, UL: upper and LL: lower limb, +: present, −: absent, NA: no assessment, SWJ: square wave jerks, ID: intellectual disability; NCS/EMG: nerve conduction studies, electromyography; MEP: magnetic evoked potential; SEP: sensory evoked potential. In columns 2 and 3, patient sexes and ages are given in id order (1–5 in UM1, 1–2 in LUB1), which are noted in parenthesis when phenotypes differ.
Figure 1. Multiplex ataxia families with compound heterozygous mutations in VPS13D.

A. Pedigree of Family UM1. Affected siblings are indicated by black filled symbols while unaffected individuals are marked by unfilled symbols. The nine unaffected siblings are shown in an open diamond. Mutational status is given below each individual together with the respective laboratory ID. B. Pedigree of Family LUB1 with mutations in the two affected sisters, shown by black filled symbols. C. cDNA sequences of the c.5409C>A mutation before (top panel) and after (lower panel) treatment with cycloheximide. The traces are representative of 2 sequencing runs. The nonsense-mutated allele got stabilized and showed similar expression levels upon treatment. D. Predicted domain maps of VPS13D protein (http://www.ebi.ac.uk/interpro/protein/Q5THJ4) with the identified missense mutations marked: N1: VPS13 1st N-terminal domain (aa 2-115), N2: VPS13 2nd N-terminal domain (aa 137-356), U: UBA (Ubiquitin-associated)-like domain (aa 2627-2679), SHR: VPS13 SHORT ROOT transcription factor-binding domain (aa 3276-3558), C: VPS13 C-terminal domain (aa 3983-4129). The five different missense mutations appear to cluster in two regions, one in the middle and the other near the C domain. E. Amino acid sequence alignments of the regions surrounding each missense mutation across various species. While Gly1190Asp, Asn4107Ile, and Gly4149Ser are conserved in all VPS13D orthologs, Met1307Leu and Ala4210Val are conserved in mammals and chicken but not in zebrafish and/or fruitfly.
Methods
Patients
Patients were identified in five different centers with a focus on movement disorders located in Case Western Reserve University (Ohio, US and genetically analyzed in Ann Arbor [Michigan, USA, UM1]), Nijmegen and Rotterdam (The Netherlands, NIJ1-4), Lübeck (Germany, LUB1) and Winston-Salem (North Carolina, USA, WF1). Diagnostic testing (including gene panel analysis of known ataxia/spasticity genes) did not reveal a molecular diagnosis in these cases. All patients and relatives gave written informed consent to participate in diagnostic or research studies that were approved by the respective local IRBs (IRBMED University of Michigan, University of Lübeck ethics review panel, or to local (NIJ and Rotterdam) or commercial (WF1, GeneDx, Gaithersburg, MD) clinical exome sequencing (NIJ and WF1). Formation of this collaboration was facilitated by publication of grants funded by the National Ataxia Foundation and by “GeneMatcher”.8
Genetic studies: Linkage analysis and exome sequencing
In Family UM1, linkage analysis was performed with DNA from all 5 affecteds, the mother and 7 unaffected siblings using the Infinium HumanLinkage-24 Beadchip kit (6000 markers, Illumina, WG-32-140), followed by parametric fully penetrant recessive model analysis in Merlin.9
In all families, whole exome sequencing was performed by exome capture [UM1: SeqCap EZ Exome v3.0 kit (Roche, CA, USA) at UM core facility; LUB1: NexteraRapid Exome Capture kit (Illumina, Inc., San Diego, CA, USA) at Centogene (Rostock, Germany); all NIJ cases: SureSelectXT Human All Exon 50Mb Kit V5 (Agilent, CA, USA) at BGI Copenhagen, and WF1 at GeneDx (Gaithersburg, MD, USA)] followed by next generation sequencing on Illumina arrays (UM1 and LUB1: paired end HiSeq2000; LUB1 NextSeq500), to medium coverage of 46X (UM1), and ~75X (all NIJ, LUB1, and WF1).
For UM1, two cases were sequenced and variant analysis was restricted to the ~10 Mb linkage region. For LUB1, WF1 and NIJ4, parents were also sequenced and initially, a trio analysis for de novo variants (no damaging hits) was performed. Variants were called as follows: UM1.1 and UM1.4: Alignment was done using BWA against Human 1K Genome reference, duplicates were removed using Picard (v1.74), base recalibration, realignment and variant calling were done using GATK (v3.3); these samples were part of a 734-sample pooled call; LUB1: Variant calling was performed as described;10 NIJ: Clinical exome sequencing and variant calling as described.11 WF1: GeneDx clinical whole exome pipeline. Detected variants were filtered for rare (European population frequency <0.01) and protein-changing variants under a recessive model. VPS13D variants emerged as the strongest candidate in all cases.
All VPS13D variants were Sanger confirmed and segregation in the family consistent with compound heterozygosity was verified.
Copy number variant analysis was not performed on all samples. Since single exonic deletions are hard to detect in whole exome analyses, they hence can’t be ruled out. Since all patients were compound heterozygous, a whole gene deletion in VPS13D can be ruled out.
Analysis of expression: Nonsense-mediated decay and splice site prediction
Since VPS13D expression is higher in skin (fibroblasts) than in blood, we used mRNA extracted from a fibroblast culture to study expression levels and nonsense-mediated mRNA decay in Family UM1 (data not shown) and Patient LUB1.1. For Patient LUB1.1, RNA was extracted using the QIAmp RNA Extraction Kit (QIAGEN, Germantown, MD, USA). Oligo-dT-Nucleotides of the Maxima First Strand cDNA Synthesis Kit (ThermoFisher, Waltham, MA, USA) served as primers to synthesize the complementary DNA (cDNA) by use of reverse transcriptase (RT). PCR was performed with primers in Exons 21 and 22 (VPS13Dex21F: TGATTCCTTAGTCCACATCAAC, VPS13Dex22R: ATCATTTCCAGGTGTGCTAC) and the respective product was inspected for its size and Sanger sequenced. Further, the expression of VPS13D in LUB1.1 and a control was compared to the expression of β-Actin and HPRT, and YAZ that served as reference genes. These quantitative PCRs were performed with SYBR Green on the LightCycler 480 system (data not shown). Since both qPCR and sequencing indicated instability of the allele with the nonsense mutation, we treated fibroblasts of LUB1.1 with cycloheximide for 8 hours at 100μg/ml final concentration to stabilize the transcript and confirm nonsense-mediated mRNA decay (NMD) as cause. Effect of cycloheximide was evaluated by sequencing of cDNA.
In addition to nonsense and missense mutations, we detected three variants at splice sites (c.941+3A>G, c.2237-1G>C, c.9998+4A>C). Since we are limited to perform skin biopsy for research purposes to adults only, per our IRB, we do not have fibroblast cultures from the children with splice mutations. Instead we used two online slice site prediction tools to estimate the impact of these variants on splicing: Human Splicing Finder (HSF, http://www.umd.be/HSF3/)12 and Splice Site Prediction, set to mammals (SSP, http://www.fruitfly.org/seq_tools/splice.html). HSF provides a consensus value (CV) variation as output with the interpretation of CV <−10% indicating a disruption of the splice site. SSP generates a score between 0 and 1 with a score of 0.5 recognizing about 90% of the actual sites and a false-positive rate of <5%. The higher the score, the higher the probability that the splice site is active.
Comparison of mutation frequencies in VPS13D paralogs
To assess the impact of the loss of function of each VPS13 paralogs, we compared phenotypes of animal models available in the literature and in databases, and examined estimates of mutation frequencies in humans. To assess the common mutation types (e.g. loss of function, missense) in each VPS13 paralog-associated disease, we restricted analysis to cases in which both mutations are known.
Functional studies in patient-derived fibroblasts
From the UM1 family, we established fibroblast cell lines from two patients (UM1.2 and UM1.4) and two controls (UM1.17, a daughter of an affected, and UMCtrl1, a married-in unaffected spouse). From LUB1, fibroblast lines were established from LUB1.1, the index patient, and her heterozygous parents (LUB1.3 and LUB1.4). In addition, fibroblasts from two unrelated control lines, LUBCtrl1, aka L-2132, and LUBCtrl2, aka L-2134, were used.
For mitochondrial imaging in fibroblast from the UM1 family, MitoTracker Red CMXRos (Invitrogen) was applied to fibroblasts cultured on coverslips for 40 minutes before fixing in 4% paraformaldehyde for 12 minutes. Through PLAPON 60X (1.42 Oil) lens on Olympus FV1000 confocal microscope, 6–8 z-stacks of images were obtained per visual field to produce images of in total 72 ~ 127 cells per line. Images were flattened using z-projection at maximum intensity using the open software Fiji,13 which was also used to generate intensity histograms. For each 2-D image, the Otsu algorithm was applied to extract the top 1% brightest pixels. To quantify spherical mitochondria, any areas smaller than 1.5 μm^2 and with less circularity than 0.18 were removed using Fiji’s Analyze Particles function. The remaining selected areas correspond to bright and spherical mitochondria. The average number of such selected objects per cell was calculated in each cell line. We also computed the percentage of cells with >2 such objects in the perinuclear region. Form factor analysis as a measurement of the mitochondrial network integrity was performed by using a selection algorithm in the software program Volocity (Perkin Elmer) to select mitochondrial objects (1 standard deviation above the mean MitoTracker intensity) of a projected Z-stack image (average intensity). For each projected image containing 4–12 cells, form factor defined as [Pm2]/[4πAm] with Pm being the perimeter and Am being the area of a mitochondrion, was calculated for all selected mitochondria and the mean was obtained for the entire image field. For each individual, 11–17 images from two independent experiments were analyzed.
In fibroblasts of Family LUB1, the form factor was determined as previously described.14 In brief, the mitochondrial network in fibroblasts was stained with an anti-GRP75 antibody (1: 1000, Abcam, Cambridge, MA) in combination with the the Zenon immunolabelling kit (Invitrogen, Carlsbad, CA) according to manufacturer’s protocol. Based on single cell images, mitochondria area and outline were measured and the form factor was calculated. Mean form factor was averaged over 20 cells per individual.
Measurement of the rate of ATP synthesis in cultured fibroblasts
ATP was quantified, in triplicate, using the ATP Bioluminiscence Assay Kit CLS II (Roche Diagnostics), following manufacture’s instruction. ATP is measured in a luminometer (Berthold, Detection System), and calculated as ATP generated (μMoles) per minute per mg of protein. The amount of protein was determined using the BCA protein Assay Kit (Pierce).
Functional studies in Drosophila models
All fly lines and related constructs were purchased from the Bloomington Stock Center, including Vps13D mutant lines [#56282 (Vps13D11101) and 22996, only #56282 homozygous shown], Vps13D RNAi (#38320), motoneuron-specific Gal4 driver (D42-Gal4, #8816), a deficiency line Df(3L)Exel6117 (#7596), as well as fluorescent mitochondrial marker (UAS-mitoGFP, #42727).15 All phenotypes observed of homozygous Vps13D mutant alleles were confirmed in compound heterozygous flies of the two alleles, and in mutant alleles over the deficiency line, which lacks a defined region of the Drosophila chromosome containing the entire Vps13D genetic locus and some neighboring genes. For staining, we used the following primary antibodies: ATP5A (Abcam ab14748), 1: 1000 GFP (Life Technologies A-11122, 1:1000), Horse Radish Peroxidase (HRP) (Jackson 123-605-021,1:1000), DLG (DSHB 4f3, 1:1000). All secondary antibodies were from Invitrogen (Alexa-conjugated 1:1000, 2 hrs, RT). Standard dissection and immunostaining procedures were used for larval tissue analysis.16 For larval immunostaining, tissues were fixed with 4% formaldehyde for 20 minutes at room temperature prior to staining, except for anti-ATP5A staining in which tissue was fixed with Bouin’s Fixative for 7 minutes at room temperature. Form factor analysis of larval ventral nerve cords was performed using Volocity to select mitochondrial networks in the cell bodies of RNAi expressing motoneurons based on threshold of mitoGFP fluorescence (2.5 standard deviations above the mean fluorescence intensity) from a projected Z-stack image. For each cell body, an average form factor of all mitochondria was calculated.
Statistical analyses
Differences were analyzed statistically using unpaired t-tests, or analysis of variance (ANOVA) with a Bonferroni-Dunn post-hoc correction.
Results
Genetic Findings
Overview
In four different locations in the US and Europe, we independently detected compound heterozygous VPS13D mutations in 7 families. The mutational spectrum included five nonsense, five missense, one frameshift, one essential and two nonessential splice site mutations (Table 2). All families carried a combination of one loss-of-function mutation (LOF: nonsense, frameshift, or essential splice sites) and one presumably milder change (missense or nonessential splice site mutation).. All variants were absent or extremely rare (<13 heterozygous carriers) in the ~120,000 individuals listed in GnomAD. Among the five missense mutations, Gly1190Asp and Met1307Ile found in families UM1 and NIJ1 were located in the center of the protein. The three C-terminal missense mutations detected in families LUB1, NIJ2 and NIJ3 are close to or within the C-domain (Fig 1D), which is conserved and unique among all VPS13 proteins including yeast.
Table 2.
Compound heterozygous VPS13D mutations identified in each ataxia/spasticity family
| Mutation Protein NP_056193 |
Mutation cDNA NM_015378 |
Mutation Genomic level |
CADD score |
Mutation Taster | Frequency GnomAD |
Human Splicing Finder |
Splice Site Prediction |
|
|---|---|---|---|---|---|---|---|---|
| UM1 | Gly1190Asp | 3569G>A | chr1:12337214G>A | 25 | Disease causing | Not reported | ||
|
| ||||||||
| Gln1106Ter | 3316C>T | chr1:12336961C>T | 39 | Disease causing | Not reported | |||
|
| ||||||||
| LUB1 | Ala4210Val | 12629C>T | chr1:12520418C>T | 34 | Disease causing | 0.00004039 | ||
|
| ||||||||
| Tyr1803Ter | 5409C>A | chr1:12343568C>A | 33 | Disease causing | Not reported | |||
|
| ||||||||
| NIJ1 | Met1307Leu | 3919A>T | chr1:12337564A>T | 19 | Disease causing | 0.00004885 | ||
|
| ||||||||
| Gln662Ter | 1984C>T | chr1:12331062C>T | 40 | Disease causing | Not reported | |||
|
| ||||||||
| NIJ2 | Gly4149Ser | 12445G>A | chr1:12516165G>A | 35 | Disease causing | Not reported | ||
|
| ||||||||
| Gln2572Ter | 7714C>T | chr1:12382602C>T | 51 | Disease causing | Not reported | |||
|
| ||||||||
| NIJ3 | Splicing | 941+3A>G | chr1:12317147A>G | 17 | NA | Not reported | −0.83% | 0.89→ 0.21 |
|
| ||||||||
| Val2987Gly fsX14 | 8960_8961 delTG | chr1:12405505delTG | 35 | Disease causing | Not reported | |||
|
| ||||||||
| NIJ4 | Asn4107Ile | 12320A>T | chr1:12476867A>T | 30 | Disease causing | Not reported | ||
|
| ||||||||
| Splicing (essential) | 2237-1G>C | chr1:12335881G>C | 23 | NA | Not reported | −31.07% | 0.99→ 0.00 | |
|
| ||||||||
| WF1 | Splicing | 9998+4A>C | chr1:12416585A>C | 9.6 | NA | 0.00003738 | −10.57% | 0.93→ 0.62 |
|
| ||||||||
| Leu2277Ter | 6829delC | chr1:12371876delC | 35 | Disease causing | Not reported | |||
Coordinates of all detected mutations are based on NM_015378 for cDNA and GRCH37/hg19 built for genomic DNA. CADD score and MutationTaster are in-silico prediction of deleteriousness of each mutation. 3 of the mutations have been reported previously in public exome/genome databases (gnomAD: genome aggregation consortium at http://gnomad.broadinstitute.org/gene/ENSG00000048707). For splice mutations, splice site prediction scores were calculated at Human Splicing Finder (http://www.umd.be/HSF3/) and Splice Site Prediction (http://www.fruitfly.org/seq_tools/splice.html).
UM1 ataxia family (SCAR4)
We have previously reported a family with 14 siblings, five of whom with adult-onset spinocerebellar ataxia with saccadic eye intrusion (Fig 1A, SCAR4 6, 7). After exclusion of known ataxia mutations, genome-wide linkage analysis under a recessive, full penetrance model identified only a single locus with LOD > 0, which was 20 cM/ ~10 Mb on chromosome 1p36 flanked by rs7538691 and rs761162 (LOD = 3.1, data not shown). Whole exome sequencing in two affected individuals revealed compound heterozygous mutations in VPS13D as the only likely genetic cause within the linked region. The variants comprised a paternally inherited missense change (c.3569G>A, p.Gly1190Asp) and a maternally inherited stop-gain mutation (c.3316C>T, p.Gln1106Ter). Sanger sequencing verified segregation among all 12 siblings with available DNA samples. Sequencing of RT-PCR products from fibroblast cell lines of two patients demonstrated that the stop-gain allele-containing mRNA product was less abundant, suggesting that it underwent nonsense-mediated decay (data not shown). pGly1190Asp introduces an extra negative charge and appears not to affect protein stability (data not shown).
Family LUB1
In two affected sisters of a German family with spastic ataxia (Fig 1B), we detected compound heterozygous mutations in VPS13D including a maternal nonsense mutation (Tyr1803Ter) and a paternal missense change (Ala4210Val, rs746736545). Similar to Family UM1, sequencing of cDNA of the index patient revealed the allele with the nonsense mutation to be less abundant. Treatment with cycloheximide stabilized the mutated allele and confirmed that the nonsense-mutated allele indeed underwent NMD (Fig 1C). NMD resulted in a decreased expression level of about 50–60% in Patient LUB1.1 (data not shown).
Additional sporadic cases
At the Radboudumc expert centre for genetic movement disorders in Nijmegen, and the genetic movement clinic in Rotterdam, the Netherlands, four unrelated cases of different ethnicities with compound heterozygous VPS13D mutations were independently identified (Table 1). NIJ1 and NIJ2 carry a combination of a nonsense mutation and a missense change, NIJ3 a frameshift and a non-essential splice site mutation, and NIJ4 carries an essential splice site mutation and a missense change (Table 2). NIJ4 also has optic atrophy and carries a heterozygous frameshift mutation in OPA1 [c.1156_1157del (p.Leu386Glufs*2)]. A second (biallelic) mutation in OPA1 was excluded by exome sequencing with sufficient coverage of the entire coding region and splice sites. Her mother carried the same variant and has isolated optic atrophy.
At the Wake Forest School of Medicine, Winston-Salem, North Carolina, USA, one additional case, WF1, was identified by clinical exome sequencing (GeneDx, Gaithersburg, MD). WF1 displayed hypotonia, balance and coordinating difficulties, as well as global developmental delay; more formal clinical ataxia tests were difficult to perform, due to her current age and disease features as well as global developmental delay. WF1 has a combination of a nonsense mutation and nonessential splice site change.
To estimate the impact of the splice site changes on the transcript, we used two different in-silico splice site prediction programs. As expected, both programs, HSF and SSP, strongly predicted an effect on splicing of the invariant acceptor splice site of intron 18 in NIJ4, c.2237-1G>C (Fig 2), which hence was classified LOF. The splice region variants in NIJ3 and WF1, however, are not within invariant splice consensus sites. For c.9998+4>C in intron 49, CV variation was −10.57%, thus just below HSF’s −10 cut-off. SSP’s prediction score dropped from 0.93 to 0.62 suggesting a mild, if any, impact on recognition of this splice site. For c.941+3A>G in intron 9, the CV variation was −0.83% by the HSF algorithm and would argue against an effect on splicing. However, the SSP score dropped from 0.89 to 0.21, suggesting reduction in predicted splicing ability. These two non-essential splice site mutations are hence not considered complete LOF alleles as they may allow some correctly spliced transcripts. Confirmatory analysis of intronic splice region variants could not be performed at this time (see methods for details).
Figure 2. Disruption of Vps13D in the Drosophila central nervous system affects mitochondrial morphology.
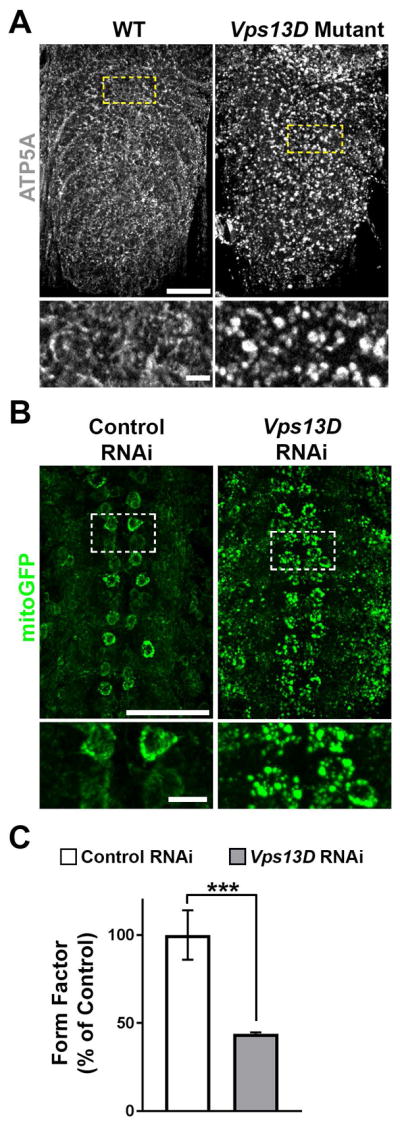
A. Ventral nerve cord (VNC), stained for mitochondrial marker ATP5A, of control (w1118, right panel) and Vps13D mutant (Vps13D11101/11101, left panel) Drosophila larvae. Bottom: High magnification single confocal Z-planes of areas indicated by the dashed boxes, highlighting mitochondrial morphology in neuronal cell bodies. Scale Bars: 50μm (top) and 5μm (bottom) B. Representative images of motoneurons (via D42-Gal4) with simultaneous expression of fluorescent mitochondrial marker mitoGFP (green) along with control (left panel) and Vps13D (right panel) RNAi expression. Bottom: High magnification single confocal Z-planes of areas indicated by the dashed boxes, highlighting mitochondrial morphology in motoneuron cell bodies. C. Quantification of form factor analysis of the mitochondrial network (based on mitoGFP) in neuronal cells bodies expressing control RNAi (white) vs. Vps13D RNAi (grey). n=50 neurons per condition (from 5 different animals). Error bars represent standard error. *** indicates p<0.001 (Students T-test).
Clinical findings
All cases except for WF1, which was too young, had either ataxia or spasticity as a core symptom. Onset ranged from infancy to early adulthood. The UM1 family, previously assigned SCAR4, demonstrated primarily adult-onset ataxia with distinct macrosaccadic intrusions7, with pyramidal features, neuropathy, and myoclonus but no intellectual disability6. Videos of the clinical exams and the distinct eye phenotype are available in the online supplement of that reference7. The two sisters from family LUB1 were in their onset and clinical phenotypes similar to UM1, except for a different oculomotor phenotype. By contrast, NIJ1 had a much earlier onset (< 5 yrs) and symptoms were more debilitating (wheelchair-bound by age 17 yrs). Whether his phenotypic difference originates from more severe VPS13D mutations or other environmental or genetic factors is unknown at this time. Similarly, NIJ4 and WF1 were severely affected with an age at onset in the first year of life. In addition to ataxia and neuropathy, NIJ4 suffers from developmental delay, seizures, and optic atrophy. Coincidentally, she carries an additional mutation in OPA1 (Optic Atrophy 1/ Mitochondrial Dynamin Like GTPase) which explains the optic atrophy but not the additional seizures and the developmental delay. NIJ2 was affected by spastic paraplegia without ataxia, with onset in early adulthood. Patients WF1 and NIJ3 might be more severely affected due to two severe mutations including a non-essential splice site change and a LOF mutation, in contrast to the combination of a missense and a LOF mutation in the other subjects.
Among VPS13 paralogs, VPS13D is the most intolerant to mutations
Yeast vps13 is implicated in many cellular functions including sporulation, Golgi organization, and mitochondrial integrity. 18 During metazoan evolution, two duplication events gave rise to three paralogs–VPS13A/C, B, and D. Drosophila Vps13 (CG2093) is an ortholog of VPS13A/C, which further duplicated in the vertebrate evolution into VPS13A and VPS13C (updated from reference 19). Since not much is known about VPS13D-specific function, we compared reported phenotypes of VPS13 homologs in the two model organisms fly and mouse [fly database CG2093 20, mouse: MGI2444304 21, MGI2444207, and MGI2448530] (Table 3). Mutations in Vps13D/VPS13D cause embryonic lethality in both animals, while mutations in VPS13A and C appear more tolerable during early development (animal phenotypes for VPS13B are unavailable).
Table 3.
Mutations of VPS13D paralogs in animals and humans
| Yeast Cellular functions implicated |
Fruit fly
paralogs mutant phenotypes |
Vertebral paralogs Mouse null phenotypes |
Mutation Intolerance in human | Human disorder | |||||
|---|---|---|---|---|---|---|---|---|---|
|
| |||||||||
| RVIS | %ExAC v2 RVIS | LoF O/E |
LoF pLI |
Disorder | Disease mutation type | ||||
|
Vps13
17 Sporulation, Integrity of mitochondria, Golgi organization, Organelle junction |
Vps13/CG2093
19 Reduced life span, Neurodegeneration |
VPS13A Viable, Acanthocytosis, Neurologically abnormal in 129/SvEv background 20 |
−1.85 (2.03%) |
−3.75 (0.51%) |
30/119.0 | 0.00 | Chorea acanthocytosis 22 | 1/31 | MIS / MIS |
| 1/31 | MIS / LOF+ | ||||||||
| 29/31 | LOF+ / LOF+ | ||||||||
|
| |||||||||
|
VPS13C Viable, Neurologically normal # |
−0.61 (17.5%) |
−2.83 (1.20%) |
83/141.1 | 0.00 | Parkinson’s disorder 28–29 | 1/4 | MIS / LOF | ||
| 3/4 | LOF / LOF | ||||||||
|
| |||||||||
|
Vps13B/CG15523 No data available |
VPS13B No data available |
−0.81 (12.08%) |
−2.13 (2.69%) |
65/127.8 | 0.00 | Cohen 23–27 syndrome | 3/45 | MIS / MIS | |
| 1/45 | MIS / LOF+ | ||||||||
| 41/45 | LOF+ / LOF+ | ||||||||
|
| |||||||||
|
Vps13D/CG32113
* Embryonic lethal, Mitochondrial defects |
VPS13D Embryonic lethal before placentation with complete penetrance $ |
−4.23 (0.14%) |
−5.77 (0.11%) |
28@/156.2 | 1.00 | Ataxia * | 5/7 | MIS / LOF | |
| 2/7 | Splice? / LOF | ||||||||
RVIS: residual variation intolerance score (more negative more intolerant) with intolerance score ranked in all human genes given in paranthesis. %ExAC v2 RVIS: RVIS v4, constructed on ExAC v2 (gnomAD) release. LoF: Loss of function, stop-gained and essential splice site mutations. O/E: number of variants observed/expected. pLI: probability of LoF Intolerance (pLI >=0.9 regarded as extremely LoF intolerant). RVIS, LoF O/E and pLI are based on ExAC.
For VPS13D, gnomAD lists 65 LoF variants, with no increased frequency in any particular geographic/ethnic population.
MIS: missense. LOF: LoF plus frameshift. LOF+: In addition to LOF, large deletions/insertions included.
MGI2444207.
MGI2448530.
This study
A similar trend was observed in human populations (Table 3): RVIS (Residual Variation Intolerance Score) is a gene-based intolerance score derived from allele frequency in whole exome sequence data.22 Among the paralogs, VPS13D has the lowest RVIS score of −4.23, 0.14 percentile, suggesting VPS13D is among the most mutation-intolerant of human genes. We also compared the frequency of LOF in each paralog in the ExAC (Exome Aggregation Consortium) browser. Again, VPS13D emerges as most sensitive to LOF mutations, with the lowest ratio of the number of variants observed over expected. For VPS13D, the probability of LOF intolerance, pLI score, is 1, virtually certain. Indeed, chorea acanthocytosis is caused in 29/31 cases by LOF/LOF mutations in VPS13A,23 Cohen syndrome in 41/45 cases by LOF/LOF mutations in VPS13B, 24–28 and Parkinson’s disease in 3/4 cases by LOF/LOF mutations in VPS13C cases.29, 30 In summary, VPS13D is intolerant to complete LOF of both alleles, being likely incompatible with life, consistent with our finding of only compound heterozygous missense/LOF or nonessential splice/LOF mutations.
Vps13D disruption in Drosophila is lethal and causes mitochondrial defects
Known also as CG32113 in flies, fly Vps13D shows 33% protein identity to the human gene (Table 3). Consistent with Vps13d lethality in mice, flies disrupted for Vps13D do not survive beyond 2nd instar larvae stage. This lethality was confirmed with two independent lines containing large insertions in the coding region of Vps13D, including compound heterozygous animals containing one copy of each Vps13D allele, hence ruling out secondary mutations as the cause of lethality.
Since the only yeast vps13 protein has previously been implicated in mitochondrial function,29 we hypothesized that loss of Drosophila Vps13D may alter mitochondria. In early 2nd instar larvae before lethality, we observed that deletion of Vps13D led to severe alterations in mitochondrial morphology. Instead of forming fine mitochondrial networks in individual cells, mitochondria appear as singular, enlarged objects. This abnormal mitochondrial appearance was present in the larval brain (Fig 2A) and other tissues in these young larvae (not shown). By contrast, no differences were detected for cellular markers of other organelles (Golgi, ER, lysosomes and the nucleus; data not shown).
We then used RNAi-mediated knockdown31 to inhibit expression of Vps13D specifically in motoneurons. This allows for survival of larvae to the 3rd instar stage (death at pupal stage), which enables further characterization of Vps13D’s autonomous function in neurons. By co-expression of mitoGFP targeted specifically to mitochondria of the RNAi depleted neurons,15 we observed enlarged spherical mitochondria (Fig 2B). Compared to a control RNAi line targeting luciferase, knockdown by Vps13D RNAi resulted in a significant reduction in quantified form factor (Fig 2C), consistent with a loss of complexity of the mitochondria network coinciding with enlarged, isolated mitochondria. These observations suggest a role for Vps13D in regulating mitochondrial morphology and potentially also mitochondrial function in neurons.
The abnormal mitochondrial network in neuronal cell bodies led us to hypothesize that loss of Vps13D would deleteriously impact the distribution of mitochondria to distal regions of neurons.
Previous studies have linked deficiencies in mitochondrial trafficking to distal neurites in neurodegenerative diseases and neuropathies.32, 33 We observed that reduction of Vps13D in motoneurons led to strong impairment in the distribution of mitochondria in peripheral axons in segmental nerves (Fig 3A, B) and neuromuscular junction (NMJ) synapses (Fig 3C, D). The density of mitochondria was progressively reduced concomitant with increased distance from the cell body locations in the CNS (Fig 3). This failure to distribute mitochondria resembles previously described defects for mutations in mitochondrial fission/fusion machinery.32
Figure 3. Knockdown of Vps13D in Drosophila motoneurons disrupts the distribution of mitochondria to distal axons.

A. Segmental nerves (HRP, red) containing motoneuron axons expressing fluorescent mitochondrial marker mitoGFP (green) of control RNAi and Vps13D RNAi knockdown (RNAi) animals. Nerves near the VNC (proximal, top) and distant from the VNC (distal, bottom) are shown. Scale Bar: 10μm. B. Quantification of the mitochondrial content per area within segmental nerves in proximal and distal regions of motoneurons expressing control RNAi (white) vs. Vps13D RNAi (grey). Data is normalized to Control RNAi Proximal Region condition. N≥10 individual nerves from 5 different animals. Error bars represent standard error. **** indicates p<0.0001 (Students T-test). C. Larval NMJ synapses from motoneuron axons expressing fluorescent mitochondrial marker mitoGFP (green) of control and Vps13D RNAi knockdown animals. HRP (red) labels neuronal membrane, while DLG (blue) labels NMJ postsynaptic region. High magnification images of the synaptic region (indicated by the dashed box) are shown (right panels) to highlight mitochondria occupying the synaptic region. Scale Bar: 20μm (left) and 2.5μm (right). D. Quantification of the mitochondrial content in the NMJ synapse per area of motoneurons expressing control RNAi (white) vs. Vps13D RNAi (grey). Data is normalized to Control RNAi condition. n=5 animals (each n represents the avg. mitochondrial content of ≥6 NMJ synapses/animal). Error bars represent standard error. **** indicates p<0.0001 (Students T-test).
Patient-derived fibroblasts show altered mitochondrial morphology
Given these fly data, we also investigated mitochondrial function and morphology in human fibroblasts. Staining fibroblasts from the affected subjects of family UM1 with MitoTracker, which accumulates in mitochondria in a membrane potential dependent manner, revealed significantly brighter mitochondria (Fig 4). While the typical mitochondrial network of elongated objects and branches was observed in both control and patient cells, the perinuclear regions of only affected cells often contained unusually bright and significantly more spherical mitochondrial objects, which were mostly in clusters and at higher magnification appeared to be donut-shaped (Fig 4G). To quantify the abundance of the bright and spherical mitochondria in each cell line, we extracted the top 1% brightest pixels from each image and selected circular objects based on computed circularity score. The average number of such abnormal mitochondrial objects was ~ 6-fold higher in the affected compared to control cells (Fig 4H). In the perinuclear region, such objects were identified in clusters (≥ 3) in ~10% of normal but 91% and 67% of fibroblasts of affected subjects’ cells (Fig 4I). Consistent with the Drosophila data, form factor analysis also revealed a significant reduction in the degree of mitochondrial branching in the affected fibroblasts compared to controls (Fig 4J). These observations suggest structural defects in mitochondria in VPS13D-deficient fibroblasts.
Figure 4. Patient fibroblasts contain abnormal spherical mitochondria.

A–D: Comparison of mitochondria in 4 fibroblast lines of Family UM1 stained with MitoTracker: A, UMCtrl1: wild type for VPS13D; B, UM1.17: asymptomatic heterozygous carrier of the Gly1190Asp missense mutation; C and D, UM1.2 and UM1.4: VPS13D compound heterozygous patients. Note that while the majority of the mitochondria in the control cells are elongated and of similar intensity, the patient cells are loaded with particularly bright, circular mitochondrial objects mostly localized in perinuclear region. E: Intensity histogram of MitoTracker images. The X-axis represents the intensity, the numbers of pixels are plotted on the Y-axis (the black plots in natural number scale and the gray plot in log-scale). Note that both patients have many more pixels with higher intensity, indicative of the increase in bright MitoTracker-stained objects. F and G: Perinuclear mitochondria at higher magnification (60X lens, 4X zoom). Control mitochondria (F, UMCtrl1) are elongated, tubular, and interconnected while the patient mitochondria (G, UM1.2) are often donut-shaped. Here, brightness was individually optimized to reveal the structural details and is not comparable. Scale Bars: 20 μm (A–D) and 2 μm (F and G). H: Average number of circular mitochondria (MT) objects identified by image processing. Such circular objects are present in the control cell lines at low frequencies but become much more abundant in the affected cell lines (~6-fold increase). I: Percentage of cells with at least 3 perinuclear circular MT objects. The patient fibroblast cultures have higher number of cells with perinuclear circular MT objects than control (6- and 9-fold increase). J. Form factor analysis of the mitochondrial network stained by MitoTracker. In H to J, error bars represent standard error. *, **, and *** indicate p<10−4, p<10−5, and p<10−6 respectively (Student’s T-test).
Independent analysis of fibroblasts of the proband of family LUB1 demonstrated that the affected fibroblasts expressed reduced levels of mitochondrial GRP75 protein compared to controls (Fig 5A–C). Form factor analysis of GRP75 immunostaining revealed a similar reduction in the degree of mitochondrial branching of proband fibroblasts compared to two unrelated healthy controls (Fig 5D). These structural mitochondrial changes were accompanied by a reduced ATP production rate of LUB1.1 compared to control fibroblasts (Fig 5E).
Figure 5. Altered mitochondrial morphology and decreased ATP in VPS13D mutant fibroblasts.

A. Western blot analysis shows mitochondrial GRP75 protein levels in the VPS13D-mutant fibroblasts (LUB1.1), patient’s parents (LUB1.3 and LUB1.4), and healthy control fibroblasts (LUBCtrl2) with β-actin as loading control. B. Quantification of the above GRP75 Western blot using ImageJ. C. The mitochondrial network was investigated under basal conditions by confocal microscopy in fixed cells immunostained with anti-GRP75. Scale Bar: 20 μm. D. Form factor as a measure for mitochondrial interconnectivity (GRP75 immunostaining) was calculated for two control fibroblast lines (LUBCtrl1, LUBCrtl2) and one patient line (LUB1.1) (n=20). Each dot represents measurement in a single cell. The mean values, and the standard deviations of the investigated individuals are shown. E. ATP production was determined based on luminescence. ATP concentration (μmoles) was calculated per minute per milligram of protein (n=3 independent experiments). In B and E, the error bars indicate SEM of n≥3 independent experiments.
Discussion
In this study, we have identified seven different compound heterozygous mutations in VPS13D in twelve patients and link VPS13D/Vps13D defects in patient fibroblasts and in flies to mitochondrial deficits. Our study also included a large family with ataxia (SCAR4) and linkage to a 10-Mb region on chromosome 1p36 including the VPS13D gene.
The core phenotype of the eleven patients above the age of 2 with compound heterozygous VPS13D mutations is characterized by movement disorders of the ataxia-spasticity spectrum, ranging from predominant ataxia, spastic ataxia, to spastic paraplegia without ataxia, and ataxia plus phenotypes. The latter included two cases with an additional developmental delay phenotype (NIJ3 and NIJ4). The youngest patient, WF1 of age 2 at the last evaluation, presented with hypotonia, developmental delay, including motor delay, and was not yet ambulatory. These three patients also have different types or additional mutations, as NIJ3 and WF1 carry nonessential splice region variants in addition to an LOF. This may be more severe than the combination of missense/LOF found in the other cases. In addition, NIJ4’s presentation may be complicated by an additional mutation in OPA1. The protein encoded by OPA1 is also implicated in mitochondrial function. It is conceivable that there may be an interactive effect of the two mutations linked to mitochondrial dysfunction. Interestingly, recent data have shown that about 5% of patients carry two independent Mendelian diseases. 34 However, digenic inheritance can’t be ascertained based on this single case. Of note, homozygous or compound heterozygous OPA1 mutations cause an extended multi-system phenotype that includes ataxia and spastic paraplegia, known as Behr syndrome. 17 While there was complete coverage of the OPA1 coding regions and splice sites, no second mutation in the OPA1 gene was detected by exome nor by copy number analyses (conducted as described)35. Hence, although we cannot exclude an undetected intronic or promoter mutation that is not penetrant, as the father does not have optic atrophy, we believe Behr syndrome as an alternative diagnosis in this case is not likely.
The overlap between genetic forms of ataxias and hereditary spastic paraplegias is well recognized, as there are other examples of genes (e.g., SPG7) that when mutated can give rise to either pure ataxia or spastic paraplegia or to a mixed phenotype of spastic ataxia,36, 37 developmental delay, and seizures, and other complex phenotypes commonly accompany early onset recessive ataxias.2 In addition, there was variability in age of onset in our patients, which is also not unusual for ataxias. Frequently observed neurological co-morbidities in our series included peripheral axonal neuropathy and extrapyramidal signs such as myoclonus and dystonia. Infertility was noted in two male cases. Although it is currently uncertain whether this is VPS13D-related, infertility is a known feature of mitochondrial disease.38
VPS13D encodes a large protein (4388 amino acids), whose paralogs cause other neurological disorders: VPS13A mutations cause chorea acanthocytosis, characterized by a severe hyperkinetic movement disorder, myopathy, epileptic seizures, cognitive decline and behavioral changes, 23, 39 and perturb protein homeostasis in the fly.20 VPS13B is involved in Cohen syndrome 40, 41 and VPS13C in rare cases of genetic Parkinson’s disease with mitochondrial dysregulation and mitophagy. 29 Most of these disease-associated mutations are LOF/LOF (see Table 3). In contrast to the other VPS13 paralogs, knocking out VPS13D’s homologs in Drosophila (our results) and mouse (MGI:2448530) leads to embryonic lethality, and not a single LOF/LOF mutation was identified, suggesting that some residual VPS13D function in humans may be critical for survival. In addition, the ExAC server’s pLI score, i.e. the probability that a gene may be intolerant to haploinsufficiency, for VPS13D is 1, in contrast to all other VPS13 genes (Table 3). 42 We did not, however, observe the predicted intolerance to haploinsufficiency, as one parent of each of the cases reported here was haploinsufficient, but none were symptomatic, including one parent who lived into their 90s without apparent neurological problems.
Our genetic data allow for some first, yet cautious speculations on genotype-phenotype correlations. First, our current data collectively point to missense/LOF mutations tending to cause relatively pure ataxia and/or spasticity. Second, as suggested by the more severe NIJ3 and WF1 cases, who carry non-essential splice site/LOF mutations, other mutation type combinations may be associated with a broader and/or more severe spectrum of phenotypes. Lastly, the other severe case, NIJ4, had a co-existent dominant OPA1 mutation and corresponding optic atrophy,43 which was also observed in the subject’s mother. The OPA1 mutation may contribute epistatically to the phenotype since OPA1 also affects mitochondrial function.43
Although our study convincingly establishes missense/LOF mutations in VPS13D as causing ataxia/spastic paraplegia and mitochondrial pathology, many questions remain to be addressed. Clinically, predicting the phenotype from new mutations in VPS13D will be difficult. Even for missense/LOF mutation carriers, the clinical presentation varied in our series. In addition, homozygous or compound heterozygous missense mutations were not observed here. As VPS13D is a large gene with many missense variants reported in databases including homozygosity,42 it will be even more difficult to predict pathogenicity of any novel biallelic missense variants.
While further work is warranted to pin down the precise mitochondrial defect, we have shown abnormal mitochondrial morphology in both flies and patient cell lines, and reduced mitochondrial function in fibroblasts. Mitochondrial dysfunction is associated with several other ataxias and spastic paraplegias such as Friedreich’s ataxia,44 SCA28,45 POLG,46 and SPG7,47 as well as in some unexplained ataxias.48 Although we observed a defect in mitochondrial distribution in both Drosophila neurons lacking Vps13D and patient fibroblasts containing mutations in VPS13D, the precise biological underpinnings of this defect are still under investigation, including electron microscopy studies to assess mitochondrial morphology. Alterations of mitochondrial dynamics such as transport, fission, and/or fusion32 can all potentially manifest in aberrant distribution of mitochondria throughout the cell. Various mutations in mitochondrial genes lead to the production of reactive oxygen species,49 which can additionally disrupt mitochondrial distribution in neurons. Combining the in vitro cellular model of patient fibroblasts and neurons differentiated from induces pluripotent stem cells with in vivo experiments in the genetic fly model may help us parse out the cellular role of VPS13D in mitochondrial biology and disease progression. These methods will also allow for testing of potential therapies that target mitochondrial dysfunction and that could be common to other forms of ataxia and spastic paraplegias.
While this manuscript was under review, Anding et al. published findings showing VPS13D to be a ubiquitin-binding protein and affecting mitochondrial fission and fusion, 50 consistent with our findings, and also implemented VPS13D in autophagy, a process that we have recently reported to be involved in ataxia. 51
Acknowledgments
We thank the patients for their willingness to participate and patience during our research. We thank Dr. Philipp Capetian for clinical evaluation of Family LUB1 and referring to the study. Linda Gates, Thomas Kubisiak, and Frauke Hinrichs for excellent technical assistance; Johann Gudjonsson, MD (Dermatology, University of Michigan) for fibroblast biopsies, Soochin Cho (Creighton University) for useful discussion on VPS13 evolution; Bart Post, MD, PhD and Jolanda Schieving, MD (Department of Neurology, Radboud university medical centre, Nijmegen, the Netherlands) and M. Jongen, MD, PhD (Department of Neurology, Erasmus MC, Rotterdam, the Netherlands) and Aasef Shaikh, MD (Neurology, Case Western Reserve) for providing important clinical data.
This work was supported by the US National Institutes of Health grants NS056780 (MB), NS069844 (CC), and F32NS098611 (RI), the National Ataxia Foundation (MB), European Union’s Horizon 2020 research innovation program under the ERA-NET Cofund action N° 643578, ZonMW (9003037604; BvdW) under the frame of the E-Rare-3 network PREPARE, the Hersenstichting (BvdW), Radboud university medical centre (BvdW) and Bioblast Pharma (BvdW), the Foundation of the University Hospital Schleswig-Holstein (“Gutes Tun!”, AM), and a career development award from the Hermann and Lilly Schilling Foundation (CK).
Footnotes
Author Contributions:
JZL, AM, VS, CK, CC, KL, BvdW, MB contributed to the conception and design of the study
ESe, RI, MD, E-JK, JT, NB, ESa, SL, ABO, TJ, AJAK contributed to acquisition and analysis of data
ESe, RI, MD, E-JK, CK, CC, KL, BvdW, MB contributed to drafting the text and preparing the figures
Potential Conflicts of Interests:
None of the authors report COI relevant to the reported work. See disclosures for other detailed COI
Literature Cited
- 1.Sandford E, Burmeister M. Genes and genetic testing in hereditary ataxias. Genes (Basel) 2014;5(3):586–603. doi: 10.3390/genes5030586. [DOI] [PMC free article] [PubMed] [Google Scholar]
- 2.Beaudin M, Klein CJ, Rouleau GA, Dupre N. Systematic review of autosomal recessive ataxias and proposal for a classification. Cerebellum Ataxias. 2017;4:3. doi: 10.1186/s40673-017-0061-y. [DOI] [PMC free article] [PubMed] [Google Scholar]
- 3.Marras C, Lang A, van de Warrenburg BP, et al. Nomenclature of genetic movement disorders: Recommendations of the International Parkinson and Movement Disorder Society task force. Mov Disord. 2017 May;32(5):724–5. doi: 10.1002/mds.27045. [DOI] [PubMed] [Google Scholar]
- 4.Fogel BL, Lee H, Deignan JL, et al. Exome sequencing in the clinical diagnosis of sporadic or familial cerebellar ataxia. JAMA Neurol. 2014 Oct;71(10):1237–46. doi: 10.1001/jamaneurol.2014.1944. [DOI] [PMC free article] [PubMed] [Google Scholar]
- 5.Synofzik M, Schule R. Overcoming the divide between ataxias and spastic paraplegias: Shared phenotypes, genes, and pathways. Mov Disord. 2017 Mar;32(3):332–45. doi: 10.1002/mds.26944. [DOI] [PMC free article] [PubMed] [Google Scholar]
- 6.Swartz BE, Burmeister M, Somers JT, Rottach KG, Bespalova IN, Leigh RJ. A form of inherited cerebellar ataxia with saccadic intrusions, increased saccadic speed, sensory neuropathy, and myoclonus. Ann N Y Acad Sci. 2002 Apr;956:441–4. doi: 10.1111/j.1749-6632.2002.tb02850.x. [DOI] [PubMed] [Google Scholar]
- 7.Swartz BE, Li S, Bespalova I, et al. Pathogenesis of clinical signs in recessive ataxia with saccadic intrusions. Ann Neurol. 2003 Dec;54(6):824–8. doi: 10.1002/ana.10758. [DOI] [PubMed] [Google Scholar]
- 8.Sobreira N, Schiettecatte F, Valle D, Hamosh A. GeneMatcher: a matching tool for connecting investigators with an interest in the same gene. Hum Mutat. 2015 Oct;36(10):928–30. doi: 10.1002/humu.22844. [DOI] [PMC free article] [PubMed] [Google Scholar]
- 9.Abecasis GR, Cherny SS, Cookson WO, Cardon LR. Merlin--rapid analysis of dense genetic maps using sparse gene flow trees. Nat Genet. 2002 Jan;30(1):97–101. doi: 10.1038/ng786. [DOI] [PubMed] [Google Scholar]
- 10.Trujillano D, Bertoli-Avella AM, Kumar Kandaswamy K, et al. Clinical exome sequencing: results from 2819 samples reflecting 1000 families. Eur J Hum Genet. 2017 Feb;25(2):176–82. doi: 10.1038/ejhg.2016.146. [DOI] [PMC free article] [PubMed] [Google Scholar]
- 11.van de Warrenburg BP, Schouten MI, de Bot ST, et al. Clinical exome sequencing for cerebellar ataxia and spastic paraplegia uncovers novel gene-disease associations and unanticipated rare disorders. Eur J Hum Genet. 2016 Oct;24(10):1460–6. doi: 10.1038/ejhg.2016.42. [DOI] [PMC free article] [PubMed] [Google Scholar]
- 12.Desmet FO, Hamroun D, Lalande M, Collod-Beroud G, Claustres M, Beroud C. Human Splicing Finder: an online bioinformatics tool to predict splicing signals. Nucleic Acids Res. 2009 May;37(9):e67. doi: 10.1093/nar/gkp215. [DOI] [PMC free article] [PubMed] [Google Scholar]
- 13.Schindelin J, Arganda-Carreras I, Frise E, et al. Fiji: an open-source platform for biological-image analysis. Nat Methods. 2012 Jun 28;9(7):676–82. doi: 10.1038/nmeth.2019. [DOI] [PMC free article] [PubMed] [Google Scholar]
- 14.Grunewald A, Voges L, Rakovic A, et al. Mutant Parkin impairs mitochondrial function and morphology in human fibroblasts. PLoS One. 2010 Sep 27;5(9):e12962. doi: 10.1371/journal.pone.0012962. [DOI] [PMC free article] [PubMed] [Google Scholar]
- 15.Pilling AD, Horiuchi D, Lively CM, Saxton WM. Kinesin-1 and Dynein are the primary motors for fast transport of mitochondria in Drosophila motor axons. Mol Biol Cell. 2006 Apr;17(4):2057–68. doi: 10.1091/mbc.E05-06-0526. [DOI] [PMC free article] [PubMed] [Google Scholar]
- 16.Klinedinst S, Wang X, Xiong X, Haenfler JM, Collins CA. Independent pathways downstream of the Wnd/DLK MAPKKK regulate synaptic structure, axonal transport, and injury signaling. J Neurosci. 2013 Jul 31;33(31):12764–78. doi: 10.1523/JNEUROSCI.5160-12.2013. [DOI] [PMC free article] [PubMed] [Google Scholar]
- 17.Carelli V, Sabatelli M, Carrozzo R, et al. ‘Behr syndrome’ with OPA1 compound heterozygote mutations. Brain. 2015 Jan;138(Pt 1):e321. doi: 10.1093/brain/awu234. [DOI] [PMC free article] [PubMed] [Google Scholar]
- 18.Myers MD, Payne GS. Vps13 and Cdc31/centrin: Puzzling partners in membrane traffic. J Cell Biol. 2017 Feb;216(2):299–301. doi: 10.1083/jcb.201612026. [DOI] [PMC free article] [PubMed] [Google Scholar]
- 19.Velayos-Baeza A, Vettori A, Copley RR, Dobson-Stone C, Monaco AP. Analysis of the human VPS13 gene family. Genomics. 2004 Sep;84(3):536–49. doi: 10.1016/j.ygeno.2004.04.012. [DOI] [PubMed] [Google Scholar]
- 20.Vonk JJ, Yeshaw WM, Pinto F, et al. Drosophila Vps13 Is Required for Protein Homeostasis in the Brain. PLoS One. 2017;12(1):e0170106. doi: 10.1371/journal.pone.0170106. [DOI] [PMC free article] [PubMed] [Google Scholar]
- 21.Tomemori Y, Ichiba M, Kusumoto A, et al. A gene-targeted mouse model for chorea-acanthocytosis. J Neurochem. 2005 Feb;92(4):759–66. doi: 10.1111/j.1471-4159.2004.02924.x. [DOI] [PubMed] [Google Scholar]
- 22.Petrovski S, Gussow AB, Wang Q, et al. The Intolerance of Regulatory Sequence to Genetic Variation Predicts Gene Dosage Sensitivity. PLoS Genet. 2015 Sep;11(9):e1005492. doi: 10.1371/journal.pgen.1005492. [DOI] [PMC free article] [PubMed] [Google Scholar]
- 23.Dobson-Stone C, Velayos-Baeza A, Jansen A, et al. Identification of a VPS13A founder mutation in French Canadian families with chorea-acanthocytosis. Neurogenetics. 2005 Sep;6(3):151–8. doi: 10.1007/s10048-005-0220-9. [DOI] [PubMed] [Google Scholar]
- 24.Hennies HC, Rauch A, Seifert W, et al. Allelic heterogeneity in the COH1 gene explains clinical variability in Cohen syndrome. Am J Hum Genet. 2004 Jul;75(1):138–45. doi: 10.1086/422219. [DOI] [PMC free article] [PubMed] [Google Scholar]
- 25.Katzaki E, Pescucci C, Uliana V, et al. Clinical and molecular characterization of Italian patients affected by Cohen syndrome. J Hum Genet. 2007;52(12):1011–7. doi: 10.1007/s10038-007-0208-4. [DOI] [PubMed] [Google Scholar]
- 26.Kolehmainen J, Wilkinson R, Lehesjoki AE, et al. Delineation of Cohen syndrome following a large-scale genotype-phenotype screen. Am J Hum Genet. 2004 Jul;75(1):122–7. doi: 10.1086/422197. [DOI] [PMC free article] [PubMed] [Google Scholar]
- 27.Seifert W, Holder-Espinasse M, Kuhnisch J, et al. Expanded mutational spectrum in Cohen syndrome, tissue expression, and transcript variants of COH1. Hum Mutat. 2009 Feb;30(2):E404–20. doi: 10.1002/humu.20886. [DOI] [PubMed] [Google Scholar]
- 28.Seifert W, Holder-Espinasse M, Spranger S, et al. Mutational spectrum of COH1 and clinical heterogeneity in Cohen syndrome. J Med Genet. 2006 May;43(5):e22. doi: 10.1136/jmg.2005.039867. [DOI] [PMC free article] [PubMed] [Google Scholar]
- 29.Lesage S, Drouet V, Majounie E, et al. Loss of VPS13C Function in Autosomal-Recessive Parkinsonism Causes Mitochondrial Dysfunction and Increases PINK1/Parkin-Dependent Mitophagy. Am J Hum Genet. 2016 Mar 3;98(3):500–13. doi: 10.1016/j.ajhg.2016.01.014. [DOI] [PMC free article] [PubMed] [Google Scholar]
- 30.Schormair B, Kemlink D, Mollenhauer B, et al. Diagnostic exome sequencing in early-onset Parkinson’s disease confirms VPS13C as a rare cause of autosomal-recessive Parkinson’s disease. Clin Genet. 2017 Sep 01; doi: 10.1111/cge.13124. [DOI] [PubMed] [Google Scholar]
- 31.Dietzl G, Chen D, Schnorrer F, et al. A genome-wide transgenic RNAi library for conditional gene inactivation in Drosophila. Nature. 2007 Jul 12;448(7150):151–6. doi: 10.1038/nature05954. [DOI] [PubMed] [Google Scholar]
- 32.Baloh RH. Mitochondrial dynamics and peripheral neuropathy. Neuroscientist. 2008 Feb;14(1):12–8. doi: 10.1177/1073858407307354. [DOI] [PubMed] [Google Scholar]
- 33.Yu Y, Lee HC, Chen KC, et al. Inner membrane fusion mediates spatial distribution of axonal mitochondria. Sci Rep. 2016 Jan 08;6:18981. doi: 10.1038/srep18981. [DOI] [PMC free article] [PubMed] [Google Scholar]
- 34.Posey JE, Harel T, Liu P, et al. Resolution of Disease Phenotypes Resulting from Multilocus Genomic Variation. N Engl J Med. 2017 Jan 5;376(1):21–31. doi: 10.1056/NEJMoa1516767. [DOI] [PMC free article] [PubMed] [Google Scholar]
- 35.Pfundt R, Del Rosario M, Vissers L, et al. Detection of clinically relevant copy-number variants by exome sequencing in a large cohort of genetic disorders. Genet Med. 2017 Jun;19(6):667–75. doi: 10.1038/gim.2016.163. [DOI] [PMC free article] [PubMed] [Google Scholar]
- 36.de Bot ST, Willemsen MA, Vermeer S, Kremer HP, van de Warrenburg BP. Reviewing the genetic causes of spastic-ataxias. Neurology. 2012 Oct 02;79(14):1507–14. doi: 10.1212/WNL.0b013e31826d5fb0. [DOI] [PubMed] [Google Scholar]
- 37.van Gassen KL, van der Heijden CD, de Bot ST, et al. Genotype-phenotype correlations in spastic paraplegia type 7: a study in a large Dutch cohort. Brain. 2012 Oct;135(Pt 10):2994–3004. doi: 10.1093/brain/aws224. [DOI] [PubMed] [Google Scholar]
- 38.Demain LA, Conway GS, Newman WG. Genetics of mitochondrial dysfunction and infertility. Clin Genet. 2017 Feb;91(2):199–207. doi: 10.1111/cge.12896. [DOI] [PubMed] [Google Scholar]
- 39.Tomiyasu A, Nakamura M, Ichiba M, et al. Novel pathogenic mutations and copy number variations in the VPS13A gene in patients with chorea-acanthocytosis. Am J Med Genet B Neuropsychiatr Genet. 2011 Jul;156B(5):620–31. doi: 10.1002/ajmg.b.31206. [DOI] [PubMed] [Google Scholar]
- 40.Balikova I, Lehesjoki AE, de Ravel TJ, et al. Deletions in the VPS13B (COH1) gene as a cause of Cohen syndrome. Hum Mutat. 2009 Sep;30(9):E845–54. doi: 10.1002/humu.21065. [DOI] [PubMed] [Google Scholar]
- 41.Megarbane A, Slim R, Nurnberg G, Ebermann I, Nurnberg P, Bolz HJ. A novel VPS13B mutation in two brothers with Cohen syndrome, cutis verticis gyrata and sensorineural deafness. Eur J Hum Genet. 2009 Aug;17(8):1076–9. doi: 10.1038/ejhg.2008.273. [DOI] [PMC free article] [PubMed] [Google Scholar]
- 42.Exome Aggregation Consortium (ExAC) Cambridge, MA: 2015. [updated 2015/01/16/]; Available from: http://exac.broadinstitute.org. [Google Scholar]
- 43.Chun BY, Rizzo JF., 3rd Dominant optic atrophy: updates on the pathophysiology and clinical manifestations of the optic atrophy 1 mutation. Curr Opin Ophthalmol. 2016 Nov;27(6):475–80. doi: 10.1097/ICU.0000000000000314. [DOI] [PubMed] [Google Scholar]
- 44.Jasoliya MJ, McMackin MZ, Henderson CK, Perlman SL, Cortopassi GA. Frataxin Deficiency Impairs Mitochondrial Biogenesis in Cells, Mice and Humans. Hum Mol Genet. 2017 Apr 21; doi: 10.1093/hmg/ddx141. [DOI] [PMC free article] [PubMed] [Google Scholar]
- 45.Pierson TM, Adams D, Bonn F, et al. Whole-exome sequencing identifies homozygous AFG3L2 mutations in a spastic ataxia-neuropathy syndrome linked to mitochondrial m-AAA proteases. PLoS Genet. 2011 Oct;7(10):e1002325. doi: 10.1371/journal.pgen.1002325. [DOI] [PMC free article] [PubMed] [Google Scholar]
- 46.Finsterer J. Ataxias with autosomal, X-chromosomal or maternal inheritance. Can J Neurol Sci. 2009 Jul;36(4):409–28. doi: 10.1017/s0317167100007733. [DOI] [PubMed] [Google Scholar]
- 47.Shanmughapriya S, Rajan S, Hoffman NE, et al. SPG7 Is an Essential and Conserved Component of the Mitochondrial Permeability Transition Pore. Mol Cell. 2015 Oct 01;60(1):47–62. doi: 10.1016/j.molcel.2015.08.009. [DOI] [PMC free article] [PubMed] [Google Scholar]
- 48.Bargiela D, Shanmugarajah P, Lo C, et al. Mitochondrial pathology in progressive cerebellar ataxia. Cerebellum Ataxias. 2015;2:16. doi: 10.1186/s40673-015-0035-x. [DOI] [PMC free article] [PubMed] [Google Scholar]
- 49.Hayashi G, Cortopassi G. Oxidative stress in inherited mitochondrial diseases. Free Radic Biol Med. 2015 Nov;88(Pt A):10–7. doi: 10.1016/j.freeradbiomed.2015.05.039. [DOI] [PMC free article] [PubMed] [Google Scholar]
- 50.Anding AL, Wang C, Chang TK, et al. Vps13D Encodes a Ubiquitin-Binding Protein that Is Required for the Regulation of Mitochondrial Size and Clearance. Curr Biol. 2017 Dec 30; doi: 10.1016/j.cub.2017.11.064. [DOI] [PMC free article] [PubMed] [Google Scholar]
- 51.Kim M, Sandford E, Gatica D, et al. Mutation in ATG5 reduces autophagy and leads to ataxia with developmental delay. Elife. 2016 Jan;26:5. doi: 10.7554/eLife.12245. [DOI] [PMC free article] [PubMed] [Google Scholar]