Abstract
Introduction
Reversible edema is a part of any radiofrequency ablation but its relationship with contact force is unknown. The goal of this study was to characterize through histology and MRI, acute and chronic ablation lesions and reversible edema with contact force.
Methods and Results
In a canine model (n=14), chronic ventricular lesions were created with a 3.5 mm tip ThermoCool SmartTouch (Biosense Webster) catheter at 25W or 40W for 30 sec. Repeat ablation was performed after 3 months to create a second set of lesions (acute). Each ablation procedure was followed by in-vivo T2 weighted MRI for edema and late-gadolinium enhancement (LGE) MRI for lesion characterization. For chronic lesions, the mean scar volumes at 25W and 40W were 77.8 ± 34.5 mm3 (n=24) and 139.1 ± 69.7 mm3 (n=12), respectively. The volume of chronic lesions increased (25W: p<0.001, 40W: p<0.001) with greater contact force. For acute lesions, the mean volumes of the lesion were 286.0 ± 129.8 (n=19) mm3 and 422.1 ± 113.1 mm3 (n=16) for 25W and 40W, respectively (p<0.001 compared to chronic scar). On T2 weighted MRI, the acute edema volume was on average 5.6 to 8.7 times higher than the acute lesion volume and increased with contact force (25W: p=0.001, 40W: p=0.011).
Conclusion
With increasing contact force, there is a marginal increase in lesion size but accompanied with a significantly larger edema. The reversible edema that is much larger than the chronic lesion volume may explain some of the chronic procedure failures.
Keywords: RF ablation, contact force, MRI, lesion visualization, edema, acute and chronic lesions
Introduction
Radiofrequency catheter ablation is routinely used to treat cardiac arrhythmias. [1, 2] We have previously shown that not all areas targeted for ablation result in permanent scar and that the clinical consequences include arrhythmia recurrence. [3, 4] There has been significant, recent improvement in ablation techniques, such as using contact force catheters to improve ablation efficiency. [5] The reported range of force values used to ablate is very wide range and that is partly because there are no accepted standards. Prior animal studies have indicated that there is no difference in scar formation in the atrium when using low versus high force. [6] Other studies, executed in the ventricle, have shown deeper lesions with higher contact force but higher contact force has also been associated with steam pops. [7] Studies have also shown the formation of significant edema during ablation [6, 8] and this edema is thought to be a cause of reversible pulmonary vein isolation. [9] Clearly, it is preferable to create fully transmural lesions in the atria or the ventricle with minimal edema to ensure successful, long term conduction block across ablation lines. The goal of this study was to characterize using histology and MRI imaging both of acute and chronic lesions to identify reversible edema created during ablation, all in relation to contact force and power.
Methods
Electrophysiology and Ablation
The study was performed in a canine model (n=14) using healthy animals. The protocol was approved by the Institutional Animal Care and Use Committee. The animals were maintained in a surgical plane of anesthesia using 1.5-3% isoflurane. A SL0 sheath through the left femoral vein was used to go transseptal and gain left atrial access under ICE (Cypress, Siemens) and fluoroscopy guidance. A fast-anatomical map (FAM) of the ventricular chambers was created using CARTO3 (Biosense Webster, CA) and lesion sites were marked on the endocardial surface map. Ablation lesions were placed in the left and right ventricles using a SmartTouch ThermoCool catheter (Biosense Webster). Ablation parameters included varying contact force from 5 to 50 grams while in a power controlled mode setting at either 25W or 40W for 30 seconds. During the ablation procedures, 2-4 lesions were created within each of the right and left ventricles. Immediately after the ablation procedure, the animal was moved to an MRI scanner (3T, Verio, Siemens) for T2 weighted imaging for edema identification and late gadolinium enhancement (LGE) MRI to identify scar. Each canine underwent a second electrophysiological procedure 3 months after the first when a second set of ablation lesions were created. The FAM from the initial ablation set was used to guide placing lesions at sites distinct from the initial lesions. The MRI after the initial ablation was also used to identify the location of the initial set of lesions and used to place the new location to prevent overlap with the initial lesions. Following the MRI after the second ablation procedure, the animals were euthanized and the hearts removed for pathological characterization. The first series of ablations are considered to be chronic lesions while the second series of ablations are considered to be acute lesions.
Histological Lesion Characterization
The hearts were fixed in formalin and then sliced into 2 mm sections. The lesions were matched with the corresponding location in the CARTO maps. We only evaluated lesions that were distinct and had no overlap. Digital images of both sides of each slice was obtained and imported in Photoshop (Adobe Systems Inc.). The lesion on each side of the slice was outlined using the free hand Lasso tool in Photoshop. Using the free hand tool allowed us to not assume any particular shape for the lesion. The Image Analysis tool was normalized to the scale on each image and then the area of the lesion within the lasso was calculated. The area of the lesion (average of the calculated area on the two sides of the slice) was multiplied with the slice thickness to get the lesion volume for each slice. For slices that contained lesions only on one edge, the depth and area of the lesion on the surface that had the lesion were used to estimate the volume assuming a conical shape for the lesion. The volume across all the slices for each lesion was added to get the total lesion volume. Volume was computed for the scar in chronic lesions and the central white core and the peripheral black area for acute lesions. To measure the depth of the lesions, multiple incisions were made through the lesions.
MR Imaging
Following each ablation procedure, the animal was transferred while intubated to a 3 Tesla Verio, MRI scanner (Siemens HealthCare, Erlangen, Germany). We obtained both T2-weighted (T2w) images for edema as well as LGE-MRI for scar visualization and we identified the corresponding T2w and LGE lesions. The volume of enhancement for T2w as well as LGE-MRI were calculated using Osirix (Pixmeo, SARL, Geneva, Switzerland) and Seg3D (SCI Institute, University of Utah). The area of enhancement was quantified for each lesion by summing over all the slices that included that lesion. Non-contrast T2w images were acquired using respiratory navigated, ECG triggered, double-inversion recovery (DIR) prepared 2D turbo-spin echo (TSE) pulse sequence with echo time (TE)=81 ms, repetition time (TR) = 3 cardiac cycles, echo train length=21, fat suppression using SPectral Attenuated Inversion Recovery (SPAIR), in-plane resolution of 1.25×1.25 mm, slice thickness of 4 mm. LGE-MRI was acquired about 20 minutes after infusion of Gd-BOPTA (0.15 mmol/kg, Bracco Diagnostic Inc., Princeton, NJ) using respiratory navigated, ECG triggered, inversion recovery prepared 3D GRE sequence with resolution=1.25×1.25×2.5 mm, TR/TE=3.1/1.4 ms, flip angle=14°, inversion time (TI) = 230-330 ms.
Statistical Methods
The volume of the central white core (for both acute and chronic lesions) and black areas (for acute lesions only) were summarized as mean and standard deviation (SD) for each power level. Linear regression models were used to examine the association between contact force and depth/volume of the central white core (for both acute and chronic lesions) and black areas (for acute lesions only) at pre-specified power level (25 and 40 watts). A two-sample Student’s t test was performed to compare the mean of total volume for the acute lesions with the mean volume for the chronic lesions. All analyses were performed using statistical software Stata (Stata Corp., College Station, TX USA) version 13. P-values < 0.05 indicate statistically significant results.
Results
We characterized 35 acute and 36 chronic lesions in 14 hearts. Figure 1 shows the gross pathology and histology of an acute and a chronic lesion. On gross pathology (figure 1A) acute lesions have a central white core and a surrounding black area. Chronic lesions, on the other hand, (figure 1C) have a well demarcated white area of scar. Figures 1B and 1D show the acute and chronic lesions, respectively, stained for collagen using Masson’s trichrome stain. In figure 1B, the staining shows a large area of injury with gradual transition from severe injury at the core to normal tissue. Three separate regions have been highlighted to show the transition from complete destruction of the architecture at the core to more edema but persevered structure in the area surrounding the core to more normal myocardium further away.
Figure 1.
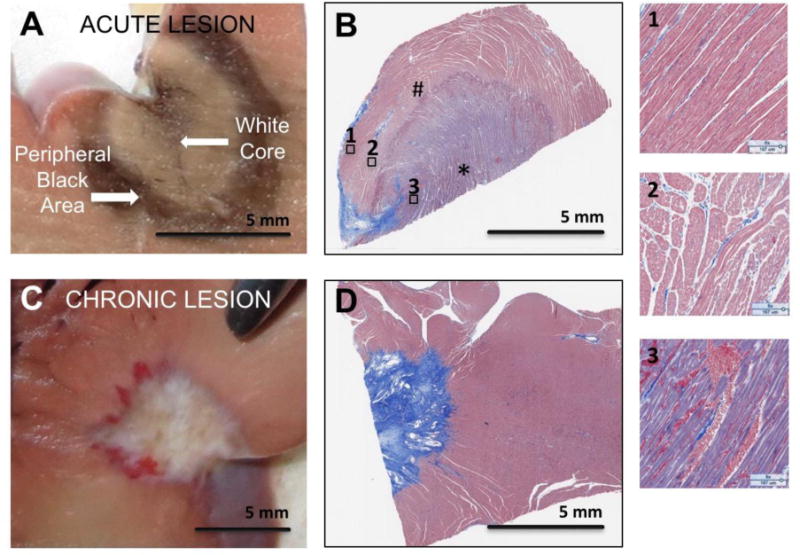
Gross pathology and histology images of acute (panels A and B) and chronic (panels C and D) ablation lesions. Panels B and D are Massons’ Trichrome Stain. Panel A shows the central black and peripheral white area seen in acute lesions starting at the enodocardial surface. Panel B is histology of an acute lesion. Three regions with much higher magnification from Panel B are shown to highlight the tissue changes in the acute lesion going from the core of the lesion (3) to more peripheral areas in 2 and 1. The core area (3) has complete destruction of the myocardial architecture and corresponds to the black area. Area 2 shows increased extracellular space and area 1 has preserved myocardial architecture. Panel C shows a chronic lesion starting at the endocardial border. Panel D shows the dense scar it the chronic lesion with a distinct boundary with normal tissue. The * area is the white core and the # is the surrounding black area.
For chronic lesions, the mean scar volumes at 25W and 40W were 77.8 ± 34.5 (n=24) mm3 and 139.1 ± 69.7 mm3 (n=12), respectively. Figure 2 shows the relationship between the chronic lesion volume/depth and contact force at 25W and 40W power. For both 25W and 40W power settings, the contact force was positively and statistically significantly associated with volume and depth of the chronic lesions (Table 1).
Figure 2.
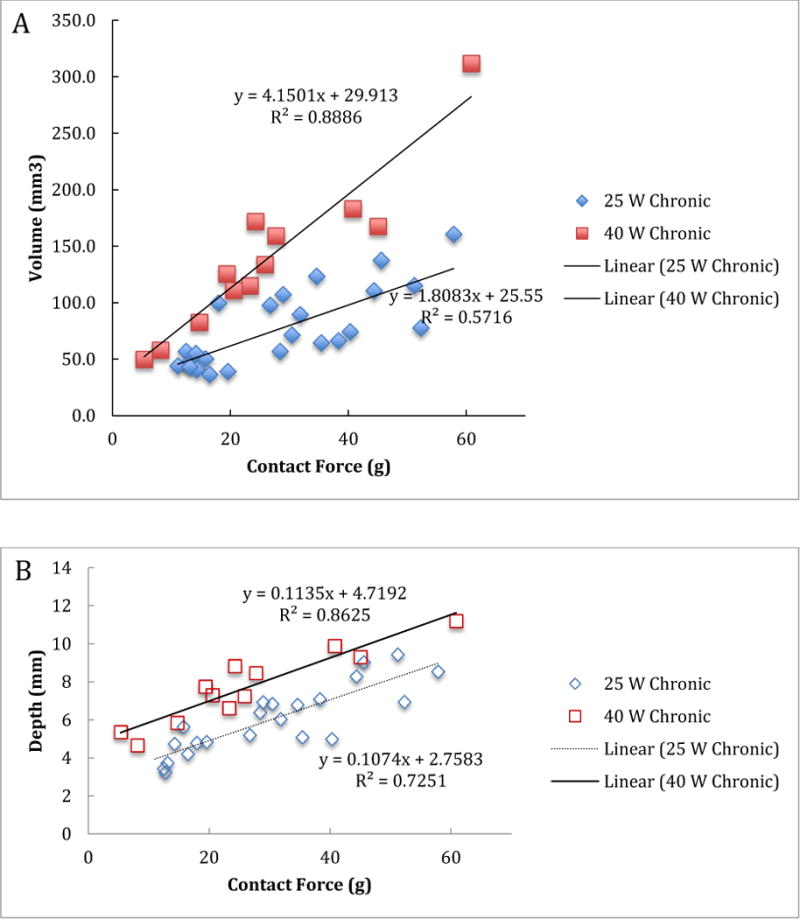
Volume (A) and depth (B) of the chronic lesions versus contact force for 25 W and 40 W power levels.
Table 1.
Chronic lesion volume and depth relationship with contact force.
| 25 W | 40 W | |||||
|---|---|---|---|---|---|---|
| slope | p-value | 95 % C.I. | slope | p-value | 95 5 C.I. | |
| Volume | 1.81 mm3 | p<0.001 | 1.12 – 2.51 | 4.15 mm3 | P<0.001 | 3.11 – 5.18 |
| Depth | 0.107 mm | p<0.001 | 0.08 – 0.14 | 0.113 mm | P<0.001 | 0.08 – 0.15 |
C.I.: Confidence Interval
For acute lesions, the mean volumes of the central white core at 25W and 40W power were 82.4 ± 35.8 mm3 (n=19) and 137.5 ± 65.1 mm3 (n=16), respectively, and the mean volumes of the black area were 286.0 ± 129.8 mm3 and 422.1 ± 113.1 mm3, respectively. The black area volumes are significantly higher than the chronic mean scar volumes (p<0.0001). Figure 3 shows the relationship between contact force and volume/depth of both black and white areas for acute lesions. For acute lesions, both at 25W and 40W power levels, the contact force was positively and statistically significantly associated with volume and depth of the both white and black areas (Table 2). We also tested whether the association between volume of the central white core and contact forces was different from that between the black volume and contact forces for acute lesions at 25W and 40W. We assumed that the volume for the central white core and volume for the black area from the same animal were independent, so used a regression model for independent data. At the 0.05 test level, the rates for the two areas were not statistically significantly different from each other (p=0.006 for 25W and p=0.04 for 40W). This result implies that the association between contact force and volume is statistically significantly different between the two areas for acute lesions at 25W and 40W.
Figure 3.
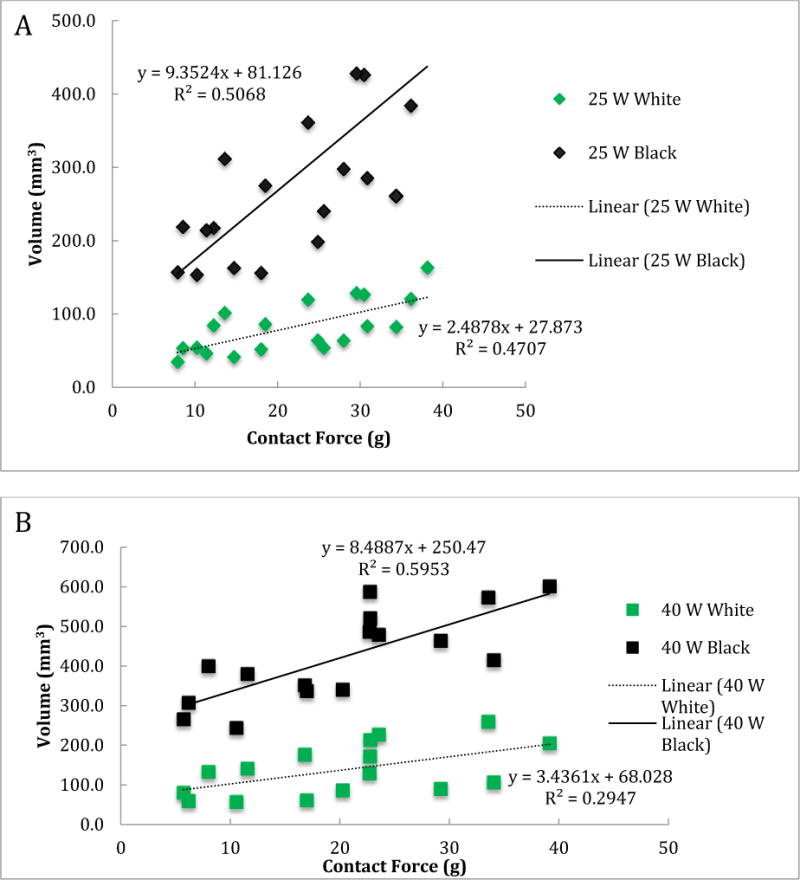
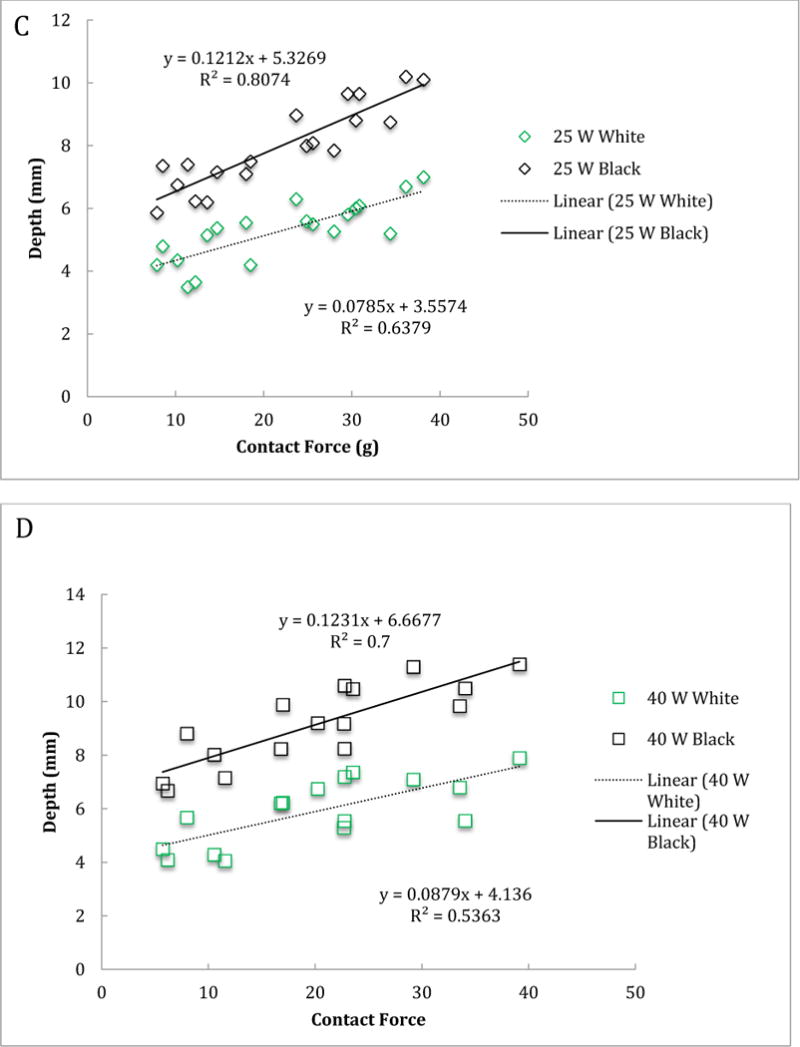
Volume (A and B) and depth (C and D) of the central white core and surrounding black area for acute lesions versus contact force for 25 W (A and C) and 40 W (B and D) power levels.
Table 2.
Acute lesion volume and depth relationship with contact force.
| 25 W | 40 W | |||||
|---|---|---|---|---|---|---|
| slope | p-value | 95 % C.I. | slope | p-value | 95 % C.I. | |
| Central White Core | ||||||
| Volume | 2.48 mm3 | p=0.001 | 1.14 – 3.84 | 3.43 mm3 | p=0.03 | 0.39 – 6.48 |
| Depth | 0.08 mm | p<0.001 | 0.05 – 0.1 | 0.08 mm | p<0.001 | 0.04 – 0.13 |
| Surrounding Black Area | ||||||
| Volume | 9.35 mm3 | p=0.001 | 4.63 – 14.07 | 8.49 mm3 | p<0.001 | 4.47 – 12.5 |
| Depth | 0.12 mm | p=0.001 | 0.09 – 0.15 | 0.12 mm | p<0.001 | 0.07 – 0.17 |
C.I.: Confidence Interval
We then compared the central white core volume of acute lesions with the chronic lesion volume and their relation to contact force (Figure 4) at both the 25W and 40W power levels. Statistically, we used the interaction term between contact force and type of lesions (chronic versus acute) to test the significance of the difference. This is also referred to as the effect modification of lesions type on the relationship between the lesion volume and contact force. At the 0.05 test level, the two relationship for chronic and acute lesions were not statistically significantly different from each other at both the 25W (p=0.332) and 40W (p=0.626) power levels. This result implies that the association between the central white core volume for acute lesions and chronic lesion volume was not statistically significantly different.
Figure 4.
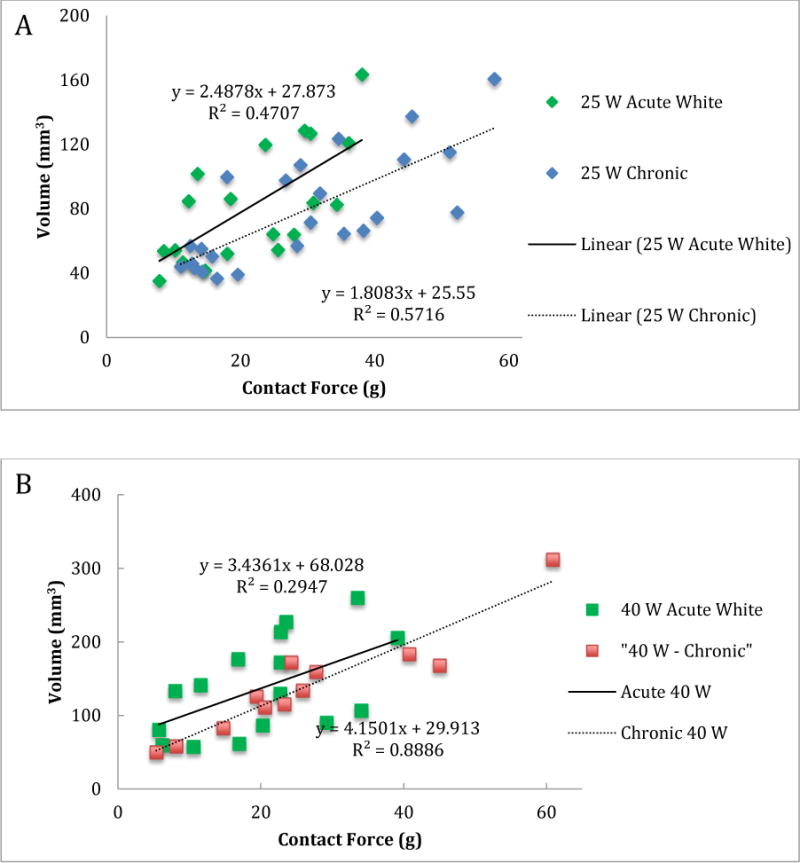
Lesion volume vs contact force for the white core of acute lesions and chronic lesions for 25 W (panel A) and 40 W (panel B) power levels
To better characterize the acute lesions, we analyzed the T2 weighted edema MR images, which showed a larger area of enhancement around acute lesions at higher contact force for the same power (Figure 5). We assessed the correlation between volume of enhancement in T2-weighted MRI and contact force for both the 25W and 40W power levels. At both powers, the volume was statistically significantly correlated with contact force; the Pearson correlation coefficient was 0.959 (p=0.001) and 0.871 (p=0.011) at the 25W and 40W power, respectively. We also fit a simple linear regression model for the volume of enhancement in T2-weighted MRI using contact force as the predictor variable (Figure 6) for both 25W and 40W power levels. The volume of enhancement in these T2-weighted images was much larger than the central white core or the black areas in the pathology for acute lesions. In T2-weighted images, the acute edema volume was, on average, 5.6 (4.43 at 25W and 6.69 at 40W at 10 g) to 8.7 times (8.03 at 25 W and 9.30 at 40W at 40 g) higher than the total acute lesion volume.
Figure 5.
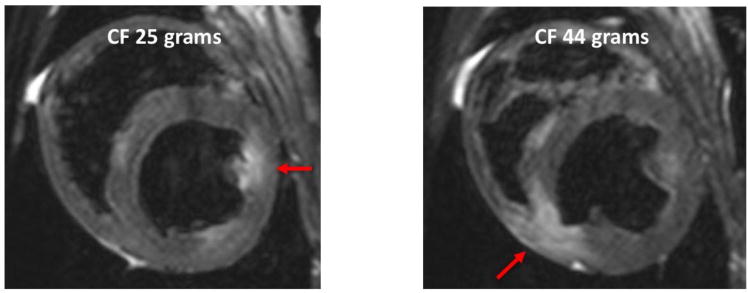
T2 weighted MRI for 25 and 44 gram force. Arrows point to the area of enhancement in the ventricles.
Figure 6.
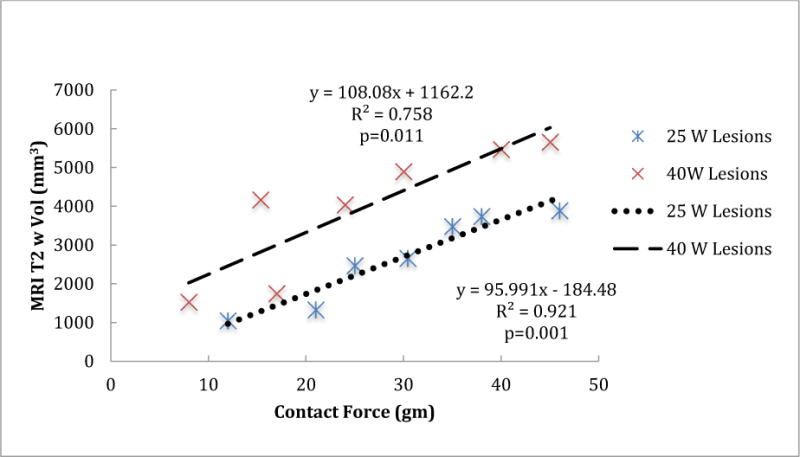
The volume of the enhanced area in the T2 weighted MR images versus the contact force for 25 W and 40 W power levels.
Discussion
The main goal of this study was to explore the relationships among contact force, power, and acute and chronic lesions evaluated with MRI and validated through histology. As expected, we found that with higher contact force, the sizes of both acute and chronic lesions were larger. The effect of lesion size with force has been reported in prior studies, but most included only acute lesions, semi acute lesions for up to 12 hrs, or ex vivo studies. [10–12] Here we examined both acute and chronic in vivo lesions. The acute lesions showed a central core of maximal damage and an area of reversible injury around each. On gross pathology, there were distinct differences in appearance between the central area of irreversible injury, which had a white core, and the surrounding area with reversible injury which was black (figure 1). The central core has been described before as the area of severe coagulation necrosis surrounded by a peripheral area of contraction band necrosis. [13, 14] We have shown for the first time that the central white area based on volume and depth measurement is a good predictor of the chronic lesion volume and depth. This finding was consistent for different powers and contact forces.
The goal when ablating is to create areas with irreversible injury that will result in scar. In a previous study evaluating ablation that targeted the left atrium for atrial fibrillation ablation, it was shown that about a third to half the area targeted for ablation does not result in long-term scar, and that this difference has clinical consequences. [3, 4] The likely explanation for achieving only acute electrical isolation of the pulmonary veins that fail chronically is the effect of edema or reversible injury. Reconnection of acutely isolated pulmonary veins is a well-known phenomenon [15, 16] and previous studies have shown that gaps can remain in lines of ablation that achieve acute electrical isolation but fail to isolate chronically, again likely due to reversible injury or edema. [9] We did not assess conduction in the edema region, as this study with discrete ablation lesions was not well suited for studying conduction block. We were able to observe and quantify the effects of ablation parameters on the development of acute edema, findings that support the notion that edema could have important impact on lesion success and patency of isolation.
We have confirmed that higher contact forces create larger chronic lesions, so other than safety and perforation risks, are there any other reasons not to use maximal force? One of the main goals of this study was to quantify areas of reversible injury in relation to contact force. We found that higher force produces a larger increase in the area of reversible injury or edema. This finding was verified both with histology (figure 3) and MRI (figures 5 and 6). The rate of increase of edema with contact force (measured by the slope of the linear fit to the volume in figure 3) was 2.5 to 3.8 times higher than the rise of central core size, which has been shown to be a good marker of chronic lesions. Similar finding was seen with depth measurement with black area having a higher slope than the acute white area for both power levels. The volume of enhancement in MRI was even higher than the changes seen in gross pathology, as shown in figure 6. Therefore, when ablating, the force used should be based on the targeted depth of the lesion to avoid excessive edema. We have shown here and in other prior studies that even with minimal force, the depth of lesions was 2 to 4 mm thick. [11, 17] Hence, for atrial ablation, 10 g force seems sufficient as most of the wall is between 1 to 3 mm thick and good contact is likely more important than the absolute force itself. [6, 18] For ventricular lesions higher force is needed to create deeper lesions.
We performed this study in the ventricles rather than the artria due to the fact that we could measure the changes in lesion size and edema continuously over a range of contact forces. Such a range of forces would be impossible in the thin walls of the atria where fully transmural lesions are achieved even with low forces. Moreover, apparent increases in atrial lesion volume could occur not because of increases in depth but rather the breadth of the lesions, further obscuring the results. While the ranges of forces and lesion volumes are clearly different between the atria and the ventricles, there is every reason to assume that the basic findings of large edema created at higher contact force can be generalized to atrial ablation as the biophysics of ablation is the same for the two chambers.
It is appealing to envison imaging approaches that could help determine extent of lesion during the procedure. Real time MRI techniques provide an immediate and direct means of measuring ablation related tissue changes in addition to improved visualization of the tissue, as shown by numerous prior studies. [8, 19–21] Despite this appeal of using MRI in real time, the techniques are still being developed and are not ready for clinical use. [22] As a result, one has to rely on indirect measurements and test for electrical isolation using functional assays. Our study gives a more quantitative assessment of the extent of reversible injury that is created with varying force and it should be factored in when setting the contact force for ablation.
Conclusion
Higher contact force leads to bigger lesions but is associated with larger edema. When ablating one has to balance the increased lesion size with more edema at higher contact force.
Acknowledgments
Funding Sources:
This work was partly supported in part by a Biosense Webster research grant to University of Utah with Ravi Ranjan as the PI. Ravi Ranjan is also supported by NIH grant K23HL115084 and Derek Dosdall is supported by NIH grant R01HL128752. Seg3D software development was supported by the National Institute of General Medical Sciences of the NIH under grant number P41 GM103545-18
Disclosures.
Ravi Ranjan has research grants from NIH, Abbott and Medtronic and is a consultant to Abbott and Medtronic.
Footnotes
Eugene Kholmovski is a consultant to and has equity interest in Marrek Inc. John Ashton is employed by Biosense Webster. Other authors: No disclosures.
References
- 1.Aliot EM, Stevenson WG, Almendral-Garrote JM, Bogun F, Calkins CH, Delacretaz E, Della Bella P, Hindricks G, Jais P, Josephson ME, Kautzner J, Kay GN, Kuck KH, Lerman BB, Marchlinski F, Reddy V, Schalij MJ, Schilling R, Soejima K, Wilber D. EHRA/HRS Expert Consensus on Catheter Ablation of Ventricular Arrhythmias: developed in a partnership with the European Heart Rhythm Association (EHRA), a Registered Branch of the European Society of Cardiology (ESC), and the Heart Rhythm Society (HRS); in collaboration with the American College of Cardiology (ACC) and the American Heart Association (AHA) Heart Rhythm. 2009;6:886–933. doi: 10.1016/j.hrthm.2009.04.030. [DOI] [PubMed] [Google Scholar]
- 2.Calkins H, Kuck KH, Cappato R, Brugada J, Camm AJ, Chen SA, Crijns HJ, Damiano RJ, Jr, Davies DW, DiMarco J, Edgerton J, Ellenbogen K, Ezekowitz MD, Haines DE, Haissaguerre M, Hindricks G, Iesaka Y, Jackman W, Jalife J, Jais P, Kalman J, Keane D, Kim YH, Kirchhof P, Klein G, Kottkamp H, Kumagai K, Lindsay BD, Mansour M, Marchlinski FE, McCarthy PM, Mont JL, Morady F, Nademanee K, Nakagawa H, Natale A, Nattel S, Packer DL, Pappone C, Prystowsky E, Raviele A, Reddy V, Ruskin JN, Shemin RJ, Tsao HM, Wilber D. 2012 HRS/EHRA/ECAS expert consensus statement on catheter and surgical ablation of atrial fibrillation: recommendations for patient selection, procedural techniques, patient management and follow-up, definitions, endpoints, and research trial design: a report of the Heart Rhythm Society (HRS) Task Force on Catheter and Surgical Ablation of Atrial Fibrillation. Heart Rhythm. 2012;9:632–696e621. doi: 10.1016/j.hrthm.2011.12.016. [DOI] [PubMed] [Google Scholar]
- 3.Parmar BR, Jarrett TR, Burgon NS, Kholmovski EG, Akoum NW, Hu N, Macleod RS, Marrouche NF, Ranjan R. Comparison of left atrial area marked ablated in electroanatomical maps with scar in MRI. J Cardiovasc Electrophysiol. 2014;25:457–463. doi: 10.1111/jce.12357. [DOI] [PMC free article] [PubMed] [Google Scholar]
- 4.Parmar BR, Jarrett TR, Kholmovski EG, Hu N, Parker D, MacLeod RS, Marrouche NF, Ranjan R. Poor scar formation after ablation is associated with atrial fibrillation recurrence. Journal of interventional cardiac electrophysiology : an international journal of arrhythmias and pacing. 2015;44:247–256. doi: 10.1007/s10840-015-0060-y. [DOI] [PMC free article] [PubMed] [Google Scholar]
- 5.Natale A, Reddy VY, Monir G, Wilber DJ, Lindsay BD, McElderry HT, Kantipudi C, Mansour MC, Melby DP, Packer DL, Nakagawa H, Zhang B, Stagg RB, Boo LM, Marchlinski FE. Paroxysmal AF catheter ablation with a contact force sensing catheter: results of the prospective, multicenter SMART-AF trial. Journal of the American College of Cardiology. 2014;64:647–656. doi: 10.1016/j.jacc.2014.04.072. [DOI] [PubMed] [Google Scholar]
- 6.Williams SE, Harrison J, Chubb H, Bloch LO, Andersen NP, Dam H, Karim R, Whitaker J, Gill J, Cooklin M, Rinaldi CA, Rhode K, Wright M, Schaeffter T, Kim WY, Jensen H, Razavi R, O’Neill MD. The effect of cotnact force in atrial RF ablation: electroanatomical, CMR, and histological assessment in a chronic poricne model. JACC Clin Electrophysiol. 2015;1:421–431. doi: 10.1016/j.jacep.2015.06.003. [DOI] [PubMed] [Google Scholar]
- 7.Ikeda A, Nakagawa H, Lambert H, Shah DC, Fonck E, Yulzari A, Sharma T, Pitha JV, Lazzara R, Jackman WM. Relationship between catheter contact force and radiofrequency lesion size and incidence of steam pop in the beating canine heart: electrogram amplitude, impedance, and electrode temperature are poor predictors of electrode-tissue contact force and lesion size. Circ Arrhythm Electrophysiol. 2014;7:1174–1180. doi: 10.1161/CIRCEP.113.001094. [DOI] [PubMed] [Google Scholar]
- 8.Ghafoori E, Kholmovski EG, Thomas S, Silvernagel J, Angel N, Hu N, Dosdall DJ, MacLeod R, Ranjan R. Characterization of Gadolinium Contrast Enhancement of Radiofrequency Ablation Lesions in Predicting Edema and Chronic Lesion Size. Circ Arrhythm Electrophysiol. 2017;10 doi: 10.1161/CIRCEP.117.005599. [DOI] [PMC free article] [PubMed] [Google Scholar]
- 9.Ranjan R, Kato R, Zviman MM, Dickfeld TM, Roguin A, Berger RD, Tomaselli GF, Halperin HR. Gaps in the Ablation Line as a Potential Cause of Recovery from Electrical Isolation and their Visualization using MRI. Circ Arrhythm Electrophysiol. 2011;4:279–286. doi: 10.1161/CIRCEP.110.960567. [DOI] [PMC free article] [PubMed] [Google Scholar]
- 10.Shah DC, Lambert H, Nakagawa H, Langenkamp A, Aeby N, Leo G. Area under the real-time contact force curve (force-time integral) predicts radiofrequency lesion size in an in vitro contractile model. J Cardiovasc Electrophysiol. 2010;21:1038–1043. doi: 10.1111/j.1540-8167.2010.01750.x. [DOI] [PubMed] [Google Scholar]
- 11.Yokoyama K, Nakagawa H, Shah DC, Lambert H, Leo G, Aeby N, Ikeda A, Pitha JV, Sharma T, Lazzara R, Jackman WM. Novel contact force sensor incorporated in irrigated radiofrequency ablation catheter predicts lesion size and incidence of steam pop and thrombus. Circ Arrhythm Electrophysiol. 2008;1:354–362. doi: 10.1161/CIRCEP.108.803650. [DOI] [PubMed] [Google Scholar]
- 12.Thiagalingam A, D’Avila A, Foley L, Guerrero JL, Lambert H, Leo G, Ruskin JN, Reddy VY. Importance of catheter contact force during irrigated radiofrequency ablation: evaluation in a porcine ex vivo model using a force-sensing catheter. J Cardiovasc Electrophysiol. 2010;21:806–811. doi: 10.1111/j.1540-8167.2009.01693.x. [DOI] [PubMed] [Google Scholar]
- 13.Dickfeld T, Kato R, Zviman M, Lai S, Meininger G, Lardo AC, Roguin A, Blumke D, Berger R, Calkins H, Halperin H. Characterization of radiofrequency ablation lesions with gadolinium-enhanced cardiovascular magnetic resonance imaging. J Am Coll Cardiol. 2006;47:370–378. doi: 10.1016/j.jacc.2005.07.070. [DOI] [PMC free article] [PubMed] [Google Scholar]
- 14.Dickfeld T, Kato R, Zviman M, Nazarian S, Dong J, Ashikaga H, Lardo AC, Berger RD, Calkins H, Halperin H. Characterization of acute and subacute radiofrequency ablation lesions with nonenhanced magnetic resonance imaging. Heart Rhythm. 2007;4:208–214. doi: 10.1016/j.hrthm.2006.10.019. [DOI] [PMC free article] [PubMed] [Google Scholar]
- 15.Ouyang F, Antz M, Ernst S, Hachiya H, Mavrakis H, Deger FT, Schaumann A, Chun J, Falk P, Hennig D, Liu X, Bansch D, Kuck KH. Recovered pulmonary vein conduction as a dominant factor for recurrent atrial tachyarrhythmias after complete circular isolation of the pulmonary veins: lessons from double Lasso technique. Circulation. 2005;111:127–135. doi: 10.1161/01.CIR.0000151289.73085.36. [DOI] [PubMed] [Google Scholar]
- 16.Cheema A, Dong J, Dalal D, Marine JE, Henrikson CA, Spragg D, Cheng A, Nazarian S, Bilchick K, Sinha S, Scherr D, Almasry I, Halperin H, Berger R, Calkins H. Incidence and time course of early recovery of pulmonary vein conduction after catheter ablation of atrial fibrillation. J Cardiovasc Electrophysiol. 2007;18:387–391. doi: 10.1111/j.1540-8167.2007.00760.x. [DOI] [PubMed] [Google Scholar]
- 17.Weiss C, Antz M, Eick O, Eshagzaiy K, Meinertz T, Willems S. Radiofrequency catheter ablation using cooled electrodes: impact of irrigation flow rate and catheter contact pressure on lesion dimensions. Pacing Clin Electrophysiol. 2002;25:463–469. doi: 10.1046/j.1460-9592.2002.00463.x. [DOI] [PubMed] [Google Scholar]
- 18.Ranjan R. Is Good Contact Enough for Atrial Fibrillation Ablation? JACC: Clin Electr. 2015;1:432–433. doi: 10.1016/j.jacep.2015.08.001. [DOI] [PubMed] [Google Scholar]
- 19.Kholmovski EG, Coulombe N, Silvernagel J, Angel N, Parker D, Macleod R, Marrouche N, Ranjan R. Real-Time MRI-Guided Cardiac Cryo-Ablation: A Feasibility Study. J Cardiovasc Electrophysiol. 2016;27:602–608. doi: 10.1111/jce.12950. [DOI] [PMC free article] [PubMed] [Google Scholar]
- 20.Nazarian S, Kolandaivelu A, Zviman MM, Meininger GR, Kato R, Susil RC, Roguin A, Dickfeld TL, Ashikaga H, Calkins H, Berger RD, Bluemke DA, Lardo AC, Halperin HR. Feasibility of real-time magnetic resonance imaging for catheter guidance in electrophysiology studies. Circulation. 2008;118:223–229. doi: 10.1161/CIRCULATIONAHA.107.742452. [DOI] [PMC free article] [PubMed] [Google Scholar]
- 21.Yamashita K, Quang C, Schroeder JD, DiBella E, Han F, MacLeod R, Dosdall DJ, Ranjan R. Distance between the left atrium and the vertebral body is predictive of esophageal movement in serial MR imaging. J Interv Card Electrophysiol. 2018 doi: 10.1007/s10840-018-0348-9. [DOI] [PMC free article] [PubMed] [Google Scholar]
- 22.Bhagirath P, van der Graaf M, Karim R, Rhode K, Piorkowski C, Razavi R, Schwitter J, Gotte M. Interventional cardiac magnetic resonance imaging in electrophysiology: advances toward clinical translation. Circ Arrhythm Electrophysiol. 2015;8:203–211. doi: 10.1161/CIRCEP.114.002371. [DOI] [PubMed] [Google Scholar]


