

Abstract
Aims
Female reproductive history has been inconsistently associated with risk of type 2 diabetes. We examined the prospective associations between aspects of a woman’s reproductive history and incident diabetes.
Methods
This study pooled 126,721 middle-aged women’s individual data from eight cohort studies contributing to the International Collaboration for a Life Course Approach to Reproductive Health and Chronic Disease Events (InterLACE). Associations between age at menarche, age at first birth, parity and menopausal status with incident diabetes were examined using generalized linear mixed models with binomial distribution and robust variance. We stratified by body mass index (BMI) when there was evidence of a statistical interaction with BMI.
Results
Over a median follow-up of 9 years, 4,073 cases of diabetes were reported. Non-linear associations with diabetes were observed for age at menarche, parity and age at first birth. Compared with menarche at age 13, menarche at ≤10 years was associated with 18% increased risk of diabetes (Relative Risk [RR] 1.18, 95% Confidence interval [95%CI]: 1.02–1.37) after adjusting for BMI. After stratifying by BMI, the increase risk was only observed in women with BMI ≥25 kg/m2. A U-shape relation was observed between parity and risk of diabetes. Compared with pre-/peri-menopausal women, women with a hysterectomy/oophorectomy had an increased risk of diabetes (RR 1.17, 95% CI: 1.07–1.29).
Conclusions
Several markers of a woman’s reproductive history appear to be modestly associated with future risk of diabetes. Maintaining a normal weight in adult life may ameliorate any increase in risk conferred by early onset of menarche.
Keywords: age at menarche, age at first birth, parity, menopausal status, hysterectomy, oophorectomy, type 2 diabetes
INTRODUCTION
Both the incidence and prevalence of type 2 diabetes (referred to subsequently as diabetes) have increased considerably in recent decades with current estimates indicating that there are over 400 million affected individuals worldwide.1 Overall similar numbers of women and men have diabetes, but age-adjusted rates tend to be greater for men than women1. Diabetes confers significant health risks, in particular for vascular diseases, where the effect of diabetes appears to be more catastrophic in women than in men.2-5
Although the ongoing epidemic of overweight and obesity has fuelled much of the observed increase in diabetes rates globally, there has been growing attention paid to a possibly aetiological role for female-specific markers of reproductive health – such as age at menarche, parity, and age at menopause – in the development of diabetes.6-10 Notable trends in the prevalence of female-specific risk factors such as an increase in the rate of gestational diabetes (itself, a major risk factor for diabetes) observed in populations,11 and a decline in the mean age of menarche12 (in part due to the increase in childhood obesity) have added to the speculation that they may play a role in the diabetes pandemic.
The question of whether age at menarche (which has been declining in high-income countries) is inversely associated with subsequent increased risk of diabetes has received much attention in recent years.13,14 But there is a lack of consistency in study findings15,16 possibly due to differences in study designs and background rates of obesity and diabetes in the populations studied. Quantification of any causal relationship is also hampered by the strong relationship that exists between excess body weight with both early menarche and diabetes.8,15,17
In this study, we report on the associations between several female reproductive markers and subsequent incidence of diabetes. We also examine if the associations are explained by excess body size in midlife.
METHODS
Ethics
Participants were recruited under the Institutional Review Board protocols approved at each of the research centres, and all study participants provided informed written consent. The details of the study ethics are described elsewhere.18,19
Study participants
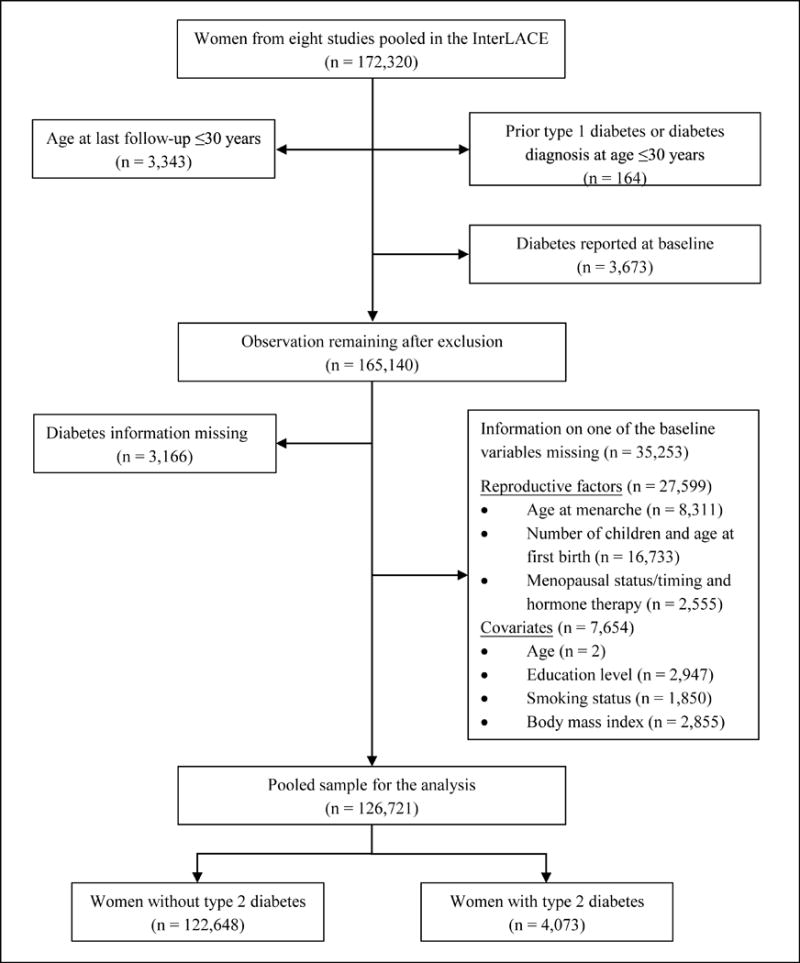
This study pooled individual data from the International Collaboration for a Life Course Approach to Reproductive Health and Chronic Disease Events (InterLACE) study. Details of the InterLACE study aims, design and data harmonisation are presented elsewhere.18,19 In summary, InterLACE consisted of pooled data from 20 observational studies (12 of which were longitudinal) from ten countries. Participating studies provided self-reported survey data on a range of reproductive, sociodemographic and lifestyle variables. For this analysis, only studies that had information on selected reproductive characteristics and incident diabetes were included (Supplementary Table 1). The numbers of women and exclusion criteria are presented in Figure 1. Women’s average age at first (or baseline) survey ranged from 45 to 60 years in most studies except for two British birth cohorts where data from surveys at ages 47 (MRC National Survey of Health and Development) and 50 years (National Child Development Study) were considered as baseline for this study.
Figure 1.
Measurement of markers of reproductive history
Reproductive factors of interest were age at menarche, age at first birth, number of children (parity), menopausal status/timing, and hormone therapy at baseline. Age at menarche was by recall in all studies except for the two British birth cohort studies20,21 and was categorised as ≤ 10, 11, 12, 13, 14, 15, 16 and ≥ 17 years. Age at first birth for parous women was categorised as < 20, 20-24, 25-29, 30-34 and ≥ 35 years. Parity was categorised as no children, one child, two, three, and ≥ four children. Menopausal status/timing at baseline was aggregated into seven categories based on menstrual bleeding patterns and history of gynaecological surgery: four categories of natural menopause (defined by amenorrhea for at least 12 months where this was not the result of an intervention; occurring before age 40, 40-44, 45-49 and ≥ 50 years), hysterectomy or oophorectomy, unknown status due to use of hormones (unless natural menopause is specified), and pre/peri-menopause (menstrual periods in the last 12 months). Use of menopausal hormone therapy (e.g., oestrogen) was categorised as never, past and current users.
Body mass index and covariates
Body mass index (BMI) (defined as weight in kilograms divided by height in meters squared) was self-reported or measured at study baseline, and was categorised as ‘underweight’ (< 18.5 kg/m2), ‘normal weight’ (18.5-24.9 kg/m2), ‘overweight’ (25-29.9 kg/m2), and ‘obese’ (≥ 30 kg/m2) according to the World Health Organisation classification.22 In the multivariable analysis, the following covariates were included: women’s year of birth (< 1940, 1940-49, 1950-59 and ≥ 1960), age at baseline (< 40, 40-49, 50-59, 60-69 and ≥ 70 years), years of education (≤ 10, 11-12 and > 12 years), and smoking status (current, past and never smoker).
Case ascertainment
Physician-diagnosed diabetes was self-reported at baseline or follow-up surveys in most studies while two studies also collected diabetes information from hospital patient registry data (the Danish Nurse Cohort Study and the Women’s Lifestyle and Health Study).23,24 Diabetes reported at or before baseline were marked as prevalent diabetes and were excluded from the analysis. For women with no information on diabetes status at baseline, information from subsequent follow-up surveys was used. Only those reporting ‘no diabetes’ for at least one post-baseline survey prior to reporting diabetes (for cases) or last follow up (non-cases) were included in the analysis to ensure exclusion of all potential prevalent cases (n = 2,124). Women who reported age of onset of diabetes below the age of 30 years (indicative of type 1 diabetes) were excluded.
Statistical analyses
Generalized linear mixed models with binomial distribution and logarithm link25 were used to analyse the binary outcome of incident diabetes, and the relative risk (RR) and 95% confidence intervals (95% CI) estimates were obtained. Study level variability was included in the model as a random effect, while other exposures and confounding factors were modelled as fixed effects and the robust variance estimation method was used. Covariates that were potential confounders of the association between reproductive factors and diabetes were only adjusted for in the multivariable model.
The relative risk of diabetes associated with each individual reproductive factor were assessed using three models: minimally adjusted for women’s year of birth, baseline age, education and smoking status (model 1); further adjusted for other reproductive factors (model 2); and baseline BMI (model 3). To investigate whether the association between reproductive factors and diabetes is modified by women’s midlife BMI, we assessed statistical interactions between reproductive factors and BMI on diabetes outcome, and also estimated the associations stratified by two broad categories of BMI (normal weight: < 25 kg/m2, and overweight or obese: ≥ 25 kg/m2).
Sensitivity analysis
To assess whether there was between-study heterogeneity in the associations and if any single study had undue influence on the overall association, we performed study-specific analyses and tested the heterogeneity in the study level estimates using random-effects meta-analysis.
Further, we carried out a sensitivity analysis that restricted the study sample to only those women with at least five years of follow-up (n = 74,885). This is to allow for sufficient time for the development of diabetes following hysterectomy/oophorectomy and to minimise effect of unmeasured confounding factors (that is some pre-existing condition that both required a woman to have a hysterectomy/oophorectomy and which is also related to increased risk of diabetes).
RESULTS
Study characteristics
A total of 126,721 women with complete history on the reproductive exposures and relevant covariates comprised the study sample for this analysis (Figure 1). Data were based on eight studies from four predominantly Caucasian populations: Australia, Denmark, Sweden and UK. The study name, country of origin and the number of observations used for each study are provided in Supplementary Table 1. Most women (72%) were born between 1940 and 1959 with only 4% born after 1960. The women’s mean age at baseline survey was 48.6 years (SD 9.7 years) and mean age at last follow-up was 56.1 years (SD 11.4 years).
A histogram showing the distribution of age at menarche in the study population is given in Supplementary Figure 1. The mean age at menarche was 13.1 years (median 13 years; range 8-20 years) with 15% of women reporting menarche at ≤ 11 years. Three-quarters of women had ≥ 2 children, and a similar proportion had their first child birth before the age of 30. Virtually half (50.2%) of the participants were pre- or peri-menopausal at baseline, 2.5% had experienced early menopause (natural menopause before the age of 45 years), and 14% reported having had a hysterectomy or oophorectomy. Age of natural menopause was unknown for about 14% of women taking menopausal hormone therapy. Details of the distribution of reproductive factors by studies are provided in Supplementary Table 2.
Over a median follow-up of 9 years, 4,073 new cases of diabetes were ascertained. The crude incidence of diabetes was 4.3 per 1000 person-years, and the age-adjusted incidence rate was 4.6 per 1000 person-years (ranged from 2.3 to 7.5 per 1000 person-years across the eight cohorts). The distribution of incident cases of diabetes according to age, sociodemographic indices, physiological and reproductive characteristics at study baseline are shown in Table 1. There were significant differences in the distribution of all of the aforementioned covariates between women with and without incident diabetes.
Table 1.
Baseline characteristics according to women with and without new onset type2 diabetes
| Variable | Categories | Incidence of diabetes
|
P value | |
|---|---|---|---|---|
| No n (%) |
Yes n (%) |
|||
| 122648 (96.8) | 4073 (3.2) | |||
| Women’s year of birth | <1940 | 29216 (23.8) | 1289 (31.6) | <0.0001 |
| 1940-49 | 44962 (36.7) | 1810 (44.4) | ||
| 1950-59 | 43697 (35.6) | 914 (22.4) | ||
| ≥1960 | 4773 (3.9) | 60 (1.5) | ||
| Age (years) | <40 | 21999 (17.9) | 328 (8.1) | <0.0001 |
| 40-49 | 54803 (44.7) | 2018 (49.5) | ||
| 50-59 | 28142 (22.9) | 933 (22.9) | ||
| 60-69 | 15192 (12.4) | 667 (16.4) | ||
| ≥70 | 2512 (2.0) | 127 (3.1) | ||
| Mean (SD) | 48.5 (9.7) | 51.0 (9.1) | ||
| Median (Q1, Q3) | 47.3 (42.0, 54.0) | 49.0 (46.0, 57.0) | ||
| Education level (years) | ≤10 | 41825 (34.1) | 1903 (46.7) | <0.0001 |
| 11-12 | 18180 (14.8) | 498 (12.2) | ||
| >12 | 62643 (51.1) | 1672 (41.1) | ||
| Body mass index (kg/m2) | Underweight (<18.5) | 2308 (1.9) | 17 (0.4) | <0.0001 |
| Normal (18.5-24.9) | 77218 (63.0) | 983 (24.1) | ||
| Overweight (25-29.9) | 31210 (25.4) | 1495 (36.7) | ||
| Obese (≥30) | 11912 (9.7) | 1578 (38.7) | ||
| Mean (SD) | 24.4 (4.2) | 29.2 (5.7) | ||
| Median (Q1, Q3)) | 23.5 (21.5, 26.3) | 28.5 (25.0, 32.5) | ||
| Smoking status | Never smoker | 60389 (49.2) | 1961 (48.1) | <0.0001 |
| Past smoker | 38382 (31.3) | 1157 (28.4) | ||
| Current smoker | 23877 (19.5) | 955 (23.4) | ||
| Age at menarche (years) | ≤10 | 3772 (3.1) | 195 (4.8) | <0.0001 |
| 11 | 14271 (11.6) | 620 (15.2) | ||
| 12 | 25407 (20.7) | 835 (20.5) | ||
| 13 | 34375 (28.0) | 1088 (26.7) | ||
| 14 | 25349 (20.7) | 741 (18.2) | ||
| 15 | 12243 (10.0) | 357 (8.8) | ||
| 16 | 5098 (4.2) | 151 (3.7) | ||
| ≥17 | 2133 (1.7) | 86 (2.1) | ||
| Mean (SD) | 13.1 (1.5) | 12.9 (1.6) | ||
| Median (Q1, Q3)) | 13.0 (12.0, 14.0) | 13.0 (12.0, 14.0) | ||
| Number of children | 0 | 15958 (13.0) | 537 (13.2) | <0.0001 |
| 1 | 13754 (11.2) | 406 (10.0) | ||
| 2 | 50090 (40.8) | 1434 (35.2) | ||
| 3 | 29303 (23.9) | 1036 (25.4) | ||
| ≥4 | 13543 (11.0) | 660 (16.2) | ||
| Age at first birth (years) | No children | 15958 (13.0) | 537 (13.2) | |
| <20 | 7130 (5.8) | 366 (9.0) | <0.0001 | |
| 20-24 | 39187 (32.0) | 1435 (35.2) | ||
| 25-29 | 40260 (32.8) | 1146 (28.1) | ||
| 30-34 | 15038 (12.3) | 444 (10.9) | ||
| ≥35 | 5075 (4.1) | 145 (3.6) | ||
| Mean (SD) | 25.7 (4.6) | 24.9 (4.7) | ||
| Median (Q1, Q3) | 25.0 (23.0, 28.0) | 24.0 (22.0, 28.0) | ||
| Menopausal status and | Hysterectomy/oophorectomy | 17045 (13.9) | 870 (21.4) | <0.0001 |
| menopause timing (years) | Natural menopause <40 | 641 (0.5) | 34 (0.8) | |
| Natural menopause 40-44 | 2331 (1.9) | 108 (2.7) | ||
| Natural menopause 45-49 | 7255 (5.9) | 286 (7.0) | ||
| Natural menopause ≥50 | 16140 (13.2) | 625 (15.3) | ||
| Unknown due to hormone use | 17302 (14.1) | 481 (11.8) | ||
| Pre-/peri-menopause | 61934 (50.5) | 1669 (41.0) | ||
| Mean age at menopause (SD)* | 49.9 (4.2) | 50.2 (4.5) | ||
| Median age at menopause (Q1, Q3)* | 50.0 (48.0, 53.0) | 50.0 (48.0, 53.0) | ||
| Hormone therapy | Never | 97308 (79.3) | 3051 (74.9) | <0.0001 |
| Past | 8369 (6.8) | 369 (9.1) | ||
| Current | 16971 (13.8) | 653 (16.0) | ||
Abbreviation: SD, standard deviation; Q1 – 25 percentile; Q3 – 75 percentile.
Data were presented as number (%), mean (SD), or median (Q1, Q3).
Mean and median age at menopause were only presented among women who had reached menopause at baseline (n = 27,420).
Age at menarche and incident diabetes
The association between age at menarche and incident diabetes was non-linear: there was evidence to suggest that only menarche at ≤ 11 years was associated with increased risk of diabetes compared to those women who were 13 years at onset of menarche (Table 2). Compared with women who were 13 years at onset of menarche, those who were ≤ 10 years had 68% increased risk of developing diabetes in later life (RR 1.68, 95% CI: 1.45–1.96) after adjusting for demographic and socio-economic factors. The strength of this association remained largely unaffected by adjustment for other reproductive markers while adjustment for BMI strongly attenuated the estimate (RR 1.18, 95% CI: 1.02–1.37; Model 3, Table 2).
Table 2.
Adjusted relative risks of new onset type 2 diabetes associated with reproductive factors
| Reproductive factors | Categories | n | Diabetes case (%) | Model 1: Minimally adjusted | Model 2: plus reproductive factors | Model 3: plus BMI |
|---|---|---|---|---|---|---|
|
| ||||||
| RR (95%CI) | RR (95%CI) | RR (95%CI) | ||||
| Age at menarche (years) | ≤10 | 3,967 | 4.9 | 1.68 (1.45,1.96) | 1.63 (1.40,1.89) | 1.18 (1.02,1.37) |
| 11 | 14,891 | 4.2 | 1.42 (1.28,1.56) | 1.39 (1.26,1.54) | 1.13 (1.03,1.24) | |
| 12 | 26,242 | 3.2 | 1.07 (0.97,1.17) | 1.06 (0.97,1.16) | 0.97 (0.89,1.06) | |
| 13 | 35,463 | 3.1 | Reference | Reference | Reference | |
| 14 | 26,090 | 2.8 | 0.87 (0.80,0.96) | 0.88 (0.80,0.96) | 0.94 (0.86,1.03) | |
| 15 | 12,600 | 2.8 | 0.81 (0.72,0.92) | 0.82 (0.72,0.92) | 0.94 (0.84,1.06) | |
| 16 | 5,249 | 2.9 | 0.78 (0.66,0.93) | 0.79 (0.67,0.94) | 0.89 (0.75,1.05) | |
| ≥17 | 2,219 | 3.9 | 1.00 (0.81,1.25) | 1.01 (0.81,1.26) | 1.09 (0.88,1.35) | |
| Number of children | 0 | 16,495 | 3.3 | 1.20 (1.08,1.33) | 1.26 (1.13,1.41) | 1.18 (1.06,1.31) |
| 1 | 14,160 | 2.9 | 1.08 (0.96,1.20) | 1.06 (0.95,1.19) | 1.05 (0.94,1.18) | |
| 2 | 51,524 | 2.8 | Reference | Reference | Reference | |
| 3 | 30,339 | 3.4 | 1.09 (1.01,1.18) | 1.08 (1.00,1.18) | 1.04 (0.96,1.12) | |
| ≥4 | 14,203 | 4.6 | 1.30 (1.19,1.43) | 1.27 (1.15,1.40) | 1.13 (1.03,1.24) | |
| Age at first birth (years) | <20 | 7,496 | 4.9 | 1.36 (1.21,1.54) | 1.21 (1.06,1.37) | 1.09 (0.97,1.24) |
| 20-24 | 40,622 | 3.5 | 1.14 (1.05,1.23) | 1.08 (1.00,1.17) | 1.04 (0.96,1.13) | |
| 25-29 | 41,406 | 2.8 | Reference | Reference | Reference | |
| 30-34 | 15,482 | 2.9 | 1.10 (0.98,1.22) | 1.11 (0.99,1.24) | 1.08 (0.97,1.20) | |
| ≥35 | 5,220 | 2.8 | 1.10 (0.92,1.31) | 1.12 (0.94,1.34) | 1.07 (0.90,1.28) | |
| Menopausal status and | Hysterectomy/oophorectomy | 17,915 | 4.9 | 1.35 (1.23,1.48) | 1.31 (1.19,1.44) | 1.17 (1.07,1.29) |
| menopause timing (years) | Natural menopause <40 | 675 | 5.0 | 1.40 (0.99,1.97) | 1.33 (0.94,1.87) | 1.27 (0.91,1.76) |
| Natural menopause 40-44 | 2,439 | 4.4 | 1.13 (0.92,1.39) | 1.11 (0.90,1.36) | 1.08 (0.88,1.32) | |
| Natural menopause 45-49 | 7,541 | 3.8 | 1.03 (0.89,1.19) | 1.02 (0.88,1.18) | 0.96 (0.83,1.11) | |
| Natural menopause ≥50 | 16,765 | 3.7 | 1.05 (0.92,1.18) | 1.04 (0.91,1.17) | 0.96 (0.85,1.09) | |
| Unknown due to hormone use | 17,783 | 2.7 | 0.94 (0.85,1.05) | 0.96 (0.85,1.09) | 1.00 (0.89,1.13) | |
| Pre-/peri-menopause | 63,603 | 2.6 | Reference | Reference | Reference | |
| Hormone therapy | Never | 100,359 | 3.0 | Reference | Reference | Reference |
| Past | 8,738 | 4.2 | 1.07 (0.95,1.21) | 1.01 (0.90,1.14) | 1.01 (0.90,1.13) | |
| Current | 17,624 | 3.7 | 1.02 (0.93,1.12) | 0.96 (0.86,1.08) | 1.04 (0.92,1.16) | |
Abbreviation: BMI, body mass index.
Data were presented as relative risk (RR) and 95% confidence intervals (95% CI).
Model 1 was adjusted for women’s year of birth, age at baseline, education and smoking status at baseline.
Model 2 was adjusted for covariates in model 1 plus age at menarche, number of children, age at first birth, menopausal status/timing and hormone therapy at baseline
Model 3 was adjusted for covariates in model 2 plus baseline body mass index (BMI) (under/normal weight, overweight, and obese).
Test for interaction indicated potential effect modification by BMI (p for interaction = 0.06): there was no association among women with BMI < 25 kg/m2 but a non-linear relation in women with BMI ≥ 25 kg/m2. In women with BMI ≥ 25 kg/m2, those who were aged ≤ 10 years at menarche were at 33% increased risk of diabetes (RR 1.33, 95% CI: 1.13–1.55) compared with women who were 13 years of age at menarche (Table 3).
Table 3.
Adjusted relative risks of new onset type 2 diabetes associated with reproductive factors stratified by baseline body mass index
| Variable | Categories | BMI < 25 kg/m2 (n = 80,526) |
BMI ≥ 25 kg/m2 (n = 46,195) |
||||
|---|---|---|---|---|---|---|---|
|
| |||||||
| n | Diabetes case (%) | Fully adjusted* RR (95% CI) |
n | Diabetes case (%) | Fully adjusted* RR (95% CI) |
||
| Age at menarche (years) | ≤10 | 1731 | 1.1 | 1.08 (0.67,1.73) | 2236 | 7.9 | 1.33 (1.13,1.55) |
| 11 | 7798 | 1.2 | 1.17 (0.92,1.49) | 7093 | 7.4 | 1.19 (1.07,1.32) | |
| 12 | 15979 | 1.1 | 1.02 (0.84,1.24) | 10263 | 6.4 | 0.98 (0.88,1.08) | |
| 13 | 23145 | 1.1 | Reference | 12318 | 6.7 | Reference | |
| 14 | 17835 | 1.4 | 1.13 (0.95,1.35) | 8255 | 6.0 | 0.86 (0.77,0.96) | |
| 15 | 8901 | 1.4 | 1.06 (0.85,1.31) | 3699 | 6.3 | 0.85 (0.74,0.98) | |
| 16 | 3604 | 1.5 | 1.05 (0.78,1.41) | 1645 | 5.9 | 0.80 (0.65,0.99) | |
| ≥17 | 1533 | 1.8 | 1.15 (0.78,1.71) | 686 | 8.5 | 1.09 (0.84,1.41) | |
| Menopausal status and | Hysterectomy/oophorectomy | 9498 | 2.1 | 1.55 (1.27,1.91) | 8417 | 8.0 | 1.15 (1.03,1.28) |
| menopause timing (years) | Natural menopause <40 | 341 | 1.8 | 1.64 (0.71,3.77) | 334 | 8.4 | 1.23 (0.85,1.78) |
| Natural menopause 40-44 | 1256 | 1.9 | 1.31 (0.84,2.04) | 1183 | 7.1 | 1.02 (0.81,1.29) | |
| Natural menopause 45-49 | 4137 | 1.6 | 1.15 (0.85,1.56) | 3404 | 6.5 | 0.95 (0.81,1.12) | |
| Natural menopause ≥50 | 9060 | 1.6 | 1.17 (0.90,1.51) | 7705 | 6.3 | 0.94 (0.82,1.08) | |
| Unknown due to hormone use | 12421 | 1.2 | 1.03 (0.81,1.31) | 5362 | 6.2 | 0.98 (0.85,1.13) | |
| Pre-/peri-menopause | 43813 | 0.9 | Reference | 19790 | 6.3 | Reference | |
Abbreviation: BMI, body mass index.
RRs (95% CI) were fully adjusted for women’s year of birth, age, education level, smoking status, age at menarche, number of children, age at first birth, menopausal status/timing and hormone therapy at baseline.
Age at first birth, parity and incident diabetes
There was a non-linear relationship between age at first birth with incident diabetes in the minimally-adjusted model (Table 2) that was ameliorated following adjustment for reproductive factors (Model 2) and midlife BMI (Model 3). The association between parity and incident diabetes was U-shaped and remained after adjustment for other reproductive factors and midlife BMI. Compared with women with two children, nulliparous women were at 18% increased risk of diabetes (RR 1.18, 95% CI: 1.06–1.31), and women who had ≥ 4 children were at 13% greater risk (RR 1.13, 95% CI: 1.03–1.24) (Model 3, Table 2).
Menopausal status baseline, use of hormone replacement therapy and incident diabetes
Compared with women who were pre/perimenopausal, there was an indication that women who reached menopause before the age of 40 had an elevated but not statistically significant risk of incident diabetes (RR 1.27, 95% CI: 0.91–1.76). (Table 2). Women who reported having had a hysterectomy/oophorectomy at baseline had a 17% increased risk of diabetes (RR 1.17, 95% CI: 1.07–1.29) compared with pre/perimenopausal women after adjustment for other reproductive factors and midlife BMI. Findings from the sensitivity analysis, that restricted the study sample to only those women with at least five years of follow-up, were similar to the main results (Supplementary Table 3).
Test for interaction indicated significant effect modification of the association between menopausal status and diabetes by BMI (p for interaction = 0.001). In BMI stratified analyses, the increased risk of diabetes associated with hysterectomy/oophorectomy remained but was stronger among women with BMI < 25 kg/m2 than those with BMI ≥ 25 kg/m2: RR 1.55, 95% CI: 1.27–1.91 vs RR 1.15, 95% CI: 1.03–1.28 respectively; Table 3).
There was no evidence of an association between hormone therapy use (past or current user versus never) and incident diabetes (Table 2).
Study-specific results
The random-effects meta-analysis showed the study specific estimates to be broadly consistent for the following significant associations between markers of reproductive history and incident diabetes: age at menarche ≤ 11 years vs 13 years (I2 = 18.6%, p = 0.28); having ≥ 4 vs 2 children (I2 = 0.9%, p = 0.42); and hysterectomy/oophorectomy vs. pre/perimenopause (I2 = 0.0%, p = 0.58) (Supplementary Figure 2). There was some evidence of between-study heterogeneity for the association between nulliparity and risk of diabetes that was contingent on the findings from two studies (I2 = 70.5%, p = 0.001). Following exclusion of these studies attenuated the magnitude of the between-study heterogeneity (I2 = 54.2%, p = 0.05). The study specific estimates were consistent but attenuated, after adjusting for midlife BMI (Supplementary Figure 3).
DISCUSSION
Findings from this collaboration of population-based cohort studies of women’s health add to the accruing evidence that characteristics of a woman’s reproductive history may be associated with incident diabetes in later life. Consistent with previous studies13,14,26,27 early menarche (≤ 11 years) was associated with a small increase in risk of diabetes compared to women who reported experiencing menarche at 13 years. However, our findings indicate that the effect is only apparent among women with a midlife BMI in the overweight or obese range. There are several ways to interpret this finding; it may indicate that remaining relatively lean throughout life effectively mitigates any excess risk conferred by early age at menarche. Alternatively, it may reflect a cumulative exposure to excess body weight beginning in early life: i.e. overweight women in adult life were also overweight as children resulting in both early age at menarche and increased risk of diabetes in adult life.
Most studies that have examined the relationship between age at menarche and risk of subsequent diabetes, in the absence of a measure of childhood weight, have used adult BMI as a proxy measure arguing that overweight and obesity tend to track throughout life (i.e., children who are overweight are significantly more likely to remain overweight throughout adulthood).8,26 This may be the case for contemporary birth cohorts but the studies included in the current collaboration included women who were born decades before the obesity epidemic in children. Hence, one would expect relatively few women to have been overweight or obese as children. The two largest studies to date, which have reported on the association between age at menarche and incident diabetes have shown conflicting results. In the EPIC-Interact study,14 the inverse association between age at menarche and the risk of diabetes persisted after adjustment for body mass index. In contrast, in the Women’s Health Initiative27 – a large study of hormone replacement therapy in postmenopausal women - the inverse association between age at menarche and risk of diabetes was attenuated once adjustment was made for BMI in adult life (as we also found). This discrepancy between these two large studies may be a birth cohort effect or due to the use of different categories for menarche age, and it would be of interest to know whether stratification by BMI in these studies would yield findings comparable to ours.
In InterLACE, parity was nonlinearly associated with risk of diabetes such than compared to women with two children, both nulliparous women, and women with four or more children, were at increased risk of diabetes. The relationship – which was broadly consistent across the included studies - was independent of other reproductive risk factors and midlife BMI. These findings are consistent with other population based cohort studies where nulliparity or having four or more children were independently associated with greater risk of diabetes in later life.28,29 Our findings contrast slightly with those of a recent meta-analysis of published results from seven studies. In that overview, although the association between parity and incident diabetes was non-linear, the authors aggregated the heterogeneous study estimates and presented a dose-response relationship such that for every live birth increase in parity the risk of diabetes increased by 6%.30 Although beyond the scope of these data, possible mechanistic explanations for this association include cumulative exposure to repeat periods of increased insulin resistance and pancreatic beta cell proliferation during pregnancy and subsequent beta cell dysfunction.30
Women who had had either a hysterectomy or oophorectomy had a modest increased risk of diabetes that was robust to adjustment for potential confounders. These findings are consistent with those from both animal and epidemiological studies which indicate that oophorectomy and surgical menopause is associated with increased insulin resistance, metabolic disturbances and incident diabetes.31 In particular, two large prospective studies have shown an increased risk of incident diabetes following hysterectomy and/or oophorectomy in postmenopausal women.32,33 There was some evidence from our data that premature menopause (menopause by the age of 40 years) is related to risk of incident diabetes. The non-significant result may be due to lack of statistical power. Previous studies have suggested that premature and early natural menopause are associated with subsequent risk of diabetes.34 Most recently, data from the Rotterdam Study showed a three-fold increased risk of diabetes for women who experienced premature menopause compared with those who experienced menopause after the age of 55 years – although the number of incident cases of diabetes in both groups (n = 29) was much smaller than in the current study. Previous authors have speculated on possible genetic mechanisms linking early age at menopause (possibly a proxy for premature ageing and DNA damage) with risk of incident diabetes and other chronic, age-related conditions.34 It remains to be determined by future studies whether early age at menopause predicts future health outcomes.
The strength of our study is the large pool of individual-level data that span several geographic regions. InterLACE harmonised variables using common definitions and provided sufficient heterogeneity and statistical power to examine the sub groups. There are several limitations to the current study that warrant brief discussion. Only the two birth cohorts20,21 had a measure of childhood weight status, which meant that we were unable to adjust for its potential confounding effect in the analysis. However, given that approximately 95% of the participants were born before 1960 (several decades before the childhood obesity epidemic commenced), we consider it unlikely that a significant proportion of these women was overweight in childhood and therefore the potential confounding effect to be minimal. The National Survey of Health and Development study that did have data on childhood weight supports this hypothesis; at age 11 years, less than 2% of the women were overweight or obese and this increased to 7% at age 15 years (data not shown). Age at menarche was predominantly based on recall; the error that this would have introduced is likely to have been non-differentially distributed across the cohorts and would have biased any associations towards the null. Diagnosis of diabetes was also largely by self-report which raises the possibility of misclassification of outcome; however, previous longitudinal cohort studies have indicated that self-reported diabetes is more than 90% reliable of diabetes status over time35. Moreover, any misclassification of diabetes status is likely to be non-differentially distributed across the categories of age at menarche. Approximately 21% of observations were dropped in our complete case analysis due to missing data on covariates. When the missing data were imputed using multiple imputation and analysed (data not shown), we did not find overall difference in our estimates except for early age at menarche and early menopause which slightly improved suggesting slight underestimation of these factors.
In summary, early age of menarche may be a risk factor for incident diabetes but it remains to be determined whether the effect is purely driven by early overweight and obesity tracking into adult life. Parity and a history of hysterectomy or oophorectomy appear to be related to incident diabetes – although the effect sizes were modest and thus, the associations could still be due to residual confounding. In contrast, there was no clear evidence that use of hormone replacement therapy, age at natural menopause and age at which a woman has her first child are independently associated with risk of diabetes. Whether the relationships that we, and others, have observed between markers of reproductive health and incident diabetes are truly causal, and predictive of diabetes in later life, remain to be determined and subject to investigation by future studies.
Supplementary Material
Acknowledgments
The data on which this research is based were drawn from eight observational studies. The research included data from the ALSWH, the University of Newcastle, Australia, and the University of Queensland, Australia. We are grateful to the Australian Government Department of Health for funding and to the women who provided the survey data. MCCS was supported by VicHealth and the Cancer Council, Victoria, Australia. DNCS was supported by the National Institute of Public Health, Copenhagen, Denmark. WLHS was funded by a grant from the Swedish Research Council (Grant number 521-2011-2955). NSHD and NCDS have core funding from the UK Medical Research Council (MC UU 12019/1) and UK Economic and Social Research Council respectively. ELSA is funded by the National Institute on Aging (Grants 2RO1AG7644 and 2RO1AG017644-01A1) and a consortium of UK government departments. UKWCS was originally funded by the World Cancer Research Fund. All study teams would like to thank the participants for volunteering their time to be involved in the respective studies. The findings and views in this paper are not those from the original studies or their respective funding agencies.
The authors thank the members of the InterLACE Consortium writing group: Kunihiko Hayashi, Jung Su Lee, Hideki Mizunuma, Sybil L. Crawford, Nancy E. Avis, Ellen B. Gold, Ellen S. Mitchell, Nancy F. Woods, Debra Anderson, Daniel E. Brown, Lynnette L. Sievert, Eric J. Brunner, Alissa Goodman, Rachel Cooper, Mark Hamer, Victoria J. Burley, Therese Tillin, Carla Makhlouf Obermeyer, Sven Sandin, Kathryn A. Lee, and Toyoko Yoshizawa.
FUNDING
InterLACE project is funded by the Australian National Health and Medical Research Council project grant (APP1027196). GDM is supported by the Australian National Health and Medical Research Council Principal Research Fellowship (APP1121844).
Footnotes
AUTHOR CONTRIBUTIONS
NP performed the statistical analysis and wrote the manuscript. RH contributed to the introduction and discussion and reviewed/edited the manuscript. HFC performed the statistical analysis and reviewed/edited the manuscript. AJD, DK, RRH, JEC, DCG, GGG, FB, PD, MKS, HOA and EW contributed research data and provided critical revision of the manuscript for important intellectual content. GM conceptualised the study and reviewed/edited the manuscript.
CONFLICT OF INTERESTS
The authors have no relevant conflict of interest to disclose.
References
- 1.Ogurtsova K, da Rocha Fernandes JD, Huang Y, et al. IDF Diabetes Atlas: Global estimates for the prevalence of diabetes for 2015 and 2040. Diabetes Res Clin Pract. 2017;128:40–50. doi: 10.1016/j.diabres.2017.03.024. [DOI] [PubMed] [Google Scholar]
- 2.Australian Institute of Health and Welfare. Diabetes and chronic kidney disease as risks for other diseases. Australian Burden of Disease Study 2011. Canberra: AIHW; 2016. (Australian Burden of Disease Study series no 8 Cat no BOD 9). [Google Scholar]
- 3.Woodward M, Barzi F, Huxley R. Women have a greater excess relative risk for coronary death associated with diabetes than men. Circulation. 2005;111(4):E78–E79. [Google Scholar]
- 4.Huxley RR, Peters SA, Mishra GD, Woodward M. Risk of all-cause mortality and vascular events in women versus men with type 1 diabetes: a systematic review and meta-analysis. Lancet Diabetes Endocrinol. 2015;3(3):198–206. doi: 10.1016/S2213-8587(14)70248-7. [DOI] [PubMed] [Google Scholar]
- 5.Peters SA, Huxley RR, Woodward M. Diabetes as risk factor for incident coronary heart disease in women compared with men: a systematic review and meta-analysis of 64 cohorts including 858,507 individuals and 28,203 coronary events. Diabetologia. 2014;57(8):1542–1551. doi: 10.1007/s00125-014-3260-6. [DOI] [PubMed] [Google Scholar]
- 6.Kritz-Silverstein D, Barrett-Connor E, Wingard DL. The effect of parity on the later development of non-insulin-dependent diabetes mellitus or impaired glucose tolerance. N Engl J Med. 1989;321(18):1214–1219. doi: 10.1056/NEJM198911023211802. [DOI] [PubMed] [Google Scholar]
- 7.Manson JE, Rimm EB, Colditz GA, et al. Parity and incidence of non-insulin-dependent diabetes mellitus. Am J Med. 1992;93(1):13–18. doi: 10.1016/0002-9343(92)90674-z. [DOI] [PubMed] [Google Scholar]
- 8.Lakshman R, Forouhi N, Luben R, et al. Association between age at menarche and risk of diabetes in adults: results from the EPIC-Norfolk cohort study. Diabetologia. 2008;51(5):781–786. doi: 10.1007/s00125-008-0948-5. [DOI] [PubMed] [Google Scholar]
- 9.Brand JS, van der Schouw YT, Onland-Moret NC, et al. Age at menopause, reproductive life span, and type 2 diabetes risk: results from the EPIC-InterAct study. Diabetes Care. 2013;36(4):1012–1019. doi: 10.2337/dc12-1020. [DOI] [PMC free article] [PubMed] [Google Scholar]
- 10.Chen L, Zhang C, Yeung E, et al. Age at menarche and metabolic markers for type 2 diabetes in premenopausal women: the BioCycle Study. The Journal of clinical endocrinology and metabolism. 2011;96(6):E1007–1012. doi: 10.1210/jc.2010-2526. [DOI] [PMC free article] [PubMed] [Google Scholar]
- 11.Anna V, van der Ploeg HP, Cheung NW, Huxley RR, Bauman AE. Sociodemographic correlates of the increasing trend in prevalence of gestational diabetes mellitus in a large population of women between 1995 and 2005. Diabetes Care. 2008;31(12):2288–2293. doi: 10.2337/dc08-1038. [DOI] [PMC free article] [PubMed] [Google Scholar]
- 12.Forman MR, Mangini LD, Thelus-Jean R, Hayward MD. Life-course origins of the ages at menarche and menopause. Adolesc Health Med Ther. 2013;4:1–21. doi: 10.2147/AHMT.S15946. [DOI] [PMC free article] [PubMed] [Google Scholar]
- 13.Janghorbani M, Mansourian M, Hosseini E. Systematic review and meta-analysis of age at menarche and risk of type 2 diabetes. Acta diabetologica. 2014;51(4):519–528. doi: 10.1007/s00592-014-0579-x. [DOI] [PubMed] [Google Scholar]
- 14.Elks CE, Ong KK, Scott RA, et al. Age at menarche and type 2 diabetes risk: the EPIC-InterAct study. Diabetes Care. 2013;36(11):3526–3534. doi: 10.2337/dc13-0446. [DOI] [PMC free article] [PubMed] [Google Scholar]
- 15.Pierce MB, Kuh D, Hardy R. The role of BMI across the life course in the relationship between age at menarche and diabetes, in a British Birth Cohort. Diabetic medicine: a journal of the British Diabetic Association. 2012;29(5):600–603. doi: 10.1111/j.1464-5491.2011.03489.x. [DOI] [PMC free article] [PubMed] [Google Scholar]
- 16.Qiu C, Chen H, Wen J, et al. Associations between age at menarche and menopause with cardiovascular disease, diabetes, and osteoporosis in Chinese women. The Journal of clinical endocrinology and metabolism. 2013;98(4):1612–1621. doi: 10.1210/jc.2012-2919. [DOI] [PubMed] [Google Scholar]
- 17.Mumby HS, Elks CE, Li S, et al. Mendelian Randomisation Study of Childhood BMI and Early Menarche. J Obes. 2011;2011:180729. doi: 10.1155/2011/180729. [DOI] [PMC free article] [PubMed] [Google Scholar]
- 18.Mishra GD, Chung HF, Pandeya N, et al. The InterLACE study: Design, data harmonization and characteristics across 20 studies on women’s health. Maturitas. 2016;92:176–185. doi: 10.1016/j.maturitas.2016.07.021. [DOI] [PMC free article] [PubMed] [Google Scholar]
- 19.Mishra GD, Anderson D, Schoenaker DA, et al. InterLACE: A New International Collaboration for a Life Course Approach to Women’s Reproductive Health and Chronic Disease Events. Maturitas. 2013;74(3):235–240. doi: 10.1016/j.maturitas.2012.12.011. [DOI] [PubMed] [Google Scholar]
- 20.Wadsworth M, Kuh D, Richards M, Hardy R. Cohort Profile: The 1946 National Birth Cohort (MRC National Survey of Health and Development) Int J Epidemiol. 2006;35(1):49–54. doi: 10.1093/ije/dyi201. [DOI] [PubMed] [Google Scholar]
- 21.Power C, Elliott J. Cohort profile: 1958 British birth cohort (National Child Development Study) Int J Epidemiol. 2006;35(1):34–41. doi: 10.1093/ije/dyi183. [DOI] [PubMed] [Google Scholar]
- 22.Obesity: preventing and managing the global epidemic. Report of a WHO consultation. World Health Organ Tech Rep Ser. 2000;894:i–xii. 1–253. [PubMed] [Google Scholar]
- 23.Hundrup YA, Simonsen MK, Jorgensen T, Obel EB. Cohort profile: the Danish nurse cohort. Int J Epidemiol. 2012;41(5):1241–1247. doi: 10.1093/ije/dyr042. [DOI] [PubMed] [Google Scholar]
- 24.Roswall N, Sandin S, Adami HO, Weiderpass E. Cohort Profile: The Swedish Women’s Lifestyle and Health cohort. Int J Epidemiol. 2017;46(2):e8. doi: 10.1093/ije/dyv089. [DOI] [PubMed] [Google Scholar]
- 25.McNutt LA, Wu C, Xue X, Hafner JP. Estimating the relative risk in cohort studies and clinical trials of common outcomes. Am J Epidemiol. 2003;157(10):940–943. doi: 10.1093/aje/kwg074. [DOI] [PubMed] [Google Scholar]
- 26.Yang L, Li L, Peters SAE, et al. Age at menarche and incidence of diabetes: a prospective study of 300,000 women in China. Am J Epidemiol. 2017 doi: 10.1093/aje/kwx219. [DOI] [PMC free article] [PubMed] [Google Scholar]
- 27.LeBlanc ES, Kapphahn K, Hedlin H, et al. Reproductive history and risk of type 2 diabetes mellitus in postmenopausal women: findings from the Women’s Health Initiative. Menopause. 2017;24(1):64–72. doi: 10.1097/GME.0000000000000714. [DOI] [PMC free article] [PubMed] [Google Scholar]
- 28.Nicholson WK, Asao K, Brancati F, Coresh J, Pankow JS, Powe NR. Parity and risk of type 2 diabetes: the Atherosclerosis Risk in Communities Study. Diabetes Care. 2006;29(11):2349–2354. doi: 10.2337/dc06-0825. [DOI] [PubMed] [Google Scholar]
- 29.Tian Y, Shen L, Wu J, et al. Parity and the risk of diabetes mellitus among Chinese women: a cross-sectional evidence from the Tongji-Dongfeng cohort study. PLoS One. 2014;9(8):e104810. doi: 10.1371/journal.pone.0104810. [DOI] [PMC free article] [PubMed] [Google Scholar]
- 30.Guo P, Zhou Q, Ren L, Chen Y, Hui Y. Higher parity is associated with increased risk of Type 2 diabetes mellitus in women: A linear dose-response meta-analysis of cohort studies. J Diabetes Complications. 2017;31(1):58–66. doi: 10.1016/j.jdiacomp.2016.10.005. [DOI] [PubMed] [Google Scholar]
- 31.Stubbins RE, Holcomb VB, Hong J, Nunez NP. Estrogen modulates abdominal adiposity and protects female mice from obesity and impaired glucose tolerance. Eur J Nutr. 2012;51(7):861–870. doi: 10.1007/s00394-011-0266-4. [DOI] [PubMed] [Google Scholar]
- 32.Appiah D, Winters SJ, Hornung CA. Bilateral oophorectomy and the risk of incident diabetes in postmenopausal women. Diabetes Care. 2014;37(3):725–733. doi: 10.2337/dc13-1986. [DOI] [PubMed] [Google Scholar]
- 33.Luo JH, Manson JE, Urrutia RP, Hendryx M, LeBlanc ES, Margolis KL. Risk of Diabetes After Hysterectomy With or Without Oophorectomy in Postmenopausal Women. Am J Epidemiol. 2017;185(9):777–785. doi: 10.1093/aje/kwx023. [DOI] [PMC free article] [PubMed] [Google Scholar]
- 34.Muka T, Asllanaj E, Avazverdi N, et al. Age at natural menopause and risk of type 2 diabetes: a prospective cohort study. Diabetologia. 2017 doi: 10.1007/s00125-017-4346-8. [DOI] [PMC free article] [PubMed] [Google Scholar]
- 35.Schneider AL, Pankow JS, Heiss G, Selvin E. Validity and reliability of self-reported diabetes in the Atherosclerosis Risk in Communities Study. Am J Epidemiol. 2012;176(8):738–743. doi: 10.1093/aje/kws156. [DOI] [PMC free article] [PubMed] [Google Scholar]
Associated Data
This section collects any data citations, data availability statements, or supplementary materials included in this article.