Abstract
Background
Obese subjects have lower natriuretic peptide levels, but males and females have different anthropometric characteristics and fat distribution. Whether obesity-associated lowering of natriuretic peptides differs among males and females is unknown. Therefore, we investigated sex-specific associations of obesity and N-terminal pro-B-type natriuretic peptide (NT-proBNP) levels among adults in the general population.
Methods and Results
Using 8260 participants (50.1% females) from the Prevention of Renal and Vascular End-stage Disease (PREVEND) cohort, we evaluated the relationship of NT-proBNP levels with obesity-associated parameters i.e. waist circumference (WC), body-mass index (BMI) and body weight in the overall population, and in males and females separately.
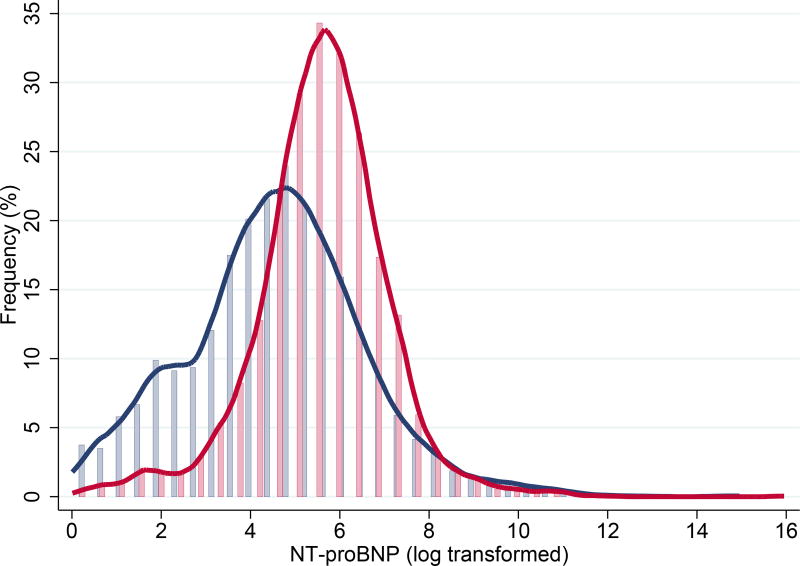
NT-proBNP levels were higher in females (50.5, 28.2–87.0 ng/L; median, interquartile-range) than in males (24.3, 10.1–54.6 ng/L; P<0.001). In the overall population, NT-proBNP levels were significantly lower in heavier individuals and displayed a “U-shaped” relationship with increasing WC, but were not associated with BMI. After sex-stratification, there was no significant association between NT-proBNP concentrations and anthropometric measures in females. However, in males increasing WC and BMI were associated with higher NT-proBNP levels (P<0.05) while increasing body weight was associated with slightly lower NT-proBNP levels (P<0.05). Age strongly confounded the association of NT-proBNP levels with obesity, and age-associated increases in NT-proBNP were significantly higher in males than in females (P<0.001).
In multivariable-adjusted analyses, the inverse association of obesity and NT-proBNP levels was also significantly modified by sex: NT-proBNP levels were lower with increasing WC, BMI and body weight among females compared with males (Pinteraction<0.05). After also accounting for BMI, abdominal obesity was associated with lower NT-proBNP levels in females, but not in males (Pinteraction<0.001).
Conclusions
Natriuretic peptide deficiency in obesity mostly pertains to females with abdominal obesity, whereas the relationship between obesity and natriuretic peptides appears to be more complex in males.
Keywords: NT-proBNP, females, males, obesity, sex, age
1. INTRODUCTION
N-terminal pro-B-type natriuretic peptide (NT-proBNP) is a widely used biomarker in diagnosing heart failure (HF), particularly in patients presenting with dyspnoea and other complaints.1–3 NT-proBNP is also used in risk stratification of several cardiovascular (CV) disorders.4,5 It is considered to be more stable than BNP because of its relatively long half-life;6 however, various factors influence NT-proBNP levels. Consistently elevated NT-proBNP levels are observed in older individuals,7,8 and also in patients with CV disorders and renal dysfunction; indeed, cardiac wall stress and (cardiac) hypoxic stimuli are considered to be key drivers of NT-proBNP release, and these peptides are primarily excreted by the kidneys.1,9,10
Females exhibit higher levels of NT-proBNP compared to males; up to a 100% difference in NT-proBNP levels has been observed in healthy individuals.11 The reasons for these sex-specific differences are not fully understood, it has been proposed that sex hormones play a role.12,13 Another important factor affecting NT-proBNP is obesity; previous studies report that individuals with higher body-mass index (BMI) have lower natriuretic peptide levels compared to normal weight subjects.14–16 However, sex-specific data regarding obesity-associated reduction of NT-proBNP remain scarce.
Since males and females have profoundly different anthropometric characteristics and fat distribution17,18 we hypothesised that low NT-proBNP levels observed in obese individuals could be attributed, at least in part, to differences in sex. We, therefore, studied the impact of sex on the relationship between NT-proBNP and obesity-associated parameters, i.e. waist circumference (WC), BMI, and body weight. All analyses were first performed in the combined population and then performed in males and females separately.
2. METHODS
Study Population
The PREVEND (Prevention of REnal and Vascular ENd-stage Disease) study (1997–1998) is a prospective Dutch cohort taken from the general population of Groningen, the Netherlands. All inhabitants of the city of Groningen (N = 85,421) were invited to answer a postal questionnaire and to provide an early morning urine sample. The response rate was 47.8% (N = 40,856), and urinary albumin and creatinine levels were measured in these respondents. Pregnant women (self-reported) and those with prevalent type 1 diabetes mellitus (i.e. those using insulin) were excluded. All remaining subjects with a UAE of ≥ 10 mg/L (N = 6000) and a randomly selected control group with UAE < 10 mg/L (N = 2592) underwent further investigation and constitute the baseline PREVEND cohort. The primary aim of this study was to prospectively evaluate the association of increased urinary albumin excretion (UAE) with CV and renal disease in apparently healthy individuals.
PREVEND participants underwent baseline examination in an outpatient clinic. Urine samples were collected (two consecutive 24h urine samples from each individual) and fasting venous blood samples were drawn into EDTA tubes, aliquoted and stored at −80°C until analysis. NT-proBNP levels were measured in blood samples of 8383 subjects (obtained during the baseline visit) using an Elecsys™ 2010 analyser that uses a electrochemiluminiscence sandwich immunoassay technique (Elecsys proBNP, Roche Diagnostics, Mannheim, Germany). This technique is based on two polyclonal antibodies i.e. a biotinylated antibody and a ruthenium derivative-labelled antibody, that bind to residues in NT-proBNP molecule. The intra-assay imprecision is around 1.2–1.5% whereas the inter-assay imprecision is around 4.4–5.0%; precision profile showed that the intra-assay imprecision is < 10% across the entire analytical range i.e. 5–35,000 ng/L, and is < 3% at all concentrations > 30 ng/L19. Plasma concentrations of NT-proBNP are given as ng/L; divide by 8.46 to convert ng/L to pmol/L (i.e. 100 ng/L = 11.8 pmol/L). Further details of methodology and assays relevant to this study can be found in the Data Supplement.
From the baseline cohort (N=8592), we first excluded patients with prevalent heart failure (HF; N=23). Another 309 participants were excluded due to incomplete data (absent NT-proBNP measurements or incomplete data recorded on obesity-related parameters), leaving 8260 participants for final analysis. (Fig.S1) An in-depth description of the PREVEND study can be found elsewhere.5,20,21 The PREVEND study was conducted according to the principles drafted in the Helsinki declaration. The local medical ethical committee approval was obtained and informed consent was provided by all participants.
Definitions
All measurements were performed during the baseline visit or with plasma samples obtained during the baseline visit. Anthropometric parameters i.e. WC, BMI and body weight were measured in a standing position. WC was measured midway between the lowest rib and the iliac crest, at the end of expiration. Hip circumference was measured at the widest portion at the level of the greater trochanters. Body-mass index (BMI, kg/m2) was calculated as the ratio between weight and (height)2. Hypercholesterolaemia was defined as total serum cholesterol ≥ 6.5 mmol/L (251 mg/dL) or a serum cholesterol of ≥ 5.0 mmol/L (193 mg/dL) if a history of myocardial infarction (MI) was present or when lipid-lowering medication was used. Blood pressure was measured ten times during 10 minutes using an automatic Dinamap XL Model 9300 series; blood pressure was calculated as the mean of the last two measurements. Hypertension was defined as systolic blood pressure > 140 mm Hg, diastolic blood pressure > 90 mm Hg or self-reported antihypertensive medication usage. History of MI was based on subject’s medical history derived from a structured questionnaire (i.e. hospitalization ≥ 3 days as a result of this condition); this was complemented by a review of the medical report. Insulin resistance was calculated using the homeostasis model assessment-estimated insulin resistance (HOMA-IR) method. Type 2 diabetes mellitus was defined as a fasting plasma glucose ≥ 7.0 mmol/L (126 mg/dL), random plasma glucose ≥ 11.1 mmol/L (200 mg/dL), self-reporting of a physician diagnosis or record of glucose-lowering medication use obtained from central pharmacy registry. Smoking was defined as self-reported current smoking or smoking cessation within the previous year. Glomerular filtration rate was estimated using the simplified modification of diet in renal disease (sMDRD) formula.
Statistical Analyses
Normally distributed data are presented as means ± standard deviations (SD) and non-normally distributed data are presented as medians ± interquartile ranges (IQR). Categorical variables are represented as percentages. Skewed variables were log2 transformed in order to facilitate interpretation.
All analyses were performed in the overall population, and also separately in males and females. Two sample t-tests were used to test for differences between two groups with normally distributed data, and Wilcoxon rank-sum test was used for non-normally distributed data. Differences between categorical variables were tested using Pearson’s chi-square test. Associations between log2-transformed NT-proBNP and obesity-associated parameters were evaluated using univariable linear regression analysis and a multivariable regression model that also adjusted for factors known to influence NT-proBNP levels. Results are displayed as standardized β coefficient (Sβ), which represents the standard deviation (SD) change in dependent variable for 1 SD change in the independent variable. R2 represents the coefficient of determination, and can be interpreted as the proportion of variation in the dependent variable that is predictable from one or more independent variables.
Univariable associations of anthropometric parameters and age with median NT-proBNP levels were graphically modelled using kernel-weighted local polynomial smoothing. Multivariable-adjusted associations of WC with NT-proBNP levels were graphically assessed by means of regression analysis using a restricted cubic spline function to check for possible deviations from linearity. As the PREVEND cohort had an overrepresentation of subjects with increased urinary albumin excretion, we performed a sensitivity analysis by further adjusting for urinary albumin levels to test for robustness of output. All statistical analyses were performed using STATA version-14, and a P-value of ≤ 0.05 was considered to be significant.
RESULTS
1. Plasma NT-proBNP levels
The study included 8260 participants that were free of HF at baseline, and 50.1% (N=4140) were females. The mean age of the overall population was 49.3 ± 12.7 years. The median NT-proBNP level in the overall population was 37.5 ng/L (IQR, 16.7–73.5 ng/L); the range varied from ≤ 5 ng/L (N = 732) to ≥ 35,000 ng/L (N=1). NT-proBNP levels were significantly higher in females than in males (50.5, 28.2–87.0 vs. 24.3, 10.1–54.6 ng/L, P < 0.001). (Fig. 1) The mean age in females was slightly (yet significantly) lower than in males (48.2 ± 12.3 vs. 50.4 ± 12.9 years; P < 0.001)
Fig. 1. Distribution of NT-proBNP in males and females.
Histograms showing distribution of log2-transformed NT-proBNP levels in males (blue) and females (red); Values below the detection limit (i.e. 5 ng/L) were assigned random values between 1 ng/L and 5 ng/L
2. Baseline characteristics
We divided the entire population and the sex-specific populations in tertiles of WC to provide initial insights into the association of body fat composition with NT-proBNP and other clinical characteristics. WC is also a better surrogate marker of visceral adipose tissue, which represents a metabolically active adipose tissue compartment.22–26
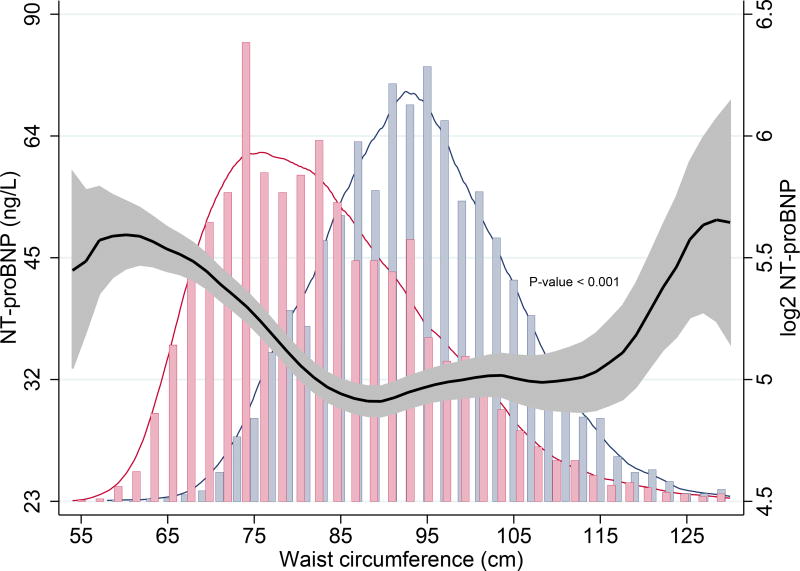
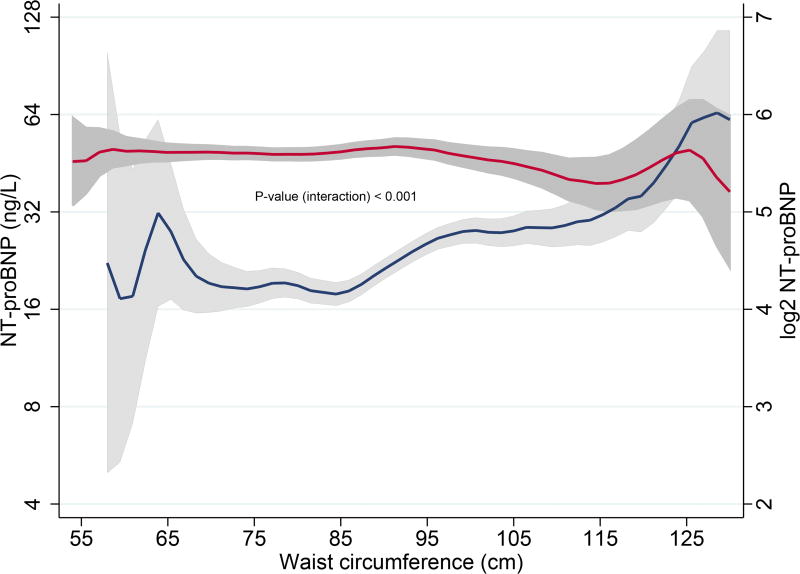
NT-proBNP displayed a “U-shaped” relationship with increasing WC. (Table 1A, Fig. 2A) Subjects with higher WC were usually older and more often males. They also had a more frequent history of hypertension, diabetes mellitus, hypercholesterolaemia and MI. As expected, increase in WC strongly correlated with higher BMI, body weight and total cholesterol, and inversely correlated with high-density lipoprotein levels. Individuals with larger WC also exhibited increased insulin resistance, signs of low-grade systemic inflammation, and reduced renal function. (Table 1A) Stratification by sex revealed similar associations with all parameters, except NT-proBNP: males with higher WC had higher NT-proBNP levels, but no significant association was found in females (Pinteraction < 0.001). (Table 1B, Fig. 2B)
Table 1.
| a: Baseline characteristics according to tertiles of waist circumference in the combined population | ||||
|---|---|---|---|---|
|
| ||||
| (MALES + FEMALES) | ||||
|
|
||||
| Tertile | 1 | 2 | 3 | P-value |
| N | 2797 | 2789 | 2674 | |
| Waist circumference, cm | 74.5 (5.3) | 88.5 (3.5) | 103.4 (7.6) | <0.001 |
|
| ||||
| NT-proBNP, pg/mL | 42.8 (23.3,75.4) | 31.3 (13.9, 66.3) | 35.5 (14.0, 78.3) | <0.001 |
| Sex (Female), N (%) | 2185 (78.1%) | 1173 (42.1%) | 782 (29.2%) | <0.001 |
| Age, years | 43.5 (10.8) | 49.5 (12.6) | 55.1 (11.8) | <0.001 |
| Smoking (last 1 year), N(%) | 1203 (43.1%) | 1037 (37.3%) | 888 (33.3%) | <0.001 |
| Hypertension, N (%) | 292 (10.4%) | 734 (26.3%) | 1227 (46.9%) | <0.001 |
| Diabetes Mellitus, N (%) | 26 (1.0%) | 73 (2.7%) | 213 (8.2%) | <0.001 |
| Hypercholesterolaemia, N (%) | 450 (16.3%) | 803 (29.2%) | 926 (35.1%) | <0.001 |
| Myocardial Infarction, N (%) | 103 (3.7%) | 145 (5.3%) | 244 (9.3%) | <0.001 |
| Body-mass index, kg/m2 | 22.8 (2.4) | 25.8 (2.5) | 29.9 (4.0) | <0.001 |
| Weight, kg | 65.8 (8.0) | 77.9 (8.0) | 91.7 (12.4) | <0.001 |
| Total cholesterol, mmol/L | 5.2 (4.6, 5.9) | 5.7 (4.9, 6.4) | 5.9 (5.2, 6.5) | <0.001 |
| HDL, mmol/L | 1.5 (1.3, 1.8) | 1.2 (1.0, 1.5) | 1.1 (0.9, 1.3) | <0.001 |
| Systolic BP, mm Hg | 118.2 (16.6) | 130.4 (18.7) | 139.1 (19.4) | <0.001 |
| Glucose, mmol/L | 4.4 (4.1, 4.8) | 4.7 (4.4, 5.1) | 5.0 (4.6, 5.6) | <0.001 |
| Insulin resistance (HOMA IR) | 1.2 (0.9, 1.6) | 1.7 (1.2, 2.4) | 2.7 (1.8, 4.2) | <0.001 |
| hs-CRP, mg/L | 0.7 (0.3, 1.9) | 1.2 (0.6, 2.7) | 2.2 (1.1, 4.5) | <0.001 |
| eGFR (mL/min/1.73m2) | 100.6 (15.1) | 94.8 (17.1) | 89.3 (17.7) | <0.001 |
| b: Baseline characteristics according to tertiles of waist circumference in males and females | ||||||||
|---|---|---|---|---|---|---|---|---|
|
| ||||||||
| Characteristic | MALES | FEMALES | ||||||
|
|
|
|||||||
| Tertile | 1 | 2 | 3 | P-value | 1 | 2 | 3 | P-value |
| N | 1437 | 1354 | 1329 | 1406 | 1362 | 1372 | ||
| Waist circumference, cm | 82.4 (5.2) | 93.7 (2.5) | 106.4 (6.8) | <0.001 | 70.6 (3.9) | 81.7 (3.2) | 98.0 (8.8) | <0.001 |
|
| ||||||||
| NTproBNP, pg/mL | 19.1 (9.1, 38.6) | 26.3 (9.8, 62.2) | 29.7 (11.1, 70.7) | <0.001 | 51.0 (30.1, 86.2) | 48.7 (28.6, 81.6) | 51.7 (26.9, 95.6) | 0.35 |
| Age, years | 44.1 (11.6) | 51.7 (12.8) | 55.8 (11.5) | <0.001 | 42.4 (10.1) | 48.2 (11.7) | 54.1 (12.1) | <0.001 |
| Smoking (last 1 year), N(%) | 624 (43.5%) | 503 (37.3%) | 439 (33.2%) | <0.001 | 626 (44.7%) | 501 (36.9%) | 435 (31.8%) | <0.001 |
| Hypertension, N (%) | 206 (14.3%) | 461 (34.0%) | 693 (52.2%) | <0.001 | 120 (8.5%) | 257 (18.9%) | 516 (37.6%) | <0.001 |
| Diabetes mellitus, N (%) | 24 (1.8%) | 44 (3.4%) | 111 (8.7%) | <0.001 | 7 (0.5%) | 22 (1.7%) | 104 (7.7%) | <0.001 |
| Hypercholesterolaemia, N (%) | 254 (17.9%) | 404 (30.2%) | 455 (35.8%) | <0.001 | 205 (14.7%) | 356 (26.4%) | 505 (37.4%) | <0.001 |
| Myocardial Infarction, N (%) | 72 (5.1%) | 116 (8.7%) | 130 (10.0%) | <0.001 | 42 (3.0%) | 54 (4.1%) | 78 (5.8%) | <0.001 |
| Body-mass index, kg/m2 | 23.2 (2.1) | 26.1 (1.9) | 29.9 (3.1) | <0.001 | 22.0 (2.0) | 25.4 (2.4) | 30.5 (4.6) | <0.001 |
| Weight, kg | 74.4 (8.0) | 83.7 (7.4) | 96.1 (11.6) | <0.001 | 61.9 (6.8) | 70.7 (7.2) | 83.8 (12.8) | <0.001 |
| Total cholesterol, mmol/L | 5.3 (4.7, 6.1) | 5.7 (5.0, 6.4) | 5.8 (5.3, 6.5) | <0.001 | 5.1 (4.5, 5.8) | 5.6 (4.8, 6.4) | 5.9 (5.2, 6.6) | <0.001 |
| HDL, mmol/L | 1.2 (1.0, 1.5) | 1.1 (0.9, 1.3) | 1.0 (0.9, 1.2) | <0.001 | 1.6 (1.4, 1.9) | 1.5 (1.2, 1.7) | 1.3 (1.1, 1.5) | <0.001 |
| Systolic BP, mm Hg | 125.6 (15.2) | 134.2 (17.8) | 142.0 (18.7) | <0.001 | 115.0 (16.0) | 123.7 (19.6) | 134.6 (21.9) | <0.001 |
| Glucose, mmol/L | 4.6 (4.3, 5.0) | 4.8 (4.5, 5.2) | 5.1 (4.7, 5.6) | <0.001 | 4.4 (4.0, 4.7) | 4.6 (4.2, 4.9) | 4.9 (4.5, 5.5) | <0.001 |
| Insulin resistance (HOMA IR) | 1.2 (0.9, 1.8) | 1.8 (1.3, 2.6) | 3.0 (1.9, 4.4) | <0.001 | 1.1 (0.8, 1.5) | 1.5 (1.1, 2.1) | 2.5 (1.7, 4.0) | <0.001 |
| hs-CRP, mg/L | 0.7 (0.3, 1.6) | 1.2 (0.6, 2.7) | 2.0 (1.1, 3.9) | <0.001 | 0.7 (0.3, 1.7) | 1.2 (0.6, 2.9) | 2.6 (1.3, 5.2) | <0.001 |
| eGFR (mL/min/1.73m2) | 100.8 (15.5) | 93.0 (17.4) | 88.8 (17.8) | <0.001 | 101.1 (14.3) | 96.5 (16.3) | 89.3 (17.9) | <0.001 |
NT-proBNP, N-terminal pro-B-type natriuretic peptide; HDL, high-density lipoprotein; BP, blood pressure; hs-CRP, high-sensitive C-reactive protein; eGFR, estimated glomerular filtration rate
Fig. 2.
A. Association of waist circumference and NT-proBNP in the overall population using kernel-weighted local polynomial smoothing graphic modelling
Black lines represent median NT-proBNP (ng/L) levels in the overall population; Grey bands represent prediction intervals of median NT-proBNP; Histograms represent distribution of waist circumference in males (blue) and females (red); Waist circumference ≤ 130 cm
B. Associations of waist circumference and NT-proBNP levels in males and in females
Blue lines represent median NT-proBNP (ng/L) levels in males; Red lines represent median NT-proBNP (ng/L) levels in females; Grey bands represent prediction intervals of median NT-proBNP; Waist circumference ≤ 130 cm
We further explored these associations by tabulating baseline characteristics according to tertiles of BMI and body weight; similar trends were observed for all parameters except NT-proBNP. (Tables S1A, S1B, S2A, S2B) In the overall population, increasing BMI was not associated with NT-proBNP levels. Sex-specific analysis revealed that males with higher BMI had higher NT-proBNP levels, while increasing BMI was not associated with higher NT-proBNP in females (Pinteraction = 0.001). (Fig. S2A, S2B)
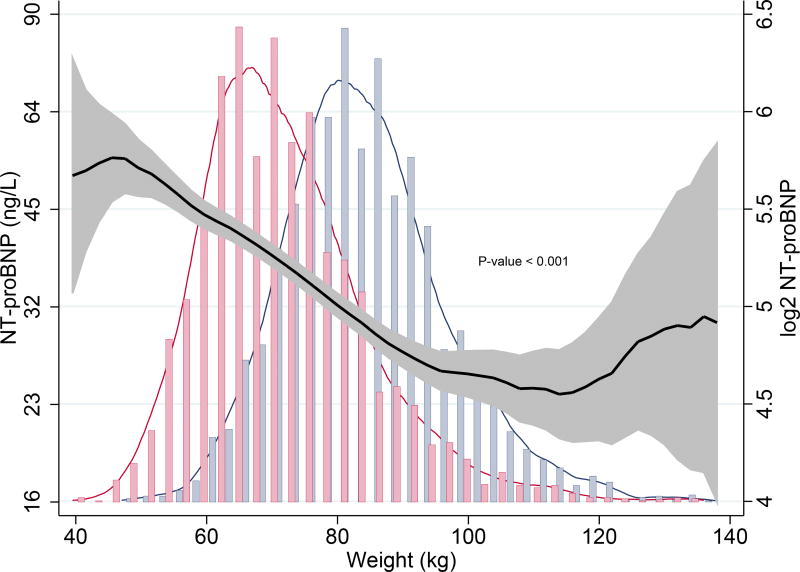
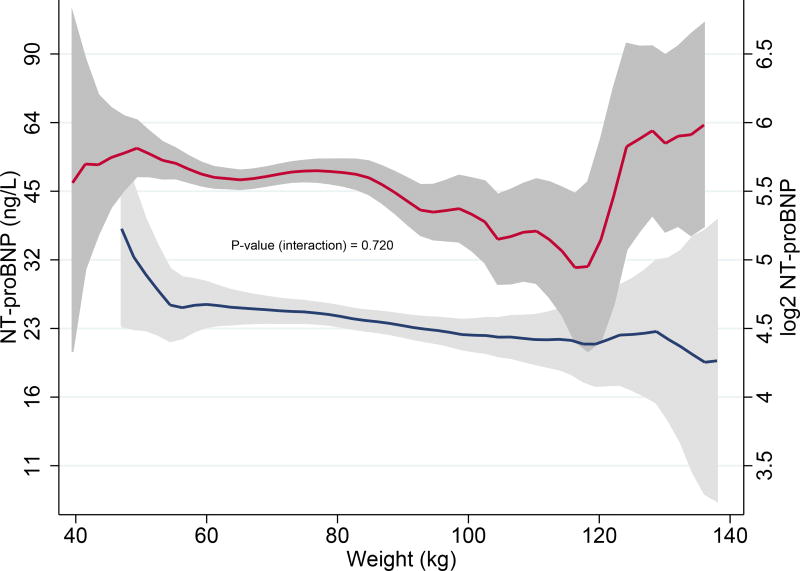
Higher body weight correlated strongly with lower NT-proBNP levels in the overall population (P < 0.001). Sex-stratification significantly modified this negative relationship: heavier males had (slightly) lower NT-proBNP levels and increasing body weight was not associated with NT-proBNP levels in females. Interaction analysis revealed there was no significant difference in the association of body weight with NT-proBNP levels in males and females (Pinteraction = 0.720). (Fig. 3A, 3B)
Fig. 3.
A. Association of body weight and NT-proBNP in the overall population using kernel-weighted local polynomial smoothing graphic modelling
Black lines represent median NT-proBNP (ng/L) levels in the overall population; Grey bands represent prediction intervals of median NT-proBNP; Histograms represent distribution of body weight in males (blue) and females (red); Body weight ≤ 140 kg
B. Associations of body weight and NT-proBNP levels in males and in females
Blue lines represent median NT-proBNP (ng/L) levels in males; Red lines represent median NT-proBNP (ng/L) levels in females; Grey bands represent prediction intervals of median NT-proBNP; Body weight ≤ 140 kg
3. Impact of sex and age on NT-proBNP levels
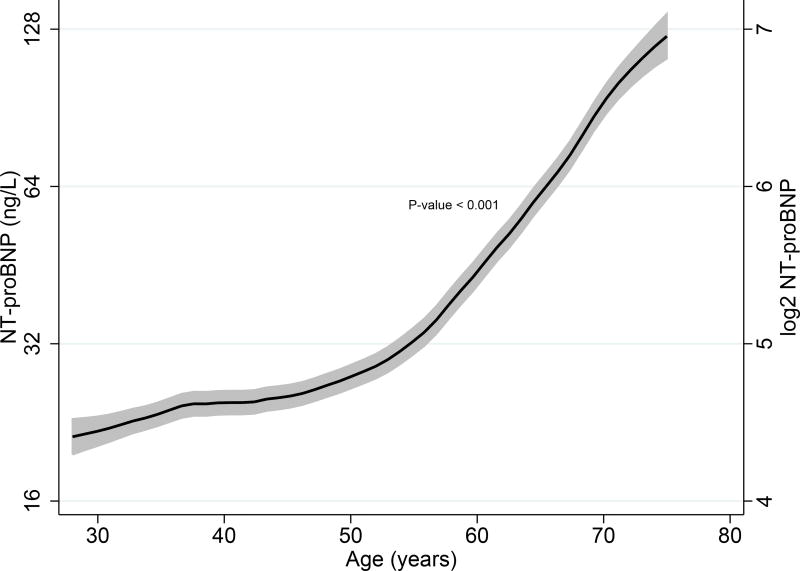
We characterized the relationship of sex and age with NT-proBNP levels using linear regression models. Female sex was associated with higher NT-proBNP levels (β = 0.286, P < 0.001), and sex accounted for approximately 8.2% of the model variance (p < 0.001) in the overall population. Higher age was also associated with higher NT-proBNP levels in the overall population, and age explained 13.0% of the model variance (p < 0.001). (Table 2A) The relationship between age and median NT-proBNP levels are also graphically depicted in Fig. 4A.
Table 2.
| a: Associations of NT-proBNP with age, sex and obesity parameters (combined population) | |||||||||
|---|---|---|---|---|---|---|---|---|---|
|
| |||||||||
| Univariable | Model 1a | Model 2b | |||||||
|
|
|||||||||
| Std β | R2 | p-value | Std β | R2 | p-value | Std β | R2 | p-value | |
| Age | 0.361 | 0.130 | <0.001 | - | - | - | - | - | - |
|
|
|||||||||
| Female Sex | 0.286 | 0.082 | <0.001 | 0.320 | 0.231 | <0.001 | 0.337 | 0.285 | <0.001 |
| b: Sex-stratified associations of NTproBNP with obesity parameters | ||||||||||||||
|---|---|---|---|---|---|---|---|---|---|---|---|---|---|---|
|
| ||||||||||||||
| Model 1a | Interaction p-value |
Model 2b | Interaction p-value |
|||||||||||
|
|
|
|||||||||||||
| Males | Females | Males | Females | |||||||||||
|
|
|
|||||||||||||
| Std β | R2 | p-value | Std β | R2 | p-value | Std β | R2 | p-value | Std β | R2 | p-value | |||
| Waist circumference (SD) | −0.072 | 0.274 | <0.001 | −0.129 | 0.074 | <0.001 | <0.001 | −0.074 | 0.341 | <0.001 | −0.166 | 0.120 | <0.001 | <0.001 |
|
|
||||||||||||||
| Body-mass index (SD) | −0.084 | 0.277 | <0.001 | −0.129 | 0.075 | <0.001 | 0.001 | −0.083 | 0.342 | <0.001 | −0.171 | 0.122 | <0.001 | 0.001 |
|
|
||||||||||||||
| Weight (SD) | −0.056 | 0.273 | <0.001 | −0.088 | 0.067 | <0.001 | 0.040 | −0.048 | 0.339 | 0.002 | −0.117 | 0.112 | <0.001 | 0.022 |
SD – standard deviation; R2 – adjusted R-squared
Age-adjusted associations
Associations after adjusting for age, history of myocardial infarction, hypertension, antihypertensive medication, insulin resistance (HOMA IR), glomerular filtration rate and high-sensitive C-reactive protein
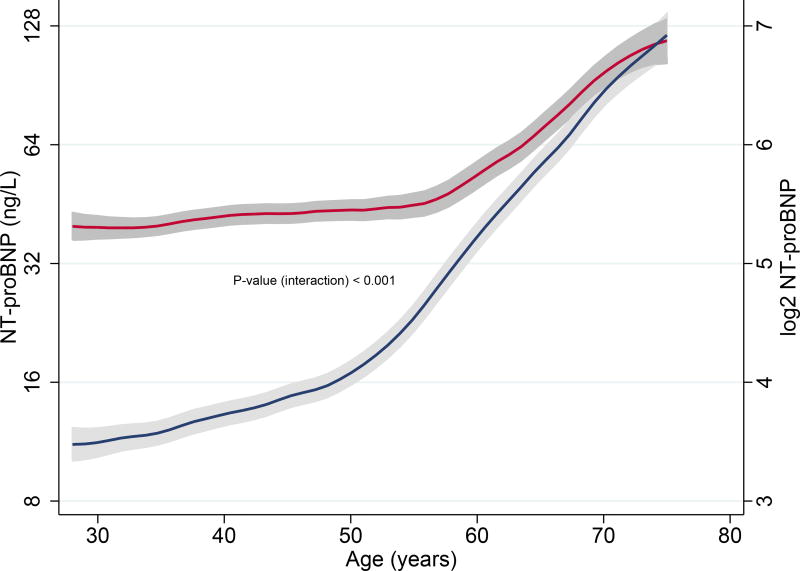
Fig. 4.
A. Associations of age and NT-proBNP levels in the combined population using kernel-weighted local polynomial smoothing graphic modeling
Black lines represent median NT-proBNP (ng/L) levels in the overall population; Grey bands represent prediction intervals of median NT-proBNP
B. Associations age and NT-proBNP levels in males and females
Blue lines represent median NT-proBNP (ng/L) levels in males; Red lines represent median NT-proBNP (ng/L) levels in females; Grey bands represent prediction intervals of median NT-proBNP
When we evaluated the relationship of age with NT-proBNP sex-specifically, there was a very strong and positive association between age and NT-proBNP levels in males (β = 0.520, P < 0.001). Females also exhibited a significant positive correlation with age, albeit weaker (β = 0.245, P < 0.001). Age-related increases in NT-proBNP was clearly higher in males than in females (Pinteraction< 0.001). (Fig. 4B) Age explained about 27.0% of the model variance in males (p < 0.001), while it accounted for only 6.0% of the model variance in females (p < 0.001)
4. Associations of anthropometric parameters with NT-proBNP
We then sex-stratified our analyses and evaluated the association of anthropometric parameters with NT-proBNP levels using a linear regression model that adjusted for age (Model 1) and a multivariable-adjusted model that also accounted for other covariates known to affect NT-proBNP levels (Model 2).12
After accounting for age in Model 1, all obesity-parameters displayed an inverse relationship with NT-proBNP levels in both males and females. Increasing WC, BMI and body weight were significantly associated with lower NT-proBNP levels in females compared with males (Pinteraction < 0.05). (Table 2B)
Other factors affecting NT-proBNP include previous MI, renal dysfunction, hypertension including antihypertensive medication usage, insulin resistance, and low-grade systemic inflammation.12,27 We validated their associations with NT-proBNP in the overall population, and in males and females separately. (Table S3). After adjusting for these covariates in Model 2, there was a strong and inverse association between WC and NT-proBNP in females (β = −0.166, P < 0.001) and a weaker inverse association in males (β = −0.074, P < 0.001), with a significant difference between the sexes; Pinteraction < 0.001. The associations of BMI and body weight with NT-proBNP levels in males and females exhibited an identical pattern. (Table 2B)
5. Association of abdominal obesity with NT-proBNP
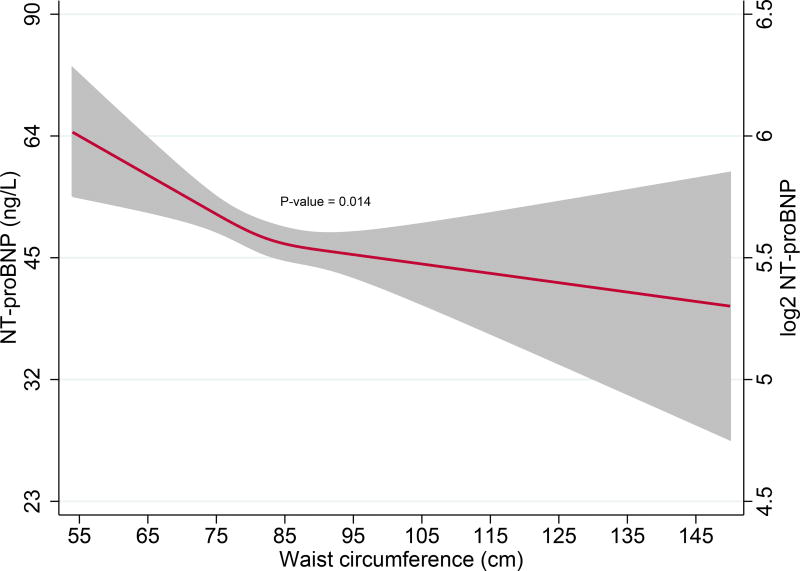
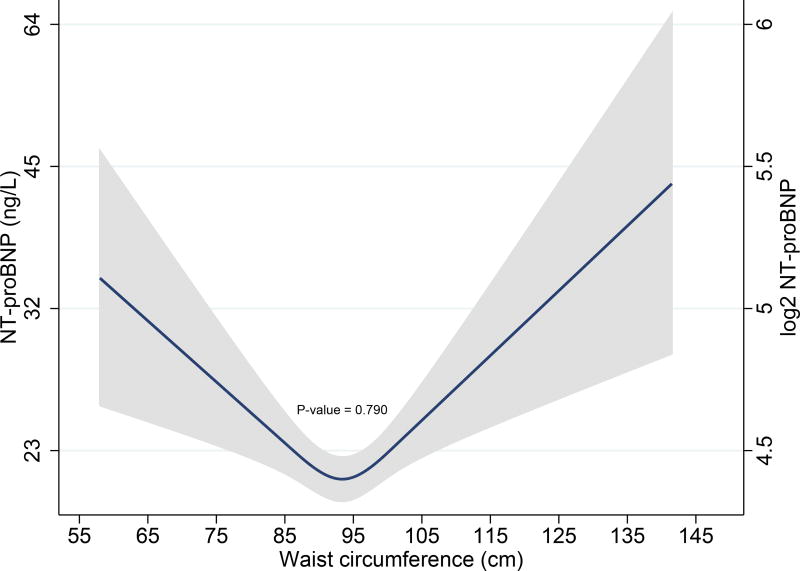
Finally, we evaluated the relationship of NT-proBNP with increasing abdominal obesity using a multivariable model that adjusted for all covariates in Model 2, but now also correcting for BMI. Increasing WC was associated with lower NT-proBNP levels only in females (β = −0.076, P = 0.014), but not in males (β = −0.008, P = 0.790), Pinteraction < 0.001. (Fig. 5A, 5B)
Fig 5.
A. Restricted cubic spline curves depicting associations of waist circumference with NT-proBNP levels after multivariable adjustment in females
Red lines represent plasma NT-proBNP (ng/L) levels in females; Restricted cubic spline curves represent associations after adjusting for age, myocardial infarction, hypertension, hypertensive drug usage, insulin resistance, glomerular filtration rate, C-reactive protein and body-mass index
B. Restricted cubic spline curves depicting associations of waist circumference with NT-proBNP levels after multivariable adjustment in males
Blue lines represent plasma NT-proBNP (ng/L) levels in males; Restricted cubic spline curves represent associations after adjusting for age, myocardial infarction, hypertension, hypertensive drug usage, insulin resistance, glomerular filtration rate, C-reactive protein and body-mass index
Grouping according to tertiles of age showed that there was a significant inverse association between abdominal obesity and NT-proBNP levels in females in the highest age tertile (mean age = 65 years). There was also a significant interaction between NT-proBNP and sex in this age-tertile. (Table S5A) When women were grouped according to menopausal status, abdominal obesity was significantly associated with lower NT-proBNP levels in post-menopausal women with a menopausal status > 2 years (mean age = 62 years). (Table S6A)
Further adjustment for urinary albumin excretion, both as a continuous variable and as a categorical variable did not affect any of the results significantly. (Tables S4, S5B, S6B)
DISCUSSION
1. Principal findings
Using a large sample of individuals from the general population, we investigated the effect of sex on “obesity-associated decrease” in NT-proBNP levels. Our results indicate that natriuretic peptide deficiency in obesity has a significant sex-associated component. Sex modified the inverse association of NT-proBNP with obesity such that this negative association was more pronounced among females compared with males. Importantly, abdominal obesity was associated with lower NT-proBNP levels in females but not in males. Sex also modified the direct association of NT-proBNP with age such that age-related increases in NT-proBNP were much greater among males compared with females. Our data therefore suggest that while interpreting NT-proBNP levels in clinical practice, particularly in obese individuals, sex and age should be considered.
2. NT-proBNP levels in obesity: impact of sex and age
Several studies, including our study indicate that baseline NT-proBNP levels are lower in males compared to females.7,8 Previous studies also report that circulating natriuretic peptides are lower in obese individuals compared to normal weight individuals;14,16,28–30 however, sex-differences in “obesity-associated reduction” of NT-proBNP was not analysed in depth.
In our study, the relationship between obesity (i.e. increasing WC and BMI) and NT-proBNP in the general population was significantly modified by sex; in fact, after sex-stratification, males surprisingly displayed higher NT-proBNP levels with increasing WC and BMI (Fig. 2B, S2B). Age, however, strongly confounded the relationship of these parameters with NT-proBNP.
We also demonstrate that lower NT-proBNP levels in individuals with higher body weight is better explained by sex than by obesity as males (on an average) weigh more than females, but also have lower median NT-proBNP levels. After stratifying according to sex, increasing body weight was not associated with NT-proBNP levels in females, while heavier males displayed slightly lower NT-proBNP levels; interestingly, variation of age was minimal among tertiles of weight in men.
Increasing age is associated with progressively higher NT-proBNP levels in the general population7,8, and our current study dissects that age-associated increase in NT-proBNP is significantly greater in males than in females. Furthermore, the relationship between age and higher NT-proBNP levels appears to be more uniform in males. In females, the positive association of age with NT-proBNP is remarkable from approximately 55–60 years (Fig. 3B).
Age-associated increase in NT-proBNP could directly result from CV disorders (e.g. hypertension, MI) or as a consequence of comorbidities such as renal dysfunction. Other factors associated with NT-proBNP include insulin resistance, low-grade systemic inflammation and anti-hypertensive medication usage.12,27 After adjusting for the above-mentioned factors including age, our study unveils that NT-proBNP levels decline with obesity, more in females than in males.
3. Mechanisms affecting NT-proBNP levels in obesity
It is currently hypothesized that natriuretic peptide (i.e. BNP and NT-proBNP) secretion is either inhibited by factors released by adipose tissue or actively metabolized by clearance receptors (e.g. NPR-C receptor) in obese individuals.28,30 Van Kimmenade et al. explored these hypotheses and demonstrated that weight loss is associated with a concomitant increase of both BNP and NT-proBNP. As NPR-C receptor activity is more specific for BNP, and does not affect NT-proBNP clearance, this study illustrates that obesity suppresses their common production rather than increasing their clearance.31
Khan et al. evaluated mechanisms underlying the relative natriuretic peptide deficiency associated with obesity using two large cohorts, and also performed analysis in males and females separately; however, no direct comparison was made between males and females. The study concluded that obesity may confer such effects partly through insulin resistance.27 We, therefore evaluated the effects of obesity on NT-proBNP levels after accounting for major cardiovascular risk factors including insulin resistance, and our results indicate that even after multivariable adjustment the inverse-relationship of obesity with NT-proBNP is stronger in females than in males (Table 2).
Furthermore, we specifically evaluated the effects of abdominal obesity on NT-proBNP levels after accounting for general fat distribution (i.e. BMI), and demonstrate that abdominal obesity is associated with lower NT-proBNP levels in females, but not in males. An important mechanism through which abdominal obesity affects plasma concentrations of NT-proBNP could be through modulation of sex hormones, especially testosterone. According to data from randomised controlled trials, testosterone administration reduces NT-proBNP levels in both females32 and in males.33 Interestingly, visceral fat has been recognized to increase circulating testosterone levels, particularly in females,34–36 and this may explain why women with abdominal obesity have lower NT-proBNP levels. However, this mechanism may not operate in males as visceral adiposity, unlike in females, is associated with decreased androgen levels.35
Our study also indicates that the effect of abdominal obesity on NT-proBNP levels appears to be more prominent in older females, particularly in post-menopausal women (Table S6). Natriuretic peptides are cardioprotective, and play an important role in sodium and water excretion, and in the reduction of blood pressure. Post-menopausal women have a higher risk of developing CV disorders, and lower natriuretic peptides associated with abdominal obesity could result in increased blood pressure and reduced cardioprotection, accelerating the development of unfavourable CV outcomes.37,38
Abdominal obesity may thus elicit a “high-risk CV phenotype” in women by promoting a state of cardiac endocrine insufficiency resulting in reduced natriuretic peptide production by the heart. Further mechanistic studies are needed to verify this hypothesis.
Study strengths and limitations
The PREVEND study is a large, well-characterized community-based cohort with an almost 50-50 sex ratio and a relatively low mean age. Careful measurement and documentation of routine blood tests and anthropometric parameters were performed in all participants, and plasma NT-proBNP concentrations were measured using a reliable assay. Furthermore, in our statistical analyses, we accounted for non-linear associations of obesity with NT-proBNP levels using a regression analysis with a restricted cubic spline function.
We acknowledge certain limitations of our study. This is a post-hoc study and PREVEND cohort was enriched for increased UAE, but this overrepresentation was overcome using a statistical correction method. Although we excluded individuals with prevalent HF in our baseline cohort, it is possible that some of these individuals had prevalent HF with preserved ejection fraction (HFpEF) or HF with mid-range ejection fraction (HFmEF), as such a distinction is made only in the more recent 2016 ESC guidelines.39 The assay used in our study uses two polyclonal antibodies for detection of epitopes in NT-proBNP and has a functional sensitivity of < 50 ng/L; more recently developed assays use monoclonal antibodies for detection – however, their analytical performance is comparable the polyclonal ECLIA method. Although WC, BMI and body weight are regularly utilized markers of (abdominal) obesity, more accurate measures of fat distribution could be obtained using magnetic resonance imaging (MRI); however such modalities may not be practical to be employed in large population studies. Another limitation is that our cohort is predominantly Caucasian and therefore our results should be validated in other ethnicities and population groups. Finally, our study is observational; therefore, we are unable to draw conclusions regarding causality.
Concluding remarks
Firstly, we demonstrate that a large part of the “obesity-associated reduction” in NT-proBNP levels in the general population is explained by sex. Secondly, age confounds the relationship of obesity with NT-proBNP, and age-associated increase in NT-proBNP is greater in men than in women. Finally, the inverse relationship between obesity and NT-proBNP levels is stronger in females compared to males, and abdominal obesity is associated with lower NT-proBNP levels in females but not in males. Further studies are needed to understand the mechanisms through which abdominal obesity reduces NT-proBNP levels in women.
Supplementary Material
Acknowledgments
Funding
This work was supported by the Netherlands Heart Foundation (CVON DOSIS, grant 2014-40, to Dr. de Boer); CVON SHE-PREDICTS-HF, grant 2017-21 (to Drs. de Boer, van Empel, Heymans, and Schroen); and CVON RED-CVD, grant 2017-11, to Dr. de Boer; and the Innovational Research Incentives Scheme program of the Netherlands Organization for Scientific Research (NWO VIDI, grant 917.13.350, to Dr. de Boer). Dr. Ho is supported by NIH grants K23 HL116780 and RO1 HL134893.
The UMC Groningen, which employs several authors, received research funding from AstraZeneca, Bristol-Myers Squibb, Novartis, Roche, ThermoFisher and Trevena. Dr.de Boer received speaker and advisory board honoraria from Novartis.
References
- 1.Roberts E, et al. The diagnostic accuracy of the natriuretic peptides in heart failure: systematic review and diagnostic meta-analysis in the acute care setting. BMJ. 2015;350:h910. doi: 10.1136/bmj.h910. [DOI] [PMC free article] [PubMed] [Google Scholar]
- 2.de Boer RA, Daniels LB, Maisel AS, Januzzi JL. State of the Art: Newer biomarkers in heart failure. Eur. J. Heart Fail. 2015;17:559–69. doi: 10.1002/ejhf.273. [DOI] [PubMed] [Google Scholar]
- 3.Chow SL, et al. Role of Biomarkers for the Prevention, Assessment, and Management of Heart Failure: A Scientific Statement From the American Heart Association. Circulation. 2017;135:e1054–e1091. doi: 10.1161/CIR.0000000000000490. [DOI] [PubMed] [Google Scholar]
- 4.Willeit P, et al. Natriuretic peptides and integrated risk assessment for cardiovascular disease: an individual-participant-data meta-analysis. Lancet. Diabetes Endocrinol. 2016;4:840–9. doi: 10.1016/S2213-8587(16)30196-6. [DOI] [PMC free article] [PubMed] [Google Scholar]
- 5.Linssen GCM, et al. N-terminal pro-B-type natriuretic peptide is an independent predictor of cardiovascular morbidity and mortality in the general population. Eur. Heart J. 2010;31:120–7. doi: 10.1093/eurheartj/ehp420. [DOI] [PubMed] [Google Scholar]
- 6.Weber M. Role of B-type natriuretic peptide (BNP) and NT-proBNP in clinical routine. Heart. 2005;92:843–849. doi: 10.1136/hrt.2005.071233. [DOI] [PMC free article] [PubMed] [Google Scholar]
- 7.Redfield MM, et al. Plasma brain natriuretic peptide concentration: impact of age and gender. J. Am. Coll. Cardiol. 2002;40:976–82. doi: 10.1016/s0735-1097(02)02059-4. [DOI] [PubMed] [Google Scholar]
- 8.Raymond I, et al. The influence of age, sex and other variables on the plasma level of N-terminal pro brain natriuretic peptide in a large sample of the general population. Heart. 2003;89:745–51. doi: 10.1136/heart.89.7.745. [DOI] [PMC free article] [PubMed] [Google Scholar]
- 9.Maeder MT, Mariani JA, Kaye DM. Hemodynamic determinants of myocardial B-type natriuretic peptide release: relative contributions of systolic and diastolic wall stress. Hypertens. (Dallas, Tex. 1979) 2010;56:682–9. doi: 10.1161/HYPERTENSIONAHA.110.156547. [DOI] [PubMed] [Google Scholar]
- 10.Anwaruddin S, et al. Renal function, congestive heart failure, and amino-terminal pro-brain natriuretic peptide measurement: results from the ProBNP Investigation of Dyspnea in the Emergency Department (PRIDE) Study. J. Am. Coll. Cardiol. 2006;47:91–7. doi: 10.1016/j.jacc.2005.08.051. [DOI] [PubMed] [Google Scholar]
- 11.Fradley MG, et al. Reference limits for N-terminal-pro-B-type natriuretic peptide in healthy individuals (from the Framingham Heart Study) Am. J. Cardiol. 2011;108:1341–5. doi: 10.1016/j.amjcard.2011.06.057. [DOI] [PMC free article] [PubMed] [Google Scholar]
- 12.Lam CSP, et al. Influence of sex and hormone status on circulating natriuretic peptides. J. Am. Coll. Cardiol. 2011;58:618–26. doi: 10.1016/j.jacc.2011.03.042. [DOI] [PMC free article] [PubMed] [Google Scholar]
- 13.Chang AY, et al. Associations Among Androgens, Estrogens, and Natriuretic Peptides in Young Women. Observations From the Dallas Heart Study. J. Am. Coll. Cardiol. 2007;49:109–116. doi: 10.1016/j.jacc.2006.10.040. [DOI] [PubMed] [Google Scholar]
- 14.Das SR, et al. Impact of body mass and body composition on circulating levels of natriuretic peptides: results from the Dallas Heart Study. Circulation. 2005;112:2163–8. doi: 10.1161/CIRCULATIONAHA.105.555573. [DOI] [PubMed] [Google Scholar]
- 15.Bayes-Genis A, et al. Effect of body mass index on diagnostic and prognostic usefulness of amino-terminal pro-brain natriuretic peptide in patients with acute dyspnea. Arch. Intern. Med. 2007;167:400–7. doi: 10.1001/archinte.167.4.400. [DOI] [PubMed] [Google Scholar]
- 16.Ndumele CE, et al. N-Terminal Pro-Brain Natriuretic Peptide and Heart Failure Risk Among Individuals With and Without Obesity: The Atherosclerosis Risk in Communities (ARIC) Study. Circulation. 2016;133:631–8. doi: 10.1161/CIRCULATIONAHA.115.017298. [DOI] [PMC free article] [PubMed] [Google Scholar]
- 17.Karastergiou K, Smith SR, Greenberg AS, Fried SK. Sex differences in human adipose tissues - the biology of pear shape. Biol. Sex Differ. 2012;3:13. doi: 10.1186/2042-6410-3-13. [DOI] [PMC free article] [PubMed] [Google Scholar]
- 18.Taylor RW, Grant AM, Williams SM, Goulding A. Sex differences in regional body fat distribution from pre- to postpuberty. Obesity (Silver Spring) 2010;18:1410–6. doi: 10.1038/oby.2009.399. [DOI] [PubMed] [Google Scholar]
- 19.Collinson PO, et al. Analytical performance of the N terminal pro B type natriuretic peptide (NT-proBNP) assay on the Elecsys 1010 and 2010 analysers. Eur. J. Heart Fail. 2004;6:365–8. doi: 10.1016/j.ejheart.2004.01.011. [DOI] [PubMed] [Google Scholar]
- 20.de Boer RA, et al. Plasma renin and outcome in the community: data from PREVEND. Eur. Heart J. 2012;33:2351–9. doi: 10.1093/eurheartj/ehs198. [DOI] [PubMed] [Google Scholar]
- 21.Suthahar N, et al. Heart failure and inflammation-related biomarkers as predictors of new-onset diabetes in the general population. Int. J. Cardiol. 2018;250:188–194. doi: 10.1016/j.ijcard.2017.10.035. [DOI] [PubMed] [Google Scholar]
- 22.Balkau B, et al. International Day for the Evaluation of Abdominal Obesity (IDEA): a study of waist circumference, cardiovascular disease, and diabetes mellitus in 168,000 primary care patients in 63 countries. Circulation. 2007;116:1942–51. doi: 10.1161/CIRCULATIONAHA.106.676379. [DOI] [PMC free article] [PubMed] [Google Scholar]
- 23.Dobbelsteyn CJ, Joffres MR, MacLean DR, Flowerdew G. A comparative evaluation of waist circumference, waist-to-hip ratio and body mass index as indicators of cardiovascular risk factors. The Canadian Heart Health Surveys. Int. J. Obes. Relat. Metab. Disord. 2001;25:652–61. doi: 10.1038/sj.ijo.0801582. [DOI] [PubMed] [Google Scholar]
- 24.Janssen I, Katzmarzyk PT, Ross R. Waist circumference and not body mass index explains obesity-related health risk. Am. J. Clin. Nutr. 2004;79:379–84. doi: 10.1093/ajcn/79.3.379. [DOI] [PubMed] [Google Scholar]
- 25.Staiano AE, et al. Body mass index versus waist circumference as predictors of mortality in Canadian adults. Int. J. Obes. (Lond) 2012;36:1450–4. doi: 10.1038/ijo.2011.268. [DOI] [PMC free article] [PubMed] [Google Scholar]
- 26.Tsujimoto T, Kajio H. Abdominal Obesity Is Associated With an Increased Risk of All-Cause Mortality in Patients With HFpEF. J. Am. Coll. Cardiol. 2017;70:2739–2749. doi: 10.1016/j.jacc.2017.09.1111. [DOI] [PubMed] [Google Scholar]
- 27.Khan AM, et al. Cardiac natriuretic peptides, obesity, and insulin resistance: evidence from two community-based studies. J. Clin. Endocrinol. Metab. 2011;96:3242–9. doi: 10.1210/jc.2011-1182. [DOI] [PMC free article] [PubMed] [Google Scholar]
- 28.Dessì-Fulgheri P, et al. Plasma atrial natriuretic peptide and natriuretic peptide receptor gene expression in adipose tissue of normotensive and hypertensive obese patients. J. Hypertens. 1997;15:1695–9. doi: 10.1097/00004872-199715120-00074. [DOI] [PubMed] [Google Scholar]
- 29.Fox ER, et al. Relation of obesity to circulating B-type natriuretic peptide concentrations in blacks: the Jackson Heart Study. Circulation. 2011;124:1021–7. doi: 10.1161/CIRCULATIONAHA.110.991943. [DOI] [PMC free article] [PubMed] [Google Scholar]
- 30.Gentili A, et al. Modulation of natriuretic peptide receptors in human adipose tissue: molecular mechanisms behind the ‘natriuretic handicap’ in morbidly obese patients. Transl. Res. 2017;186:52–61. doi: 10.1016/j.trsl.2017.06.001. [DOI] [PubMed] [Google Scholar]
- 31.van Kimmenade R, et al. Is brain natriuretic peptide production decreased in obese subjects? J. Am. Coll. Cardiol. 2006;47:886–7. doi: 10.1016/j.jacc.2005.11.022. [DOI] [PubMed] [Google Scholar]
- 32.Lin E, et al. Effects of transdermal testosterone on natriuretic peptide levels in women: a randomized placebo-controlled pilot study. Fertil. Steril. 2012;97:489–93. doi: 10.1016/j.fertnstert.2011.11.001. [DOI] [PMC free article] [PubMed] [Google Scholar]
- 33.Gianatti EJ, et al. Effect of testosterone treatment on cardiac biomarkers in a randomized controlled trial of men with type 2 diabetes. Clin. Endocrinol. (Oxf) 2016;84:55–62. doi: 10.1111/cen.12842. [DOI] [PubMed] [Google Scholar]
- 34.Kirschner MA, et al. Androgen-estrogen metabolism in women with upper body versus lower body obesity. J. Clin. Endocrinol. Metab. 1990;70:473–9. doi: 10.1210/jcem-70-2-473. [DOI] [PubMed] [Google Scholar]
- 35.Pasquali R. Obesity and androgens: facts and perspectives. Fertil. Steril. 2006;85:1319–1340. doi: 10.1016/j.fertnstert.2005.10.054. [DOI] [PubMed] [Google Scholar]
- 36.Janssen I, Powell LH, Kazlauskaite R, Dugan SA. Testosterone and visceral fat in midlife women: the Study of Women’s Health Across the Nation (SWAN) fat patterning study. Obesity (Silver Spring) 2010;18:604–10. doi: 10.1038/oby.2009.251. [DOI] [PMC free article] [PubMed] [Google Scholar]
- 37.Ley SH, et al. Duration of Reproductive Life Span, Age at Menarche, and Age at Menopause Are Associated With Risk of Cardiovascular Disease in Women. J. Am. Heart Assoc. 2017;6 doi: 10.1161/JAHA.117.006713. [DOI] [PMC free article] [PubMed] [Google Scholar]
- 38.Nishikimi T, Maeda N, Matsuoka H. The role of natriuretic peptides in cardioprotection. Cardiovasc. Res. 2006;69:318–28. doi: 10.1016/j.cardiores.2005.10.001. [DOI] [PubMed] [Google Scholar]
- 39.Ponikowski P, et al. 2016 ESC Guidelines for the diagnosis and treatment of acute and chronic heart failure: The Task Force for the diagnosis and treatment of acute and chronic heart failure of the European Society of Cardiology (ESC). Developed with the special contribution. Eur. J. Heart Fail. 2016;18:891–975. doi: 10.1002/ejhf.592. [DOI] [PubMed] [Google Scholar]
Associated Data
This section collects any data citations, data availability statements, or supplementary materials included in this article.


