

Abstract
Objective
To characterize [11C]-PBR28 brain uptake using positron emission tomography (PET) in people with amyotrophic lateral sclerosis (ALS), and primary lateral sclerosis (PLS). We have previously shown increased [11C]-PBR28 uptake in the precentral gyrus in a small group of ALS patients. Herein, we confirm our initial finding, study the longitudinal changes, and characterize the gray vs. white matter distribution of [11C]-PBR28 uptake in a larger cohort of patients with ALS and PLS.
Methods
Eighty-five participants including 53 ALS, 11 PLS and 21 healthy controls underwent integrated [11C]-PBR28 PET-MR brain imaging. Patients were clinically assessed using the upper motor neuron burden (UMNB), and the revised ALS functional rating scale (ALSFRS-R). [11C]-PBR28 uptake was quantified as standardized uptake value ratio (SUVR), and compared between groups. Cortical thickness, and fractional anisotropy were compared between groups and correlated with SUVR and the clinical data. [11C]-PBR28 uptake and ALSFRS-R were compared longitudinally over six-month in ten ALS individuals.
Results
Whole brain voxel-wise, surface-based and region of interest analyses revealed increased [11C]-PBR28 uptake in the precentral and paracentral gyri in ALS, and in the sub-cortical white matter for the same regions in PLS, compared to controls. The increase in [11C]-PBR28 uptake co-localized and correlated with cortical thinning, reduced fractional anisotropy, increased mean diffusivity, and correlated with higher UMNB score. No significant changes were detected in [11C]-PBR28 uptake over six-month despite clinical progression.
Interpretation
Glial activation measured by in vivo [11C]-PBR28 PET is increased in pathologically relevant regions in people with ALS and correlates with clinical measures.
Search Terms: [11C]-PBR28, PET, DWI, Glia, PLS, ALS
Introduction
Amyotrophic lateral sclerosis (ALS) has a spectacular failure rate when it comes to clinical drug development, partly due to the lack of in vivo markers of target engagement in early phases of clinical trials. Developing such molecular imaging tools can accelerate the rate of drug discovery by providing in vivo evidence of the biological effects of experimental treatments in the targeted brain tissue. These tools would be invaluable in guiding dose selection and go-no-go decisions in phase I/II trials.
Genetics, pathological studies and biofluid markers involve neuroinflammation and specifically activated microglia in ALS pathophysiology1–3. Activated microglia are increased in ALS postmortem motor cortex, brainstem, and spinal cord tissue, and this increase correlates with faster disease progression4. Activated microglia are also detected near motor neurons of SOD1G93A transgenic mice before the onset of weakness, and the inflammatory response in these mice correlates with disease progression5. Furthermore, lowering mutant SOD1 expression in microglia alone in Lox-SOD1 G37R mice prolongs survival, mostly due to slowing later disease progression3.
We have previously shown increased [11C]-PBR28 uptake in the precentral gyrus in a small cohort of ALS participants compared to healthy controls6,7. [11C]-PBR28 is a positron emission tomography (PET) radiotracer that binds to a 18pkD translocator protein (TSPO)8, which is expressed in activated microglia, reactive astrocytes, vascular endothelium, and to a much lower degree in neurons9,10. In this study, we will refer to activated microglia and astrocytes collectively as ‘glial activation’.
Here, we confirm our initial finding, correlate molecular (PET) and structural (MRI) measures with clinical outcomes, and study the longitudinal changes of [11C]-PBR28 in a cohort of patients with ALS and PLS.
Methods
Study Participants
This cross-sectional and longitudinal study was conducted at Massachusetts General Hospital (MGH). Between May 22, 2012, and May 24, 2017, eighty-five individuals including 53 ALS individuals, 11 PLS, and 21 healthy controls were recruited from the ALS clinic at MGH and from online advertisements for healthy volunteers. The eligibility criteria included having either mixed- or high-TSPO binding affinity11, not taking any anti-inflammatory, immune modulating, or experimental therapies, and having no contraindication for PET-MRI scans. In addition, ALS participants needed to satisfy the modified El-Escorial diagnostic criteria12, and PLS participants needed to fulfill Pringles diagnostic criteria13 of having progressive pure upper motor neuron (UMN) dysfunction for at least four years.
All study participants were genotyped for the TSPO gene Ala147Thr polymorphism, which predicts binding affinity to [11C]-PBR28.14 Depending on this genotype, subjects can either be high (ala/ala), mixed (ala/thr) or low (thr/thr) affinity binders. Because the PET signal in low affinity binders is negligible, participants with the (thr/thr) genotype were excluded from the study. High or mixed affinity binder status was modeled as a regressor of no interest in all the analyses to account for differences in PET signal across genotypes.
Participants who fulfilled the inclusion/exclusion criteria and either mixed- or high-TSPO binders underwent [11C]-PBR28 PET and MRI imaging at the Martinos Center for Biomedical Imaging at MGH (Boston, MA). In addition, ALS and PLS participants were evaluated clinically using the revised ALS functional rating scale (ALSFRS-R)15 and the upper motor neuron burden scale (UMNB)6. The rate of disease progression at baseline was calculated as [48 - baseline ALSFRS-R/Disease Duration (in months)]. This study was approved by the Partners Institutional Review Board (IRB), and the MGH Radioactive Drug Research Committee. All participants provided written informed consent before study enrollment.
PET-MR data acquisition
All participants underwent imaging studies using the same integrated PET-MR scanner which consisted of Siemens 3T Magnetom Tim Trio scanner (Siemens Erlangen, Germany) with a PET insert. [11C]-PBR28 was synthesized on site16. The mean [SD] administered dose of the radioligand for ALS was 473·61 [78·31] MBq, for PLS 495·02 [66·47] MBq, and for HC 428·27 [47·19] MBq. PET images were acquired in a list mode format for 90 minutes scanning time.
The acquired MRI images included: 1) Multiple gradient echo 3-dimensional (3D) magnetization-prepared rapid acquisition (ME-MPRAGE) images (multi-echo time TEs= [1.63, 3.49, 5.35, 7.21]; repetition time TR=1200; flip angle =7 degrees; field of view FOV=280; slice orientation=PSL; 1mm isotropic voxels), and 2) diffusion images (60 diffusion directions, b value=3,000s/mm2, eight low b volumes, TE=112; TR=8000; flip angle =90 degrees; FOV=220; slice orientation=LAS; 2.5mm isotropic voxels).
PET-MR data analyses
Late-uptake [11C]-PBR28 PET images were created for 60–90 min post injection. The methods of [11C]-PBR28 PET data analysis have been well documented17, and PET data quantified as standardized uptake value (SUV). To account for the large inter-individual variability in the global PET signal, SUV was normalized by whole-brain PET uptake and expressed as SUVR7.
The primary MR measures were FreeSurfer (v6.0, https://surfer.nmr.mgh.harvard.edu/) derived cortical thickness, and diffusion parameters (Fractional anisotropy, and mean diffusivity) to evaluate brain structural integrity. The preprocessing steps of the raw diffusion data were performed using FMRIB Software Library FSL (V5.0.9, https://fsl.fmrib.ox.ac.uk/fsl/fslwiki/), and included motion and quality evaluations. These steps were previously described in detail 18. In addition, diffusion data were corrected for eddy current-induced distortions and subject movements19. Fractional anisotropy, and mean diffusivity maps were obtained by fitting diffusion tensor model at each voxel using FSL-FDT toolbox.
PET-MR data were analyzed using the following methods: 1) whole brain voxel-wise analyses, 2) whole brain surface-based analyses20, and 3) regions of interest (ROIs).
FreeSurfer v6.0 tools were employed to create three composite ROIs. Anatomically, the ROIs included the precentral and paracentral gyri bilaterally. The first ROI is for the gray matter. The second ROI is for the subcortical white matter. The third ROI is combined for both gray and white matter. The first and second ROIs were used to study the difference in PET-MR measures between the study groups. The third ROI was used to conduct pearson correlation analyses between [11C]-PBR28, MR measures and the clinical data. Specifically, the T1 images were analyzed using FreeSurfer’s “recon-all” fully automated pipeline. This stream output merged atlas for the cortical and subcortical regions. The processed output data were carefully reviewed for quality assurance. FreeSurfer tools were used to create three ROIs for every subject as clarified above. Finally, PET-MR measures were computed within these ROIs.
In a separate analysis, the same three ROIs were created by processing the standard template MNI152-2mm in FreeSurfer v6.0 using the same steps above. The purpose of this analysis is to compute PET-MR measures from images in the standard space (i.e. from the same images used in the voxel-wise analyses). This analysis was employed specifically to confirm that brain atrophy had no impact of the registration of the PET images.
Statistical analyses
Whole brain voxel-wise analyses
Non-parametric permutation inference21 of SUVR data was performed by FSLv5.0.9 and used to study voxel-wise [11C]-PBR28 uptake differences between the groups. General linear model (GLM) was used in the whole brain voxel-wise analyses to adjust for the effect of age, sex and [11C]-PBR28 binding affinity. Multicollinearity in these analyses was avoided by a stepwise (forward addition and backward elimination) of covariates.
Surface-based analyses
The surface based analyses of cortical thickness and SUVR were performed in FreeSurfer v6.0 using the same pipeline. Specifically, both data were smoothed similarly using a full width at half maximum (FWHM) of 6mm, resampled onto the brain surfaces, and clusterwise corrected for multiple comparisons using Monte Carlo simulation. The analyses were set to keep clusters that have cluster wise p value (pcw< 0·01), and the voxel-wise/cluster forming threshold was Z=3 (p<0.001).
GLM was used in the whole brain surface-based analyses to adjust: 1) cortical thickness data for the effect of age and sex, and 2) SUVR data for the effect of age, sex and binding affinity, multicollinearity was avoided as previously clarified. Partial volume correction (PVC) for SUVR maps was performed in FreeSurfer v6.0 based on Muller-Gartner (MG) method22. The recommended stream according to literature published data23 is to feed these corrected SUVR maps into three group-level analyses: 1) surface-based for the left hemisphere, 2) surface-based for the right, and 3) volumetric analysis for subcortical gray matter using mask for this region automatically defined by FreeSurfer v6.0.
Whole brain voxel-wise correlation analyses
Whole brain voxel-wise correlation analyses were conducted to study the relationship between PET data and the clinical measures of UMNB and ALSFRS-R. Furthermore, fractional anisotropy was measured in 42 ALS participants within a combined ROI that include the gray matter and the underlying subcortical white matter of the precentral and paracentral gyri bilaterally, and then fed into a voxel-wise correlation analysis to investigate areas of correlation between fractional anisotropy and whole brain PET signal.
In all whole brain voxel-wise analyses, data were permuted (n=10000), threshold free cluster enhancement (TFCE) method was applied24, and the p values were family wise error (FWE) adjusted25 using an alpha value of p=0·05 to correct for multiple comparisons. All the voxel-wise analyses were adjusted for the number of contrasts used in these analyses.
Region of interest analyses
All statistical analyses of PET-MR measures within the composite ROIs including a comparison among the groups (ALS, PLS and controls), Pearson correlation analyses between SUVR and disease duration, rate of disease progression and a comparison between [11C]-PBR28 at the baseline and after six-month were all performed using JMP pro 13·0·0 (SAS Institute Inc., Cary, NC, 1989–2014). Nonparametric comparison for each pair was applied using the Wilcoxon test. Bonferroni method was used to correct for multiple tests.
Paired t test, sample size and power analyses
Based on the available longitudinal data of the ten ALS participants, we performed sample size and power calculations for a potential future single-arm clinical trial that implements [11C]-PBR28 as an outcome measure. The goal of this proposed trial is to compare the change in [11C]-PBR28 uptake in a region of interest that includes the precentral and paracentral gyri bilaterally between pre- and post- six-month of an experimental treatment.
To estimate the required sample size, we measured the difference in [11C]-PBR28 at the baseline and after six-month for each of the ten participants who completed the six-month follow up scan. We then estimated the standard deviation (SD) of the six-month [11C]-PBR28 change for these participants and used a paired t-test sample size calculation with a power of 80% and an alpha of 0·05.
Results
Demographics, and clinical data findings
Table 1 shows the demographic and clinical characteristics of all eighty-five study participants including ALS (n=53), PLS (n=11) and controls (n=21).
Table 1.
Demographic data and clinical assessment of participants (n=85)
| Patients with ALS (n=53) | Patients with PLS (n=11) | Healthy controls (n=21) | Longitudinal data (n=10) | ||
|---|---|---|---|---|---|
| baseline | Six-month | ||||
| Age (Years) | 53·07 (10·9) | 62·4 (8·4) | 47 (12· 9) | 54·9 (9·4) | 55·4 (9·5) |
| Sex (Female) | 21 | 4 | 12 | 4 | |
| [11C]-PBR genotype | |||||
| ALA/ALA (High) | 26 (49·1%) | 4 (40%) | 10 (47·6%) | 6 (6%) | |
| ALA/THR (Mixed) | 27 (50·9%) | 7 (60%) | 11 (52·4%) | 4 (4%) | |
| Disease duration (Months) | 26·1 (16·2) | 146 (57·2) | |||
| Rate of disease progression (Points/month) | 0·61 (0·48) | 0·19 (0·09) | |||
| Site of onset | |||||
| Limb (%) | 38 (71·7%) | 9 (80%) | 6 (%) | ||
| Bulbar (%) | 15 (28·3%) | 2 (20%) | 4 (40%) | ||
| ALSFRS-R (point) | 36·4 (6·12) | 28·7 (10·4) | 39·6 (3·8) | 36·4(4·5) | |
| UMNB (point) | 27·7 (5·9) | 31·5 (3·01) | 26·1 (4·7) | 26·2 (3·8) | |
| Vital Capacity (%) | 79·8 (21·4) | 82·8 (15·3) | 83·3 (19·7) | 79·4 (23·5) | |
Data are mean (SD) or n (%). ALSFRS-R = amyotrophic lateral sclerosis functional rating scale revised. ALS = amyotrophic lateral sclerosis. UMNB = upper motor neuron burden scale. PLS = primary lateral sclerosis. ALA = alanine. THR= threonine
Whole brain voxel-wise analyses
These analyses revealed increased [11C]-PBR28 uptake measured by mean SUVR in the cortical and subcortical regions of the motor cortices in ALS compared to controls (Fig 1A, B, D, pFWE=0·05 – 0.0002), and mainly in the subcortical white matter portions of the motor cortices in PLS compared to ALS (Fig 1A, C, F, pFWE= 0·05–0.0002). These findings did not change after adjusting for age, sex and [11C]-PBR28 binding affinity (Fig 1E, F, pFWE= 0·05–0.0002). There were no regions that showed difference in [11C]-PBR28 uptake between the groups in the other direction (i.e. HC> ALS, HC>PLS, or ALS>PLS).
Figure 1. Mean [11C]-PBR28 uptake for each group and voxel-wise analyses.

The mean SUVR images for 21 healthy controls HC (A), 53 ALS (B), and 11 PLS participants (C). Whole brain voxel-wise analyses between (53 ALS vs. 21 controls), and (53ALS vs. 11 PLS) revealed significantly (PFWE = 0·05–0.0001) higher [11C]-PBR28 uptake in the motor cortices in ALS compared to controls [without covariates (D), and with covariates (E)], and in PLS compared to ALS (F). All images were transformed into the standard space MNI152-1mm. (D, E) are shown at MNI coordinates (x = −8, y = −20, and z = +64), and (F) at (x = −10, y = −15, and z = +55). The color bar in A–C represents mean SUVR of [11C]-PBR28 uptake. The color bar (red to yellow) of the voxel-wise analyses (D–F) represents higher [11C]-PBR28 binding in ALS compared to controls, and in PLS compared to ALS. Video 1e web appendix shows 3D projection of the statistical maps (D–F) onto MNI152-2mm glass brain.
Surface-based analyses
The surface-based analyses with and without PVC (Fig 2A, B) confirmed that ALS participants have higher [11C]-PBR28 uptake in the precentral and paracentral gyri bilaterally compared to controls (Fig 2A, left and right pcw =0·0002). The mean[SD] of [11C]-PBR28 PET signal intensity in the significant clusters were (left: 1·17 [0·09]; right 1·084 [0·07]) in ALS, and (left: 1·019 [0·07]; right 1·016 [0·07]) in controls. These results revealed that this increase in [11C]-PBR28 signal largely co-localizes with cortical thinning in the same anatomical regions (Fig 2C, left pcw=0·001; right pcw=0·0001).
Figure 2. Surface-based analyses.

Surface-based analyses of SUVR and cortical thickness between (53 ALS vs. 21 controls), and (53ALS vs. 11 PLS) show increased [11C]-PBR28 uptake in the surfaces of the motor cortices of people with ALS compared to controls. Surface-based analysis of SUVR was employed without partial volume correction PVC (A) and with PVC based on Muller-Gartner method (B). This increase in [11C]-PBR28 uptake largely co-localizes with cortical thinning (C). Surface-based analysis of SUVR comparison (with/without PVC) between PLS and ALS showed no difference in [11C]-PBR28 uptake in the motor cortices (D), while cortical thickness is reduced in PLS compared to ALS (E). Surface-based analysis was set to keep clusters that have clusterwise p-values (pcw<0·01). The statistical maps are clusterwise corrected for multiple comparisons Z=3 (P<0.001), and overlaid by the pial surface model of the left and the right hemispheres. The color bar is logarithmic (-log10 [p-value]), where red [p=0·01] to yellow [p=0·00001] represents the degree of difference in [11C]-PBR28 uptake between the groups, and blue [p=0·01] to cyan [p=0·00001] defines the degree of difference in cortical thickness between the study groups.
No difference in [11C]-PBR28 uptake was detected between ALS and PLS on the cortical surfaces (Fig 2D, pcw=0·01), while cortical thickness was reduced in PLS compared to ALS (Fig 2E, left and right pcw =0·0001).
Whole brain voxel-wise correlation analyses
Whole brain voxel-wise correlations with [11C]-PBR28 uptake showed positive correlation with UMNB (Fig 3A, pFWE= 0·05–0.0002), negative correlation with ALSFRS-R fine motor domain (Fig 3B, pFWE= 0·05–0.0002), and negative correlation with fractional anisotropy (Fig 3C, pFWE= 0·05–0.0002). The voxel-wise correlation analysis between [11C]-PBR28 uptake and fractional anisotropy was conducted in 42 ALS participant because eleven ALS diffusion scans were excluded from the analyses due to motion artifacts.
Figure 3. Whole brain voxel-wise and ROI based Pearson correlation analyses.

Voxel-wise correlation analyses between whole brain SUVR vs UMNB in 53 ALS participants (A), whole brain SUVR vs ALSFRS-R fine motor domain (B), and whole brain SUVR vs fractional anisotropy – measured in the combined ROI (gray matter and subcortical white matter) (C). The significant (pFWE = 0·05–0.0001) regions are overlaid on the standard template MNI152-1mm. Data are shown at MNI coordinates (x = −8, y = −20, and z = +64). The color bar red to yellow represents positive correlation between [11C]-PBR28 binding and UMNB in ALS, and blue to cyan indicates negative correlation between [11C]-PBR28 binding and ALSFRS-R, and [11C]-PBR28 binding and fractional anisotropy, in ALS.
Pearson correlation analyses were employed to study the relationships between the PET-MR measures within the combined ROI (i.e. white and gray matter) and the clinical outcomes. The dashed lines in the Pearson correlations represent 95% confidence interval, and p value is (*Bonferroni adjusted [p = 0·05/3=0·016]).
Region of interest analyses
Pearson correlation analyses of [11C]-PBR28 uptake within the combined ROI (i.e. white and gray matter) revealed correlation with UMNB (Fig 3A, r= + 0·53; p<0·0001), fine motor domain of the ALSFRS-R (Fig 3B, r= − 0·33; p=0·01), and with fractional anisotropy (Fig 3C, r= − 0·56; p<0·0001). No correlations were detected between [11C]-PBR28 uptake and mean diffusivity, nor between [11C]-PBR28 uptake and the total ALSFRS-R score, ALS disease duration, or rate of disease progression.
The correlation between cortical thickness and [11C]-PBR28 uptake was performed in the gray matter ROI and it showed negative relationship (Fig 4, r= − 0·49; p=0·0002).
Figure 4.
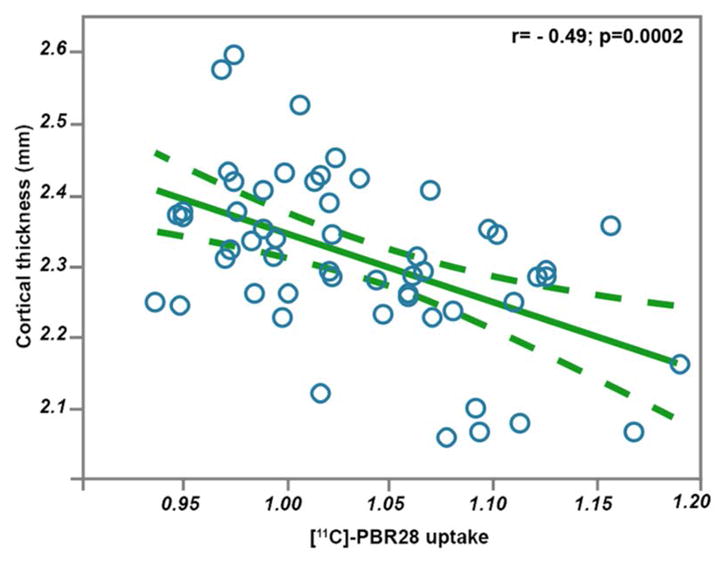
Pearson correlation analysis between cortical thickness and [11C]-PBR28 uptake in the motor cortices. This correlation is carried out in the native space of 53 ALS participants, within a combined ROI of the percental gyrus and the paracentral lobule. The dashed lines represent 95% confidence interval.
To study the distribution of [11C]-PBR28 uptake between the gray matter and subcortical white matter for each group (i.e. ALS, PLS and HC), PET signal was computed within the gray matter ROI, and the sub cortical white matter ROI for each participant. In the gray matter ROI, [11C]-PBR28 uptake was 0·0462 (4·6%) higher in ALS (p=0·0012), and 0·036 (3·6%) higher in PLS (p=0·12) compared to controls, and the gray matter uptake was only 0·011 (1·1%) higher in ALS compared to PLS (p=0·65) (Fig 5A). In the sub cortical white matter ROI, [11C]-PBR28 uptake was 0·075 (7·5%) higher in ALS (p<0·0001), and 0·136 (13·6%) higher in PLS (p<0·0001) compared to controls. The uptake was 0·059 (5·9%) higher in PLS compared to ALS (p=0·035). (Fig 5B)
Figure 5. Gray and white matter comparisons between ALS and PLS.

The regions of interest (ROIs) were derived from a FreeSurfer cortical reconstruction of the standard template MNI152-2mm. The box plots (controls: blue, ALS: orange; PLS: green) illustrates the difference between the groups in [11C]-PBR28 uptake, and mean diffusivity in the grey matter portions of the precentral and paracentral gyri (A) and [11C]-PBR28 uptake, fractional anisotropy, and mean diffusivity in the white matter portions for the same regions (B). The horizontal black line within each boxplot represents the median (the box contains median, 25th, and 75th percentiles). The dashed zero line is the mean of the three groups. The results of these comparisons between the groups are derived from a non-parametric Wilcoxon method for each pair. The significant difference between groups was set at p value (*Bonferroni adjusted [p = 0·05/6=0·0083]). Z scores were generated to improve visualization and standardize the scales.
The correlation between [11C]-PBR28 uptake measured within ROIs in the native space and [11C]-PBR28 uptake computed within ROIs in the standard space was (r=+0.96; p<0.0001). This correlation confirms that the registration method had no effect on the PET signal. The final results presented in Table 2 are reported from ROIs derived from the standard space.
Table 2.
Group comparisons in PET-MR measures within the gray and white matter portions of the ROI
| Region of interest | PET-MR measures | Patients with ALS (n=53) | Patients with PLS (n=11) | Healthy controls HC (n=21) | Between groups mean difference, 95% CI; p value | ||
|---|---|---|---|---|---|---|---|
| ALS vs HC | PLS vs HC | ALS vs PLS | |||||
| Gray matter | SUVR† | 1·05 (0·06) | 1·03 (0·07) | 0·99 (0·03) | 0·048, (0·019 to 0·077), 0·0012* | 0·037, (−0·0063 to 0·079), 0·15 | 0·011, (−0·026 to 0·050), 0·51 |
| MD†† | 0·74 (0·06) | 0·83 (0·10) | 0·72 (0·12) | 0.056, (0·02 to 0·09), 0·005* | 0.13, (0·09 to 0·18), 0·008* | 0.07, (0·02 to 0·09), 0·027 | |
| White matter | SUVR | 1·03 (0·07) | 1·08 (0·08) | 0·95 (0·04) | 0·14, (0·088 to 0·19), <0·0001* | 0·078, (0·044 to 0·11), <0·0001* | 0·022, (0·016 to 0·10), 0·035 |
| FA | 0·21 (0·03) | 0·19 (0·03) | 0·30 (0·04) | 0·06, (0·045 to 0·078), <0·0001* | 0·09, (0·062 to 0·11), 0·0002* | 0·025, (0·0051 to 0·04), 0·02 | |
| MD | 0·57 (0·05) | 0·06 (0·07) | 0·57 (0·08) | 0.01, (−0·024 to 0·045),0·012 | 0.07, (0·024 to 0·10), 0·0013* | 0.06, (0·021 to 0·10), 0·017 | |
Data are mean (SD), or between groups mean difference, 95% Confidence interval CI; and p values. The mean (SD) values are rounded up or down to the nearest second decimal. SUVR = [11C]-PBR28 standardized uptake value normalized by whole brain mean. ALS = Amyotrophic lateral sclerosis. PLS = Primary lateral sclerosis. HC = healthy control.
SUVR comparisons are between 53 ALS, 11 PLS and 21 healthy controls.
Fractional anisotropy and mean diffusivity comparisons are between 42 ALS, and 11 PLS 17 HC; the numeric values for mean diffusivity are adjusted to zero decimals (i.e. multiplied by 1000).
significant p value after Bonferroni adjustment
Comparing diffusion measures in the gray and white matter ROIs between the study groups revealed decreased fractional anisotropy and increased mean diffusivity in ALS compared to HC, in PLS compared to HC and in PLS compared to ALS (all p<0.05). (Fig 5A–B). Comparisons in the gray and white matter portions of fractional anisotropy and mean diffusivity between the groups are summarized in Table 2.
Paired t test, sample size and power analyses
No significant changes were detected in [11C]-PBR28 uptake, cortical thickness, or fractional anisotropy over six-month. Paired t-test indicated no significant change in the mean [SD] of [11C]-PBR28 uptake (baseline 1.037 [0.072] vs. six-month 1.038[0.057]; p=0.96) in ten ALS individuals. Pearson correlation analysis between (baseline-six months) [11C]-PBR28 uptake was (r= + 0·84; p= 0·0022). Whole-brain voxel-wise paired t-test showed no longitudinal changes in [11C]-PBR28 uptake in any brain region over six-month in ALS participants. Similarly, fractional anisotropy (r= + 0·95; p <0·0001) and cortical thickness (r=+0·84; p =0·0023) were strongly correlated between the visits despite disease progression measured by a change in mean [SD] of ALSFRS-R (baseline: 39·6 [3·8]; six-month 36·6 [4·6]), which corresponds to an ALSFRS-R rate of decline of 0·5 points/month (Fig 6).
Figure 6. Longitudinal changes in [11C]-PBR28 uptake and ALSFRS-R over six-month.

The dashed lines represent the change in [11C]-PBR28 uptake and ALSFRS-R between the baseline visit and the follow-up visit after six-month in ten ALS participants. The bold-blue lines represent the group mean. No significant change was detected in [11C]-PBR28 uptake over six-month. Pearson correlation analysis between [11C]-PBR28 uptake at the baseline and [11C]-PBR28 uptake after six-month was (r= + 0·84; p = 0·0022), although ALSFRS-R progressed (0·5 points/month).
The mean [SD] change between baseline and six-month in [11C]-PBR28 uptake for the ten ALS participants was 0·00142 [0·039]. Using the SD of the six-month absolute change we calculated that a sample size of 30 ALS participants will provide 0·80 power at an alpha of 0·05 to detect 0·0209 (2%) absolute change in [11C]-PBR28 uptake in the region of interest. Similarly, taking the SD of the percent change (baseline-six months) we calculated that the same sample size, power, and alpha could detect a 0·02 (2%) change in [11C]-PBR28 uptake in the region of interest.
Discussion
We followed an integrated [11C]-PBR28 PET-MR approach to characterize brain glial activation and its relationship with structural changes in people with ALS and PLS.
These current data confirm our earlier findings of elevated [11C]-PBR28 uptake in the motor cortices and subcortical white matter in people with ALS6,7. The increased glial activation measured by [11C]-PBR28 PET is seen in the same anatomical regions where we see cortical thinning and subcortical reduction in fractional anisotropy measured by MRI. All together, these molecular and structural imaging findings mirror the postmortem pathological changes of atrophy and increased active astrocytes and microglia in the cortical motor regions in ALS. In addition, [11C]-PBR28 uptake is increased in the temporal lobe without cortical thinning (Fig 2A). This could represent subclinical changes related to known association between ALS and frontotemporal dementia, or may be related to early [11C]-PBR28 uptake preceding atrophy in the temporal lobe, or could be due to different sensitivity levels between [11C]-PBR28 and cortical thickness measurements.
These findings are in line with earlier pioneer studies that utilized [11C] -PK11195 and [18F]-DPA714 as glial markers26,27. Compared to these earlier efforts, the current study enrolled, prominently, larger number of participants (53 ALS, 11 PLS and 21 HC) with longitudinal data collected from ten ALS participants, and direct MRI and clinical correlates. Whereas all the previous studies did not include longitudinal data and the sample sizes were smaller having included roughly ten ALS participants. In addition, the findings of decreased fractional anisotropy and increased mean diffusivity in ALS and PLS compared to HC were consistent with prior reports28,29. These diffusion changes probably represent the loss of gray and white matter integrity in the motor regions in ALS and PLS. Mean diffusivity measures were used to evaluate gray matter integrity in other neurodegenerative diseases30–34. The diffusion results (i.e. increased diffusivity and decreased fractional anisotropy) are indicators of the neuronal damage seen in ALS and PLS. However, more interestingly, is the negative relationship between fractional anisotropy and [11C]-PBR28 uptake in the whole brain voxel-wise correlation analysis. This relationship suggests that the neuronal damage in ALS and PLS maybe caused directly by the inflammatory products of the activated glial cells, or the other way around the injured tissues are the trigger of glial activation.
The increased [11C]-PBR28 uptake in the motor cortices is also clinically relevant. Considering that brain imaging is largely focused on studying the UMN component of ALS and PLS, it is reasonable to hypothesize that cortical glial activation will correlate mostly with UMN signs. This was reflected by the strong correlation between [11C]-PBR28 uptake in the motor cortices and the UMNB scale. On the other hand, the ALSFRS-R is probably less affected by UMN dysfunction and is more impacted by the lower motor neuron (LMN) component of ALS represented by muscle atrophy and weakness. This could explain the weaker correlations between ALSFRS-R and [11C]-PBR28 uptake in the motor cortices.
Similarly, the lack of correlation between [11C]-PBR28 uptake and rate of disease progression could be related to the fact that disease progression is predominantly driven by LMN degeneration. In this context, spinal cord [11C]-PBR28 imaging is probably a better tool to assess LMN degeneration in ALS. We recognize that the imaging tools for spinal cord studies may not be very well developed at this point and further research is needed in this area.
Compared to ALS, people with PLS show a distinct pattern of [11C]-PBR28 uptake that is higher and predominantly located in the subcortical white matter. This may be related to longer disease duration, or worse functional status compared to ALS. It is also possible that PLS is fundamentally a different disease than ALS with more white matter involvement.
This study cannot prove whether people with PLS have higher glial activation at the early stages of the disease as a ‘load’, or if they accumulate more glial activation over time. The appropriate study design to address this question would be to offer [11C]-PBR28 imaging to early pure UMN participants, who will be followed clinically to see if early [11C]-PBR28 uptake patterns can predict conversion to ALS or PLS phenotypes. Considering the favorable prognosis of PLS, developing such diagnostic tools that can identify PLS patients earlier than the current four years’ clinical requirement would have a considerable impact on prognosis and care for these patients.
The timelines for [11C]-PBR28 uptake in ALS patients remain unknown. One may assume that [11C]-PBR28 uptake is normal pre-symptomatically then increases at some point before, or at the time of symptom onset. The longitudinal data demonstrate that [11C]-PBR28 uptake is relatively stable over six-month, which could suggest that the uptake may plateau shortly after symptom onset. This pattern mirrors amyloid beta changes measured by Pittsburg compound B (PiB) PET showing a steep increase at the time of mild cognitive impairment followed by a plateau when patients develop clinical Alzheimer’s disease (AD)34. Unlike amyloid beta uptake, the longitudinal changes of [11C]-PBR28 uptake correlate with AD progression after a median follow-up of 2·7 years35, and similar finding could be expected in ALS with a shorter follow up.
In our data, the stability of [11C]-PBR28 uptake over six-month could be the result of biased selection of people with slow ALS progression rate (0·5 points/month), and this is almost 50% slower than the average in ALS clinical trials. The selection of slow progressors may have obscured an increase in [11C]-PBR28 over six-month. Larger longitudinal studies that enroll people with faster disease progression are needed to fully answer this question.
We see [11C]-PBR28-PET as a promising tool for future phase I and II clinical trials in ALS. It can be used as one of the cohort enrichment strategies that will allow selecting participants with high levels of brain inflammation who are more likely to respond to a specific treatment.
In addition, [11C]-PBR28-PET can provide an in vivo proof of the biological activity of experimental treatments, which can help with dose selection in phase 1b ALS trials. A simulated sample size and power calculations for a hypothetical ALS single-arm clinical trial based on the current data revealed that 30 participants are needed to show a 0·0209 (2%) reduction in [11C]-PBR28 uptake, as compared to over 400 participants that would be needed to show a 0·30 (30%) reduction of ALSFRS-R slope. These calculations suggest that implementing [11C]-PBR28-PET could improve the efficiency of ALS drug development, and help screen more promising treatments in people.
The strengths of this study are the inclusion of large number of participants, the use of an advanced integrated PET-MR scanner, and the implementation of fully automated neuroimaging processing pipelines that can be scaled up, and used at other imaging centers. This study however has several limitations. One limitation is that a priori sample size calculation was not conducted and we consider these results as exploratory. Another limitation is that [11C]-PBR28 does not distinguish microglia from astrocytes, or differentiate different microglial phenotypes. This study did not correct diffusion data (specifically mean diffusivity) for partial volume effects. However, there is still no optimal approach that can be applied. In this regard, our study and all prior studies published in the literature36–38 are considered preliminary.
In this study, we elected to quantify [11C]-PBR28-PET signal using a simplified ratio metric (SUVR), instead of performing full kinetic modeling using radio metabolite-corrected arterial input function modeling. The SUVR approach is less invasive but more scalable to multiple center studies. Our previous work suggests that SUVR and volume of distribution (VT), computed using metabolite-corrected input function, have similar sensitivity to detect group differences between ALS and healthy volunteers39. In addition, prior published data have shown that it has moderate to high reliability, and it has comparable agreement with full kinetic modeling approaches40. However, while semi quantitative methods have several advantages, they are not immune from criticisms41 and not considered as gold standard. Therefore, future studies employing kinetic modeling will be needed to provide additional corroboration to our results.
Finally, scaling up [11C]-PBR28-PET imaging by validating and replicating these results at multiple centers would be key before it can be effectively implemented in multicenter phase II ALS trials.
Conclusion
[11C]-PBR28 uptake is increased in disease relevant regions in people with ALS and PLS, co-localizes with structural abnormalities, and correlates with relevant clinical measures. [11C]-PBR28 uptake is stable over six-month in slow ALS progressors. [11C]-PBR28 PET is a promising candidate molecular biomarker to measure the impact of experimental treatments on glial activation in future ALS clinical trials.
Supplementary Material
Acknowledgments
We thank our patients and their families for their kind contribution to research on amyotrophic and primary lateral sclerosis. We also thank members of the Martinos Center for Biomedical Imaging radio pharmacy team and the NMR technicians Grae Arabasz, Shirley Hsu, and Regan Butterfield for their hard work, dedication, and support. This study was funded by Harvard Neuro-Discovery Center. The American Academy of Neurology, The Anne Young Fellowship award, The Spastic Paraplegia Foundation, and K23NS083715 from NINDS.
Abbreviations
- ALS
amyotrophic lateral sclerosis
- PLS
Primary lateral sclerosis
- ALSFRS-R
ALS Functional Rating Scale–Revised
- UMNB
Upper Motor Neuron Burden Scale
- SUVR
standardized uptake value ratio
- TSPO
translocator protein
- PVC
Partial volume correction
- GLM
General linear model
- ROI
Region of interest
- TFCE
threshold free cluster enhancement
- FWE
family wise error
Footnotes
Author Contributions:
Conception and design of the study: MA, NZ, ML, JH, NA
Acquisition and analysis of data: MA, NA, ML, PC, BR, OP, DC, DG, CM, CC, JC, SB, SP, JH, NA
Drafting the manuscript and/or preparing the figures: MA, NZ, ML, NA
Potential conflict of interest:
No conflicts to report.
References
- 1.Butovsky O, Siddiqui S, Gabriely G, et al. Modulating inflammatory monocytes with a unique microRNA gene signature ameliorates murine ALS. J Clin Invest. 2012;122(9):3063–3087. doi: 10.1172/JCI62636. [DOI] [PMC free article] [PubMed] [Google Scholar]
- 2.Sargsyan SA, Monk PN, Shaw PJ. Microglia as potential contributors to motor neuron injury in amyotrophic lateral sclerosis. Glia. 2005;51(4):241–253. doi: 10.1002/glia.20210. [DOI] [PubMed] [Google Scholar]
- 3.Boillee S, Yamanaka K, Lobsiger CS, et al. Onset and progression in inherited ALS determined by motor neurons and microglia. Science. 2006;312(5778):1389–1392. doi: 10.1126/science.1123511. [DOI] [PubMed] [Google Scholar]
- 4.Brettschneider J, Toledo JB, Van Deerlin VM, et al. Microglial activation correlates with disease progression and upper motor neuron clinical symptoms in amyotrophic lateral sclerosis. PLoS One. 2012;7(6):e39216. doi: 10.1371/journal.pone.0039216. [DOI] [PMC free article] [PubMed] [Google Scholar]
- 5.Henkel JS, Beers DR, Siklos L, Appel SH. The chemokine MCP-1 and the dendritic and myeloid cells it attracts are increased in the mSOD1 mouse model of ALS. Mol Cell Neurosci. 2006;31(3):427–437. doi: 10.1016/j.mcn.2005.10.016. [DOI] [PubMed] [Google Scholar]
- 6.Zurcher NR, Loggia ML, Lawson R, et al. Increased in vivo glial activation in patients with amyotrophic lateral sclerosis: Assessed with [(11)C]-PBR28. Neuroimage Clin. 2015;7:409–414. doi: 10.1016/j.nicl.2015.01.009. [DOI] [PMC free article] [PubMed] [Google Scholar]
- 7.Alshikho MJ, Zurcher NR, Loggia ML, et al. Glial activation colocalizes with structural abnormalities in amyotrophic lateral sclerosis. Neurology. 2016;87(24):2554–2561. doi: 10.1212/WNL.0000000000003427. [DOI] [PMC free article] [PubMed] [Google Scholar]
- 8.Rupprecht R, Papadopoulos V, Rammes G, et al. Translocator protein (18 kDa) (TSPO) as a therapeutic target for neurological and psychiatric disorders. Nat Rev Drug Discov. 2010;9(12):971–988. doi: 10.1038/nrd3295. [DOI] [PubMed] [Google Scholar]
- 9.Brown AK, Fujita M, Fujimura Y, et al. Radiation dosimetry and biodistribution in monkey and man of 11C-PBR28: A PET radioligand to image inflammation. J Nucl Med. 2007;48(12):2072–2079. doi: 10.2967/jnumed.107.044842. [DOI] [PubMed] [Google Scholar]
- 10.Lavisse S, Guillermier M, Herard AS, et al. Reactive astrocytes overexpress TSPO and are detected by TSPO positron emission tomography imaging. J Neurosci. 2012;32(32):10809–10818. doi: 10.1523/JNEUROSCI.1487-12.2012. [DOI] [PMC free article] [PubMed] [Google Scholar]
- 11.Owen DR, Yeo AJ, Gunn RN, et al. An 18-kDa translocator protein (TSPO) polymorphism explains differences in binding affinity of the PET radioligand PBR28. J Cereb Blood Flow Metab. 2012;32(1):1–5. doi: 10.1038/jcbfm.2011.147. [DOI] [PMC free article] [PubMed] [Google Scholar]
- 12.Brooks BR, Miller RG, Swash M, Munsat TL World Federation of Neurology Research Group on Motor Neuron Diseases. El escorial revisited: Revised criteria for the diagnosis of amyotrophic lateral sclerosis. Amyotroph Lateral Scler Other Motor Neuron Disord. 2000;1(5):293–299. doi: 10.1080/146608200300079536. [DOI] [PubMed] [Google Scholar]
- 13.Pringle CE, Hudson AJ, Munoz DG, Kiernan JA, Brown WF, Ebers GC. Primary lateral sclerosis. clinical features, neuropathology and diagnostic criteria. Brain. 1992;115(Pt 2):495–520. doi: 10.1093/brain/115.2.495. [DOI] [PubMed] [Google Scholar]
- 14.Owen D, Owain W, Tang S, et al. Two binding sites for 3H]PBR28 in human brain: Implications for TSPO PET imaging of neuroinflammation. Blood Flow Metab. 2010;30:1608–18. doi: 10.1038/jcbfm.2010.63. [DOI] [PMC free article] [PubMed] [Google Scholar]
- 15.Cedarbaum JM, Stambler N, Malta E, et al. The ALSFRS-R: A revised ALS functional rating scale that incorporates assessments of respiratory function. BDNF ALS study group (phase III) J Neurol Sci. 1999;169(1–2):13–21. doi: 10.1016/s0022-510x(99)00210-5. [DOI] [PubMed] [Google Scholar]
- 16.Imaizumi M, Kim HJ, Zoghbi SS, et al. PET imaging with [11C]PBR28 can localize and quantify upregulated peripheral benzodiazepine receptors associated with cerebral ischemia in rat. Neurosci Lett. 2007;411(3):200–205. doi: 10.1016/j.neulet.2006.09.093. [DOI] [PubMed] [Google Scholar]
- 17.Izquierdo-Garcia D, Hansen AE, Forster S, et al. An SPM8-based approach for attenuation correction combining segmentation and nonrigid template formation: Application to simultaneous PET/MR brain imaging. J Nucl Med. 2014;55(11):1825–1830. doi: 10.2967/jnumed.113.136341. [DOI] [PMC free article] [PubMed] [Google Scholar]
- 18.Yendiki A, Koldewyn K, Kakunoori S, Kanwisher N, Fischl B. Spurious group differences due to head motion in a diffusion MRI study. Neuroimage. 2013;88C:79–90. doi: 10.1016/j.neuroimage.2013.11.027. [DOI] [PMC free article] [PubMed] [Google Scholar]
- 19.Andersson JL, Sotiropoulos SN. An integrated approach to correction for off-resonance effects and subject movement in diffusion MR imaging. Neuroimage. 2016;125:1063–1078. doi: 10.1016/j.neuroimage.2015.10.019. [DOI] [PMC free article] [PubMed] [Google Scholar]
- 20.Dale A, Fischl B, Sereno M. Cortical surface-based analysis. I Segmentation and surface reconstruction. Neuroimage. 1999;9:179–94. doi: 10.1006/nimg.1998.0395. [DOI] [PubMed] [Google Scholar]
- 21.Winkler AM, Ridgway GR, Webster MA, Smith SM, Nichols TE. Permutation inference for the general linear model. Neuroimage. 2014;92:381–397. doi: 10.1016/j.neuroimage.2014.01.060. [DOI] [PMC free article] [PubMed] [Google Scholar]
- 22.Muller-Gartner HW, Links JM, Prince JL, et al. Measurement of radiotracer concentration in brain gray matter using positron emission tomography: MRI-based correction for partial volume effects. J Cereb Blood Flow Metab. 1992;12(4):571–583. doi: 10.1038/jcbfm.1992.81. [DOI] [PubMed] [Google Scholar]
- 23.Greve DN, Salat DH, Bowen SL, et al. Different partial volume correction methods lead to different conclusions: An (18)F-FDG-PET study of aging. Neuroimage. 2016;132:334–343. doi: 10.1016/j.neuroimage.2016.02.042. [DOI] [PMC free article] [PubMed] [Google Scholar]
- 24.Smith SM, Nichols TE. Threshold-free cluster enhancement: Addressing problems of smoothing, threshold dependence and localisation in cluster inference. Neuroimage. 2009;44(1):83–98. doi: 10.1016/j.neuroimage.2008.03.061. [DOI] [PubMed] [Google Scholar]
- 25.Nichols TE, Holmes AP. Nonparametric permutation tests for functional neuroimaging: A primer with examples. Hum Brain Mapp. 2002;15(1):1–25. doi: 10.1002/hbm.1058. [DOI] [PMC free article] [PubMed] [Google Scholar]
- 26.Turner MR, Cagnin A, Turkheimer FE, et al. Evidence of widespread cerebral microglial activation in amyotrophic lateral sclerosis: An [11C](R)-PK11195 positron emission tomography study. Neurobiol Dis. 2004;15(3):601–609. doi: 10.1016/j.nbd.2003.12.012. [DOI] [PubMed] [Google Scholar]
- 27.Corcia P, Tauber C, Vercoullie J, et al. Molecular imaging of microglial activation in amyotrophic lateral sclerosis. PLoS One. 2012;7(12):e52941. doi: 10.1371/journal.pone.0052941. [DOI] [PMC free article] [PubMed] [Google Scholar]
- 28.Iwata NK, Kwan JY, Danielian LE, et al. White matter alterations differ in primary lateral sclerosis and amyotrophic lateral sclerosis. Brain. 2011;134(Pt 9):2642–2655. doi: 10.1093/brain/awr178. [DOI] [PMC free article] [PubMed] [Google Scholar]
- 29.Schimrigk SK, Bellenberg B, Schluter M, et al. Diffusion tensor imaging-based fractional anisotropy quantification in the corticospinal tract of patients with amyotrophic lateral sclerosis using a probabilistic mixture model. AJNR Am J Neuroradiol. 2007;28(4):724–730. [PMC free article] [PubMed] [Google Scholar]
- 30.Kim HJ, Kim SJ, Kim HS, et al. Alterations of mean diffusivity in brain white matter and deep gray matter in parkinson’s disease. Neurosci Lett. 2013;550:64–68. doi: 10.1016/j.neulet.2013.06.050. [DOI] [PubMed] [Google Scholar]
- 31.Weston PS, Simpson IJ, Ryan NS, Ourselin S, Fox NC. Diffusion imaging changes in grey matter in alzheimer’s disease: A potential marker of early neurodegeneration. Alzheimers Res Ther. 2015;7(1):47-015-0132-3. doi: 10.1186/s13195-015-0132-3. eCollection 2015. [DOI] [PMC free article] [PubMed] [Google Scholar]
- 32.Chiapponi C, Piras F, Piras F, Fagioli S, Caltagirone C, Spalletta G. Cortical grey matter and subcortical white matter brain microstructural changes in schizophrenia are localised and age independent: A case-control diffusion tensor imaging study. PLoS One. 2013;8(10):e75115. doi: 10.1371/journal.pone.0075115. [DOI] [PMC free article] [PubMed] [Google Scholar]
- 33.Henf J, Grothe MJ, Brueggen K, Teipel S, Dyrba M. Mean diffusivity in cortical gray matter in alzheimer’s disease: The importance of partial volume correction. Neuroimage Clin. 2017;17:579–586. doi: 10.1016/j.nicl.2017.10.005. [DOI] [PMC free article] [PubMed] [Google Scholar]
- 34.Perrin RJ, Fagan AM, Holtzman DM. Multimodal techniques for diagnosis and prognosis of alzheimer’s disease. Nature. 2009;461(7266):916–922. doi: 10.1038/nature08538. [DOI] [PMC free article] [PubMed] [Google Scholar]
- 35.Kreisl WC, Lyoo CH, Liow JS, et al. (11)C-PBR28 binding to translocator protein increases with progression of alzheimer’s disease. Neurobiol Aging. 2016;44:53–61. doi: 10.1016/j.neurobiolaging.2016.04.011. [DOI] [PMC free article] [PubMed] [Google Scholar]
- 36.Cherubini A, Peran P, Spoletini I, et al. Combined volumetry and DTI in subcortical structures of mild cognitive impairment and alzheimer’s disease patients. J Alzheimers Dis. 2010;19(4):1273–1282. doi: 10.3233/JAD-2010-091186. [DOI] [PubMed] [Google Scholar]
- 37.Koo BB, Hua N, Choi CH, Ronen I, Lee JM, Kim DS. A framework to analyze partial volume effect on gray matter mean diffusivity measurements. Neuroimage. 2009;44(1):136–144. doi: 10.1016/j.neuroimage.2008.07.064. [DOI] [PubMed] [Google Scholar]
- 38.Kantarci K, Petersen RC, Boeve BF, et al. DWI predicts future progression to alzheimer disease in amnestic mild cognitive impairment. Neurology. 2005;64(5):902–904. doi: 10.1212/01.WNL.0000153076.46126.E9. [DOI] [PMC free article] [PubMed] [Google Scholar]
- 39.Albrecht DS, Normandin MD, Shcherbinin S, et al. Pseudo-reference regions for glial imaging with 11C-PBR28: Investigation in two clinical cohorts. J Nucl Med. 2017 doi: 10.2967/jnumed.116.178335. [DOI] [PMC free article] [PubMed] [Google Scholar]
- 40.Lyoo CH, Ikawa M, Liow JS, et al. Cerebellum can serve as a pseudo-reference region in alzheimer disease to detect neuroinflammation measured with PET radioligand binding to translocator protein. J Nucl Med. 2015;56(5):701–706. doi: 10.2967/jnumed.114.146027. [DOI] [PMC free article] [PubMed] [Google Scholar]
- 41.Lammertsma AA. Forward to the past: The case for quantitative PET imaging. J Nucl Med. 2017;58(7):1019–1024. doi: 10.2967/jnumed.116.188029. [DOI] [PubMed] [Google Scholar]
Associated Data
This section collects any data citations, data availability statements, or supplementary materials included in this article.