

Summary
Objective
This 12‐month randomized, non‐inferiority clinical trial sought to determine the impact of consuming soy protein as part of an energy‐restricted, high‐protein diet on weight loss, body composition and cardiometabolic health.
Methods
Seventy‐one adults (58 female) with overweight or obesity (body mass index: 32.9 ± 3.6 kg m−2) were randomly assigned to consume three servings of soy (S) or non‐soy (NS) protein foods per day for 12 months. All participants completed a group‐based behavioural weight loss program lasting 4 months (M4), and follow‐up assessments were completed at month 12 (M12).
Results
Body weight was reduced in both groups at M4 (S: −7.0% ± 5.2%, NS: −7.1% ± 5.7%) and M12 (S: 3.6% ± 5.1%, NS: −4.8% ± 7.3%). Body weight reductions (mean difference [90% confidence interval]) were not different between S and NS at either time point (M4: −0.16% [−1.4, 3.6], P = 0.90; M12: 1.1% [−1.4, 3.6], P = 0.44). Differences in body fat mass loss were not different between S and NS at M4 (0.29 ± 0.84 kg, P = 0.73) or M12 (0.78 ± 1.5 kg, P = 0.59). Weight loss‐induced improvements in cholesterol, triglycerides and blood pressure did not differ between S and NS.
Conclusion
These results indicate that soy‐based protein foods can be effectively incorporated into an energy‐restricted, high‐protein diet for improving body weight, body composition and cardiometabolic health.
Keywords: Body composition, dietary protein, obesity, weight loss
Introduction
Higher protein (HP) diets may help with weight loss by increasing satiety, increasing energy expenditure and promoting greater loss of fat vs. fat‐free mass compared with lower or normal protein diets that provide dietary protein at or near the current Recommended Daily Allowance of 0.8 g of protein per kg of body weight 1, 2, 3, 4. It was previously reported that a HP diet that included lean beef was as effective as a HP diet without beef in producing weight loss while preserving fat free mass and improving cardiometabolic health 5. Whether weight loss is impacted by the source of protein has not be exhaustively studied, and some evidence indicates that proteins from animal vs. plant sources may differentially impact appetite and eating behaviour 6.
Some previous studies have investigated the impact of animal vs. plant‐based HP diets on weight loss, appetite and ingestive behaviour, and cardiovascular disease risk factors 7, 8, 9, 10. In general, findings from these studies support a broadly beneficial impact of HP diets with limited differences between animal‐based and plant‐based diets 7. Interest in plant‐based diets, however, is on the rise as evidenced by the 2015–2020 Dietary Guidelines for Americans, which call for an increase in the consumption and variety of vegetables and protein foods including soy products 11. Therefore, more studies are warranted to investigate the potential impact of using non‐animal protein sources to meet dietary protein intakes, especially for HP diets for weight loss. Such findings would provide individuals with greater dietary flexibility for following HP diets, which are common for weight management.
Soy foods are a uniquely rich source of high quality protein and bioactive plant compounds that have been studied for their association with cardiometabolic health ranging from improvements in blood lipid profiles to preferential reductions in body fat 12, 13, 14, 15. Short‐term studies have also found that soy proteins elicit similar satiety and appetite‐related hormone responses as animal‐based proteins 6, which supports the potential role of consuming soy proteins as part of a HP diet for weight loss. Limited data, however, are available concerning the impact of HP diets containing large amounts of soy on weight loss and its effects on key biomarkers of cardiometabolic health. Soy protein represents a potentially attractive plant‐based protein for research because it is generally regarded as the highest quality plant protein 16. This research is particularly important for vegetarians and/or vegans, who may experience greater difficulty in adhering to HP diets due to fewer dietary protein options compared with those following an omnivorous diet. The primary aim of this trial was to evaluate and compare the effectiveness of incorporating soy protein‐based foods compared with other proteins into high‐protein diets for weight loss. Secondary aims were to assess whether soy protein foods consumed as part of an energy‐restricted, HP diet influenced changes in body composition or cardiometabolic health.
Unlike trials designed to test superiority of a treatment compared with a placebo or control group, non‐inferiority trials are designed to test the comparative effectiveness of a new intervention or treatment and established intervention or treatment options 17. Increasing emphasis has been placed on the use of non‐inferiority designs because assigning patients to a placebo can often be unethical, costly and potentially unnecessary given the research question at hand. This study was thus designed as a non‐inferiority trial to evaluate and compare two active dietary treatment arms for their effectiveness in promoting weight loss. It was hypothesized that weight change at the end of a 4‐month comprehensive weight loss program would not differ (defined by a non‐inferiority margin of ∆ ≤ 3%) between HP diets with soy or non‐soy proteins.
Methods
Participants
Eighty‐five individuals were recruited from the Denver, CO metropolitan area to participate in this randomized weight loss trial. Participants were first screened by phone based on the following inclusion criteria: men and women aged 18–55 years, body mass index (BMI) 27–40 kg m−2, weight stable (∆ ≤ 4.5 kg in last 3 months), generally healthy, able to progress in an exercise program up to 70 min 6 d per week at a moderate intensity. Subjects also had to be willing and able to participate in group classes held once per week for 16 consecutive weeks and willing to participate in five study visits (screening, baseline, month 4 [M4], month 8 and month 12 [M12]) over the study period. All study visits and group weight loss classes were conducted at the University of Colorado Anschutz Health and Wellness Center in Aurora, CO, between February 2015 and October 2016. All protocols were reviewed and approved by the Western Institutional Review Board (Olympia, WA). Participants provided written informed consent and received a monetary stipend for participating in the study.
Experimental design
A non‐blinded, two‐arm, block randomized controlled trial was used to investigate the relative efficacy of consuming soy vs. non‐soy protein foods as part of a HP diet consumed during 4 months of voluntary weight loss and 8 months of weight loss maintenance. All participants participated in the State of Slim (SOS) weight management program, which is a 16‐week group‐based, lifestyle modification program 5, 18. The SOS program consisted of weekly classes of 20 participants that were stratified by diet assignment. A copy of the SOS book and access to the online SOS community were provided to all participants. Participants were randomly assigned to one of two experimental diets: a HP including three daily soy protein products (S) or a HP diet that was restricted in soy protein products (NS).
Diet intervention
The SOS diet plan is HP, low in fat and emphasizes non‐starchy (i.e. vegetable) and whole‐grain carbohydrates. Protein foods throughout the entire SOS program are lean and minimally processed (i.e. lean meat and poultry, fish, egg whites and fat‐free dairy). The diet plan is structured into three distinct phases with phase‐specific food choices from which participants can chose to eat in defined portions rather than counting calories. Prescribed food lists, portion sizes for the SOS diet plan and additional details of the SOS weight management program have been published previously 5. All participants were provided with a SOS book and instructed to select foods from the list for each diet phase with additional group‐specific instructions as described in the succeeding texts. Participants assigned to S were provided with three pre‐made, soy protein food products to consume each day for the duration of the 12‐month study period. These soy products consisted of a packet of protein powder, a protein bar and a frozen protein patty (similar to a sausage patty). The SOS program recommends consuming a five to six meals per day with a serving at each meal. Thus, participants assigned to S were given enough soy protein products to provide 50–60% of their prescribed daily protein intake. The remaining 40–50% of dietary protein was to be self‐chosen from the SOS food lists provided in the book, which includes both animal‐based and vegetarian dietary protein options. Participants assigned to NS were asked to consume three servings of self‐selected soy‐free protein products each day for the duration of the study period. NS participants were given monetary stipends at baseline, M4 and month 8 study visits to purchase soy‐free, SOS‐approved protein powders and bars.
Following the completion of the 16‐week SOS program and M4 testing day, participants initiated the 8‐month weight loss maintenance phase of the study. The following recommendations for weight loss maintenance were given during weeks 15 and 16 of the SOS program: (1) eat high quality foods most of the time (i.e. follow Phase 3 of the dietary program 80% of the time); (2) keep your activity level high (i.e. 70 min d−1 and 6 d week−1); (3) weigh yourself every day; (4) set a ‘take action’ weight (i.e. a weight at which one would re‐engage weight loss efforts); and (5) be a role model. No additional touchpoints or interventions were made during the maintenance period of the study outside of on‐site study assessments at months 8 and 12 and the in‐person distribution of additional soy products at months 6 and 10.
Because the hypothesis was that weight loss would be similar between the S and NS groups, a non‐inferiority research design was used. The primary outcome was change in body weight at the end of weight loss (M4). A non‐inferiority margin of 3% was set for the upper bound of the confidence interval (CI) for the mean difference in per cent weight loss between the two study arms (soy–non‐soy). This margin was chosen based on variation seen in delivering SOS weight management programs to over 1,000 subjects over the past 18 months. Differences in the taste, product selection and appearance of recommended and/or supplied protein sources precluded blinding the study. Secondary outcomes included weight loss maintenance at M12 and changes in body and trunk composition, blood glucose, blood urea nitrogen (BUN), C‐reactive protein (CRP), lipids, blood pressure and physical activity (total metabolic equivalents [METs] per week) at M4 and M12. This study was registered on http://ClinicalTrials.gov (NCT02380963).
Dietary compliance
Body weight, total daily protein consumption (average number of protein servings per day) and supplemental protein consumption (average number of supplemental soy or non‐soy protein servings per day) were used to collectively assess adherence to the dietary protocol. Protein consumption was tracked via daily dietary recall logs collected weekly during the 4‐month weight loss phase and twice during the maintenance phase (months 8 and 12). Compliance data are summarized as total protein servings per week and total soy protein servings per week compared between groups for total protein and cohorts for soy protein. Fasting BUN is known to change with altered protein intakes 19 and was used as a crude marker of dietary protein consumption to corroborate self‐reported protein intake.
Body weight and composition
Fasting body weight was assessed in light clothing, with no shoes using a Befour PS6600 calibrated digital scale (Befour, Inc., Saukville, WI, USA). Body composition and body fat distribution were assessed via dual X‐ray absorptiometry using a Hologic Discovery QDR Series unit running APEX software version 4.5 (Hologic, Bedford, MA, USA).
Blood pressure
Blood pressure was assessed manually using a sphygmomanometer. Subjects were asked to sit for 5 min prior to the reading, and measurement was taken with legs uncrossed. The back and arm were supported during the measurement, and the same arm was used at each study visit.
Blood analyses
Blood samples were collected in the fasted state during each on‐site assessment and analysed for a basic metabolic panel (including glucose and BUN), CRP and lipids. For the baseline and M4 study visits, lipids were measured using the Vertical Auto Profile (VAP) test that provided direct analysis of lipoproteins via vertical density‐gradient ultracentrifugation followed by the assessment of cholesterol distribution (Atherotech, Birmingham, AL, USA) 20. The VAP method was substituted with the LipoProfile nuclear magnetic resonance spectroscopy test (ARUP Laboratories, Salt Lake City, UT, USA) for subsequent study visits due to a manufacturer discontinuation of the patented VAP procedure in February of 2016.
Per the appropriate testing protocol, blood samples were collected into red top 6 mL CAT tubes or gold top 5 mL SST tubes, allowed to clot for 60 min at room temperature and centrifuged for 15 min at 1.3 relative centrifugal force and 20°C. Samples for obtaining plasma were collected in heparin‐containing 4.5 mL PST tubes and immediately spun for 15 min at 2.2 relative centrifugal force and 20°C. All blood samples were analysed at the University of Colorado Hospital Authority Clinical Laboratory in Aurora, CO.
Physical activity
Physical activity levels were assessed as total METs of task per week using the International Physical Activity Questionnaire (IPAQ). The validated long format of the IPAQ is designed to assess self‐reported physical activity across six activity domains (occupational, transport, yard/garden, household, leisure/volitional exercise and sitting). Self‐reported pace is reported as an estimate of exercise intensity, which is then used to convert reported activity minutes into MET estimates 21.
Statistical analyses
Study data were collected and managed using REDCap electronic data capture tools hosted at University of Colorado – Anschutz Medical Campus. REDCap (Research Electronic Data Capture) is a secure, web‐based application designed to support data capture for research studies, providing (1) an intuitive interface for validated data entry; (2) audit trails for tracking data manipulation and export procedures; (3) automated export procedures for seamless data downloads to common statistical packages; and (4) procedures for importing data from external sources 22.
This study was powered on the intent‐to‐treat (ITT) analysis of detecting non‐inferiority of soy protein foods to non‐soy protein foods with an a priori non‐inferiority margin of ∆ ≤ 3% for relative weight change. To detect non‐inferiority using a one‐sided test, a sample size of 30 participants per arm was indicated for 80% power at 5% significance. For ease of clinical interpretation, the change from baseline at M4 (weight loss) and M12 (maintenance) was used as the primary and secondary end points for efficacy assessment. Separate analyses were performed for the weight loss (M4 – baseline) period and maintenance (M12 – M4) periods. All data and analyses presented represent the ITT condition. For the ITT analysis, baseline‐observation‐carry‐forward was used for missing M4 and 12 end points. A 90% two‐sided CI for the mean difference between the soy and non‐soy groups was calculated at the end of M4 and M12. If the upper bound of the CI was smaller than the pre‐specified non‐inferiority margin of ∆ ≤ 3%, non‐inferiority would be established and followed by a test for superiority using the ordinary null value. For the superiority test, the minimum detectable effect sizes were 0.63 common standard deviations for comparing two groups. Because secondary outcomes were not part of the a priori hypothesis, no adjustment for multiple comparisons was made 23, 24. All P‐values are reported. Descriptive data are presented as mean ± standard deviation and outcomes data as mean ± standard error.
To delineate the profile of change in outcome variables over the entire study period, a linear mixed effects model was fit, as supportive analyses, to all the data points of the primary and secondary outcomes with repeated measures. Independent variables in this model consisted of the measuring time and dietary treatment indicator as classification variables and their interaction term. Unstructured covariance was used in all the mixed model analyses. Time by group interaction, within‐group change between different time points and between‐group difference at different time points were tested using contrasts.
Results
Study recruitment and retention
Shown in Figure 1, a total of 85 individuals were screened for this study. Seventy‐two of the 85 met the inclusion criteria and were enrolled. One participant withdrew from the study prior to randomization for a total of 71 participants. Thirty‐six participants were randomized to the soy group and 35 to the non‐soy group. Of the 71 participants enrolled, 80.3% (soy: n = 29; non‐soy: n = 28) completed the weight loss phase (baseline – M4) and 63.4% (soy: n = 21; non‐soy: n = 24) completed the entire trial (baseline – M12). During the weight loss intervention, 2 were lost to follow up (from the soy group) and 12 withdrew consent (five from the soy group and seven from the non‐soy group) with the reasons for dropout being family, work and time commitment issues (n = 7), rigour/difficulty of the SOS intervention (n = 2), dislike of the supplemental soy products (n = 2) and moving out of state (n = 1). During the maintenance phase, seven were lost to follow up (six from the soy group and one from the non‐soy group), one was withdrawn due to pregnancy (from the non‐soy group) and four withdrew consent (two from soy and two from non‐soy). Dropouts during this time were due to loss of interest/desire to continue the program (n = 2) and time commitment issues (n = 2).
Figure 1.
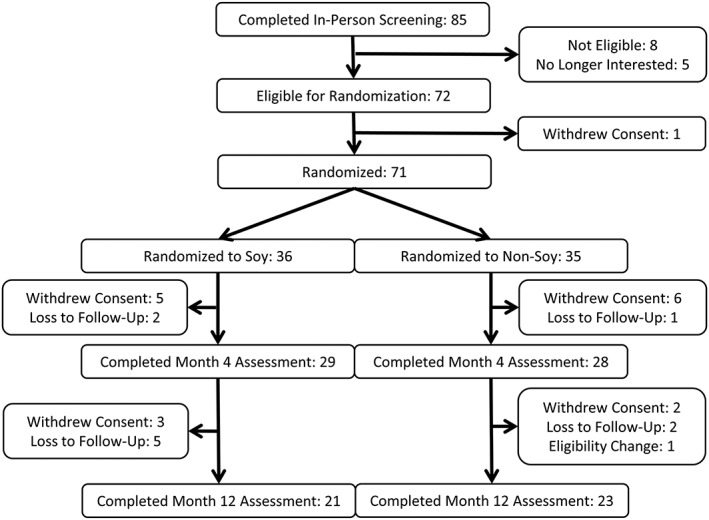
Participant recruitment diagram.
Participant characteristics
Baseline demographics and physical characteristics of the 71 individuals randomized in the study (Table 1) were similar between intervention groups with the exception of diastolic blood pressure, which was significantly higher in the soy group (soy: 77.9 ± 7.5 mmHg; non‐soy, 73.9 ± 8.5 mmHg, P = 0.04). Participants were, on average, 42 ± 9 years old with a BMI of 32.9 ± 3.5, and 82% of the participants were women. Baseline blood parameters, blood pressure and physical function tests were reflective of a healthy participant sample.
Table 1.
Baseline participant characteristics1
| Parameter | Soy (n = 35) | Non‐soy (n = 36) |
|---|---|---|
| Age (years) | 42.4 ± 10.7 | 41.8 ± 7.9 |
| Female (n, %) | 29 (80.6%) | 29 (82.9%) |
| Body weight (kg) | 94.9 ± 14.3 | 90.6 ± 11.4 |
| BMI (kg m−2) | 33.1 ± 3.5 | 32.7 ± 3.6 |
| Body fat (%) | 39.7 ± 7.2 | 40.2 ± 5.6 |
| Glucose (mg dL−1) | 95.4 ± 11.2 | 92.2 ± 8.2 |
| Total cholesterol (mg dL−1) | 196.3 ± 41.9 | 196.9 ± 43.4 |
| LDL (mg dL−1) | 119.1 ± 33.7 | 119.9 ± 35.2 |
| HDL (mg dL−1) | 53.7 ± 13.0 | 55.9 ± 11.2 |
| Triglycerides (mg dL−1) | 123.2 ± 57.8 | 112.4 ± 39.2 |
| Systolic BP (mmHg) | 115.7 ± 11.9 | 111.2 ± 11.4 |
| Diastolic BP (mmHg) | 77.9 ± 7.5 | 73.9 ± 8.5 |
| CRP (mg L−1) | 7.7 ± 8.8 | 4.8 ± 4.0 |
| Physical activity (MET per week) | 56.0 ± 41.7 | 62.9 ± 41.7 |
All values are mean ± standard deviation.
BMI, body mass index; BP, blood pressure; CRP, C‐reactive protein; HDL, high‐density lipoprotein cholesterol; LDL, low‐density lipoprotein cholesterol; MET, metabolic equivalent.
Dietary compliance
Compliance was assessed based on self‐reported total protein servings per day and average supplemental protein consumption per day (100% compliance = 3 servings per day) for the weight loss (112 d) and maintenance (252 d) phases of the study. Self‐reported compliance to the high‐protein dietary protocol (100% compliance = 6 servings per day) was also similar between groups during the weight loss (soy: 5.2 ± 0.5 servings per day, n = 32; non‐soy: 5.1 ± 0.5 servings per day, n = 34) and maintenance phases (soy: 5.2 ± 0.7 servings per day; non‐soy: 4.2 ± 1.3 servings per day). Consumption of supplemental protein foods (100% compliance = 3 servings per day) in the soy group averaged 2.4 ± 0.7 servings per day during weight loss and 2.5 ± 0.5 servings per day during the maintenance phase; consumption in the non‐soy group averaged 2.2 ± 0.04 servings per day during weight loss and 1.9 ± 0.07 servings per day during the maintenance phase. Completion rate of the food logs was determined by number of daily logs received divided by total days in each phase. Completion rates were as follows: soy: 63.9% ± 31.2%; non‐soy group 65.1% ± 35.9% during the weight loss phase; and soy: 54.7% ± 35.9%; non‐soy: 62.5% ± 35.1% during the maintenance phase.
In accordance with the HP diet, BUN levels were significantly and similarly increased by 3.5–4.0 mg dL−1 from baseline values of 13.8 mg dL−1 in both of the groups at M4, and 2.7–3.5 mg dL−1 at M12. No differences were observed between groups in the amount of change seen between BUN levels at M4 or M12.
Changes in body weight and body mass index
Absolute (kg) and relative (%) changes in body weight at the end of M4 and M12 for each of the treatment groups are shown in Table 2. Both groups lost significant and similar amounts of body weight at each time point. Relative to the a priori non‐inferiority margin of 3% (Figure 2), the 90% CIs for the difference in absolute and relative weight change between groups at the end of the weight loss intervention (M4) were −2.3, 1.8 kg (P = 0.84) and −2.0, 2.3% (P = 0.90), respectively. BMI was reduced at M4 (S: −2.9 ± 0.3 kg m−2, NS: −2.9 ± 0.3 kg m−2, both P < 0.001) and at M12 (S: −1.5 ± 0.5 kg m−2, P = 0.002, NS: −2.0 ± 0.5 kg m−2, P < 0.001) with no differences in BMI reduction between N and NS (P value for difference at M4 = 0.98 and M12 = 0.40).
Table 2.
Mean difference in weight loss at month 4 and month 12 between soy and non‐soy
| Outcome | Time point | Soy | Non‐soy | Group differences | |
|---|---|---|---|---|---|
| Δ (90% CI) | P value | ||||
| Weight change (kg) | Month 4 | −6.6 ± 5.0 | −6.4 ± 5.1 | −0.24 (−2.3, 1.8) | 0.84 |
| Month 12 | −3.4 ± 5.0 | −4.2 ± 6.6 | 0.75 (−1.6, 3.1) | 0.59 | |
| Weight change (%) | Month 4 | −7.0 ± 5.2 | −7.1 ± 5.7 | 0.16 (−2.0, 2.3) | 0.90 |
| Month 12 | −3.6 ± 5.1 | −4.8 ± 7.3 | 1.1 (−1.4, 3.6) | 0.44 | |
Results are presented as mean weight change ± standard error and mean difference in weight change with 90% confidence intervals (CIs) using an intention to treat analysis. P value is from two‐tailed Student's t‐test for testing the null hypothesis that mean group difference is zero.
Figure 2.
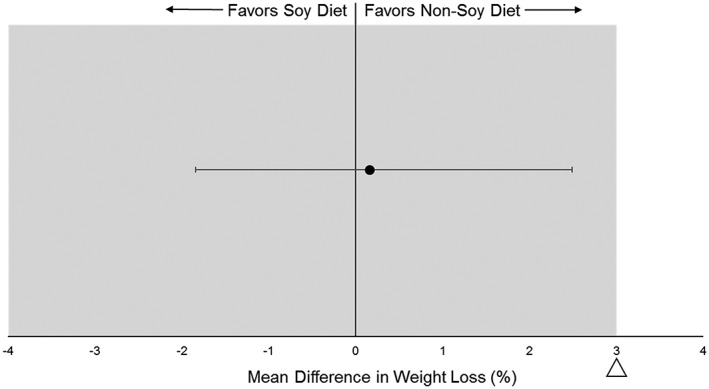
Mean difference in relative weight loss (%) between soy and non‐soy groups relative to the 3% non‐inferiority margin. The intention to treat analysis indicated similar % weight loss at month 4 between soy and non‐soy.
Changes in body composition
Table 3 shows the changes in body fat %, fat mass and lean mass at M4 and M12. Both groups lost significant amounts of lean and body fat mass at the end of the weight loss intervention (M4). No statistical differences or overall interactions were observed between the groups for any of the body composition variables at any point in the trial.
Table 3.
Changes in body composition at month 4 and month 121
| Outcome variable | Group | Time point | Month 4 – baseline | P value | Month 12 – baseline | P value | ||
|---|---|---|---|---|---|---|---|---|
| Baseline | Month 4 | Month 12 | ||||||
| Total body fat mass (kg) | Soy | 37.1 (1.4) | 30.7 (1.4) | 33.0 (1.7) | −6.4 (0.6) | <.001 | −4.1 (1.0) | <.001 |
| Non‐soy | 35.7 (1.4) | 29.0 (1.5) | 30.8 (1.7) | −6.7 (0.6) | <.001 | −4.9 (1.0) | <.001 | |
| Difference | 1.4 (2.0) | 1.7 (2.0) | 2.2 (2.4) | 0.3 (0.8) | 0.732 | 0.8 (1.5) | 0.592 | |
| Total body fat (%) | Soy | 39.7 (1.1) | 36.0 (1.2) | 36.5 (1.2) | −3.8 (0.5) | <.001 | −3.2 (0.6) | <.001 |
| Non‐soy | 40.2 (1.2) | 35.6 (1.2) | 36.4 (1.2) | −4.6 (0.5) | <.001 | −3.9 (0.5) | <.001 | |
| Difference | −0.5 (1.6) | 0.3 (1.7) | 0.1 (1.7) | 0.8 (0.7) | 0.246 | 0.6 (0.8) | 0.429 | |
| Total body lean mass (kg) | Soy | 55.8 (1.5) | 54.2 (1.6) | 55.6 (1.6) | −1.6 (0.3) | <.001 | −0.18 (0.4) | 0.668 |
| Non‐soy | 53.0 (1.5) | 51.9 (1.6) | 52.6 (1.6) | −1.1 (0.3) | <.001 | −0.48 (0.4) | 0.24 | |
| Difference | 2.7 (2.2) | 2.2 (2.3) | 3.0 (2.3) | −0.48 (0.4) | 0.286 | 0.30 (0.6) | 0.609 | |
Intention to treat linear mixed‐effects model analysis with unstructured covariance was used to assess the efficacy of intervention on each outcome variable (soy: n = 36; non‐soy: n = 35). Test of time by group interaction was used to test the efficacy of intervention at each time point. Results are mean (standard error). Significant P values (P < 0.05) are indicated in bold.
Changes in cardiometabolic health and physical activity
Intervention and dietary treatment effects on metabolic, cardiovascular and physical activity measures are shown in Table 4. Lipids and blood pressure were similarly reduced and physical activity similarly increased between groups at the end of M4. Briefly, low‐density lipoprotein cholesterol was reduced by an average of 16 mg dL−1, total cholesterol by 22 mg dL−1, triglycerides by 37 mg dL−1 and systolic and diastolic blood pressure by 4 mmHg; self‐reported physical activity increased by 15 METs per week. Although there were no significant differences or overall interactions between the groups for any of the outcome measures, CRP was significantly reduced at M4 and M12 in S only (P < 0.05). Triglycerides, on the other hand, remained significantly reduced at the end of the trial only in NS, while total cholesterol remained reduced in both groups at the end of M12. Glucose and high‐density lipoprotein concentrations were not changed in either of the groups at any point in the trial.
Table 4.
Changes in markers of cardiometabolic health at month 4 and month 121
| Outcome variable | Group | Time point | Month 4 – baseline | P value | Month 12 – baseline | P value | ||
|---|---|---|---|---|---|---|---|---|
| Baseline | Month 4 | Month 12 | ||||||
| Glucose (mg dL−1) | Soy | 95.4 (1.6) | 95.3 (1.2) | 94.1 (1.4) | −0.2 (1.5) | 0.915 | −1.3 (1.3) | 0.298 |
| Non‐soy | 92.2 (1.7) | 91.9 (1.2) | 91.3 (1.3) | −0.3 (1.5) | 0.862 | −0.9 (1.2) | 0.445 | |
| Difference | 3.2 (2.3) | 3.3 (1.7) | 2.8 (1.9) | 0.1 (2.1) | 0.961 | −0.4 (1.8) | 0.825 | |
| BUN (mg dL−1) | Soy | 13.9 (0.5) | 17.4 (0.8) | 16.7 (0.8) | 3.5 (0.8) | <.001 | 2.7 (0.8) | <.001 |
| Non‐soy | 13.7 (0.5) | 17.7 (0.8) | 17.2 (0.8) | 4.0 (0.8) | <.001 | 3.5 (0.7) | <.001 | |
| Difference | 0.2 (0.7) | −0.3 (1.1) | −0.6 (1.1) | −0.5 (1.1) | 0.667 | −0.8 (1.1) | 0.455 | |
| CRP (mg L−1) | Soy | 7.7 (1.2) | 5.0 (0.8) | 5.4 (1.0) | −2.7 (1.0) | 0.006 | −2.3 (0.8) | 0.003 |
| Non‐soy | 4.8 (1.2) | 4.0 (0.9) | 3.4 (1.0) | −0.8 (1.0) | 0.395 | −1.4 (0.8) | 0.069 | |
| Difference | 2.9 (1.7) | 1.0 (1.2) | 2.0 (1.4) | −1.9 (1.4) | 0.177 | −0.9 (1.1) | 0.401 | |
| LDL‐C (mg dL−1) | Soy | 119.2 (5.7) | 105.1 (5.0) | 104.9 (5.7) | −14.1 (3.9) | <.001 | −14.3 (4.8) | 0.004 |
| Non‐soy | 119.9 (5.8) | 101.1 (5.1) | 111.0 (5.7) | −18.9 (3.9) | <.001 | −8.9 (4.7) | 0.062 | |
| Difference | −0.7 (8.2) | 4.0 (7.2) | −6.1 (8.1) | 4.7 (5.6) | 0.401 | −5.4 (6.7) | 0.421 | |
| HDL‐C (mg dL−1) | Soy | 53.6 (2.0) | 52.9 (1.7) | 52.3 (2.2) | −0.7 (1.3) | 0.63 | −1.2 (1.5) | 0.417 |
| Non‐soy | 54.9 (2.0) | 52.7 (1.7) | 53.1 (2.2) | −2.2 (1.3) | 0.104 | −1.8 (1.5) | 0.228 | |
| Difference | −1.3 (2.9) | 0.2 (2.4) | −0.8 (3.1) | 1.6 (1.9) | 0.414 | 0.6 (2.1) | 0.79 | |
| Total cholesterol (mg dL−1) | Soy | 196.0 (7.1) | 176.7 (5.7) | 180.5 (6.2) | −19.3 (4.8) | <.001 | −15.5 (4.8) | 0.002 |
| Non‐soy | 196.9 (7.2) | 170.8 (5.8) | 182.4 (6.2) | −26.1 (4.8) | <.001 | −14.5 (4.7) | 0.003 | |
| Difference | −0.9 (10.1) | 5.0 (8.2) | −1.9 (8.7) | 6.8 (6.8) | 0.319 | −1.0 (6.7) | 0.886 | |
| Triglycerides (mg dL−1) | Soy | 122.6 (8.3) | 85.3 (4.7) | 108.7 (7.6) | −37.3 (7.3) | <.001 | −14.0 (8.6) | 0.109 |
| Non‐soy | 112.4 (8.3) | 74.3 (4.8) | 91.1 (7.5) | −38.1 (7.23) | <.001 | −21.4 (8.5) | 0.014 | |
| Difference | 10.2 (11.8) | 11.0 (6.8) | 17.6 (10.6) | 0.8 (10.3) | 0.94 | 7.4 (12.1) | 0.541 | |
| SBP (mmHg) | Soy | 115.7 (1.9) | 111.5 (2.1) | 114.0 (2.4) | −4.3 (2.1) | 0.041 | −1.7 (2.0) | 0.39 |
| Non‐soy | 111.1 (2.0) | 107.0 (2.1) | 110.5 (2.4) | −4.2 (2.1) | 0.049 | −0.7 (1.9) | 0.719 | |
| Difference | 4.6 (2.8) | 4.5 (2.9) | 3.5 (3.4) | −0.1 (2.9) | 0.973 | −1.0 (2.7) | 0.709 | |
| DBP (mmHg) | Soy | 77.9 (1.3) | 74.0 (1.3) | 75.4 (1.4) | −3.9 (1.5) | 0.013 | −2.6 (1.5) | 0.1 |
| Non‐soy | 73.9 (1.4) | 69.9 (1.3) | 74.3 (1.4) | −4.0 (1.6) | 0.012 | 0.4 (1.5) | 0.79 | |
| Difference | 4.0 (1.9) | 4.1 (1.8) | 1.1 (2.0) | 0.1 (2.2) | 0.963 | −3.0 (2.1) | 0.171 | |
Intention to treat linear mixed‐effects model analysis with unstructured covariance was used to assess the efficacy of intervention on each outcome variable (soy: n = 36; non‐soy: n = 35). Test of time by group interaction was used to test the efficacy of intervention at each time point. Results are mean (standard error). Significant P values (P < 0.05) are indicated in bold.
BUN, blood urea nitrogen; CRP, C‐reactive protein; DBP, diastolic blood pressure; HDL‐C, high‐density lipoprotein cholesterol; LDL‐C, low‐density lipoprotein cholesterol; SBP, systolic blood pressure.
Discussion
As hypothesized, similar weight loss was observed between HP, energy‐restricted diets with either supplemental soy‐protein based foods or non‐soy‐based proteins. The difference between groups was within a predetermined non‐inferiority margin of ∆ ≤ 3% for relative change in body weight following 4 months of volitional weight loss. Both groups experienced similar improvements in secondary outcomes such as body composition, lipids and blood pressure. Some weight regain occurred during the self‐directed, 8 month follow‐up period, but there were no significant differences between the dietary treatment groups for any of the outcome measures throughout the 12‐month trial. While not a fully vegetarian diet, these findings are encouraging for vegetarians who struggle to consume sufficient amounts of dietary protein and for those seeking to add lean sources of high quality plant proteins to their diets for optimal health and weight management.
A wide range of health benefits is associated with weight loss in overweight and obese adults; however, a potential drawback of weight loss can be the accompanying loss of skeletal muscle mass 3. Although this study was not powered to investigate changes in body composition and lacked a standard protein diet group, it is worth noting that, in contrast to the composition of weight loss observed at M4 (7.8 kg, 83% body fat mass, 17% lean mass) the composition of weight loss at the end of M12 (−4.6 kg) consisted of 95% body fat and 5% lean mass (Table 4). Importantly, IPAQ reported increases in physical activity at both time points did not differ between groups suggesting that differences in physical activity in terms of total METs per week did not contribute towards the outcome results; however, we did not collect detailed information on exercise type and frequency. While speculative, these data warrant further investigation as they suggest that a HP diet may have beneficial effects on the composition of weight re‐gain.
Interest in plant‐based diets has increased with the latest dietary recommendations to consume more vegetables and plant‐based foods high in protein such as soy 11, 25. The protein digestibility‐corrected amino acid scores (the most widely recognized and approved method for evaluating protein quality) for soy protein are comparable with milk, meat and eggs making it the highest quality of all the plant proteins 16. Soy protein also contains a significant amount of the amino acid leucine, which has been shown to play a key role in protein synthesis and muscle hypertrophy 26, 27. Notably, the critical threshold of daily leucine consumption associated with muscle health is approximately 3 g d−1 28, 29, and each of the soy products administered in this trial contained 1.6 g leucine. The results of this trial provide evidence that the consumption of foods high in soy protein is not inferior to other supplemental protein sources when it comes to changes in lean mass observed to occur during volitional weight loss and maintenance. This finding may be especially relevant for vegetarians who may find it difficult to consume enough protein to meet the daily recommended intake of 0.8 g·kg·d and especially that of a high‐protein diet (1.2–1.6 g·kg·d) 30, 31.
The regular consumption of soy protein has been associated with improvements in cardiometabolic health associated with blood lipids and blood pressure 12, 32. Although no statistical differences in any of the cardiometabolic outcomes were observed between the soy and non‐soy groups (Table 4), there was a trend towards superior improvements in CRP – an inflammatory biomarker of cardiovascular disease risk 33 – in the soy group at the end of M4. These data are in corroboration with those from a similar trial done in older adults (68 ± 5 years) 34 suggesting a possible benefit of a reduced calorie, HP diet with soy on inflammation. Conclusive evidence linking soy food consumption to improvements in cardiovascular health, however, is limited and contradictory because of the high degree of inter‐individual variation in the bioavailability and metabolism of the bioactive constituents in soy foods 14.
There are several strengths of this study including block randomization stratified by BMI, age and sex; a reduction in potential bias by using clearly defined curriculum for all intervention classes in conjunction with classes being taught by the same weight loss coach, in the same room at the same time of day; and the assessment of a wide range of outcome variables following weight loss and a period of self‐directed maintenance. In line with other comprehensive behavioural weight loss trials of similar duration, approximately 80% of the participants completed the 4‐month weight loss phase of the trial and 63% completed the entire year 35. This is also one of only a few studies that looks specifically at soy protein during weight loss.
The main limitation of the study is the lack of normal protein control groups with and without soy consumption. Such a comparison would allow for a more complete investigation of the relative influences of increased overall protein and soy protein specifically on weight loss and cardiometabolic health. Future researchers should consider these research questions in their study designs. The principal reliance on self‐reported food logs for tracking soy and non‐soy protein foods is another limitation of the current study. However, the observed increase in BUN is indicative of an overall increase in dietary protein intake, which supports the participants' compliance with the study prescription on a broader level. An unforeseen limitation of the study is the unpreventable use of different methodologies to assess blood lipids at baseline and M12 (VAP and LipoProfile) due to the discontinuation of the VAP method by the laboratory. While overall levels of physical activity were assessed in terms of METs per week, the specific details of exercise intensity and type were not tracked due to the design and approach of the SOS program. Lastly, as with most weight loss studies, participants were predominantly middle aged women (82%), which limit the ability to extrapolate these findings to men and younger or older women.
In conclusion, the results of this study provide evidence that, when consumed as part of a reduced calorie, high‐protein diet, soy protein is acceptably comparable in efficacy to other proteins for weight loss among healthy, middle aged adults with overweight/obesity. These findings may be particularly useful to those looking to increase their intake of protein from high‐quality, vegetarian sources as part of a high‐protein, reduced calorie diet.
Conflict of Interest Statement
Drs Hill, Wyatt, and Peters have received royalties from the book, State of Slim. Dr. Mukherjea is a current employee of DuPont USA and Dr. Flock was previously employed by DuPont USA.
Author Contributions
J. O. H., H. R. W. and J. C. P. conceived the research project; K. J. S., R. D. S. and H. N. conducted the research; K. J. S. and Z. P. performed the statistical analyses; K. J. S. drafted the manuscript, and R. D. S., J. C. P., H. K. N., Z. P., H. R. W., M. R. F., R. M. and J. O. H. provided critical feedback and edits to the manuscript. All authors take responsibility for the final content of the manuscript.
Acknowledgements
This study is supported by DuPont Nutrition & Health, NIH NHLBI (T32 HL116276), NIH/NCRR Colorado CTSI (UL1 RR025780) and Colorado Nutrition Obesity Research Center (P30 DK048520).
Speaker, K. J. , Sayer, R. D. , Peters, J. C. , Foley, H. N. , Pan, Z. , Wyatt, H. R. , Flock, M. R. , Mukherjea, R. , and Hill, J. O. (2018) Effects of consuming a high‐protein diet with or without soy protein during weight loss and maintenance: a non‐inferiority, randomized clinical efficacy trial. Obesity Science & Practice, 4: 357–366. 10.1002/osp4.278.
[Correction added on 02 July, 2018, after first online publication: the affiliation of M.R. Flock has been corrected to “Clinical & Translational Science Institute, University of Pittsburgh, Pittsburgh, PA, USA”].
References
- 1. Kim JE, O'Connor LE, Sands LP, Slebodnik MB, Campbell WW. Effects of dietary protein intake on body composition changes after weight loss in older adults: a systematic review and meta‐analysis. Nutr Rev 2016; 74: 210–224. [DOI] [PMC free article] [PubMed] [Google Scholar]
- 2. Leidy HJ, Clifton PM, Astrup A, Wycherley TP, Westerterp‐Plantenga MS, Luscombe‐Marsh ND, Woods SC, Mattes RD. The role of protein in weight loss and maintenance [Internet]. Am J Clin Nutr. 2015. p. ajcn084038. Available from: http://ajcn.nutrition.org/content/early/2015/04/29/ajcn.114.084038/nhttp://ajcn.nutrition.org/content/early/2015/04/29/ajcn.114.084038.full.pdf/nhttp://www.ncbi.nlm.nih.gov/pubmed/25926512 [DOI] [PubMed] [Google Scholar]
- 3. Wycherley TP, Moran LJ, Clifton PM, Noakes M, Brinkworth GD. Effects of energy‐restricted high‐protein, low‐fat compared with standard‐protein, low‐fat diets: a meta‐analysis of randomized controlled trials. Am J Clin Nutr 2012; 96: 1281–1298. [DOI] [PubMed] [Google Scholar]
- 4. Halton TL, Hu FB. The effects of high protein diets on thermogenesis, satiety and weight loss: a critical review. J Am Coll Nutr 2004; 23: 373–385. [DOI] [PubMed] [Google Scholar]
- 5. Sayer RD, Speaker KJ, Pan Z, Peters JC, Wyatt HR, Hill JO. Equivalent reductions in body weight during the Beef WISE Study: beef's role in weight improvement, satisfaction and energy. Obes Sci Pract [Internet] 2017. Available from: 10.1002/osp4.118. [DOI] [PMC free article] [PubMed] [Google Scholar]
- 6. Greco E, Winquist A, Lee TJ, et al. The role of source of protein in regulation of food intake, satiety, body weight and body composition. J Nutr Heal Food Eng [Internet] 2017; 6 Available from: http://medcraveonline.com/JNHFE/JNHFE-06-00223.php. [Google Scholar]
- 7. Li J, Armstrong CLH, Campbell WW. Effects of dietary protein source and quantity during weight loss on appetite, energy expenditure, and cardio‐metabolic responses. Nutrients 2016; 8: 9–12. [DOI] [PMC free article] [PubMed] [Google Scholar]
- 8. Leidy HJ, Todd CB, Zino AZ, et al. Consuming high‐protein soy snacks affects appetite control, satiety, and diet quality in young people and influences select aspects of mood and cognition. J Nutr [Internet] 2015; 145: 1614–1622. Available from: 10.3945/jn.115.212092. [DOI] [PubMed] [Google Scholar]
- 9. Leidy HJ, Hoertel HA, Douglas SM, Higgins KA, Shafer RS. A high‐protein breakfast prevents body fat gain, through reductions in daily intake and hunger, in “breakfast skipping” adolescents. Obesity 2015; 23: 1761–1764. [DOI] [PubMed] [Google Scholar]
- 10. Sucher S, Markova M, Hornemann S, et al. Comparison of the effects of diets high in animal or plant protein on metabolic and cardiovascular markers in type 2 diabetes: a randomized clinical trial. Diabetes Obes Metab 2017; 19: 944–952. [DOI] [PubMed] [Google Scholar]
- 11. Hauk L. DGAC makes food‐based recommendations in the 2015–2020 dietary guidelines for Americans. Am Fam Physician 2016: 525. [PubMed] [Google Scholar]
- 12. Paul G, Mendelson GJ. Evidence supports the use of soy protein to promote cardiometabolic health and muscle development. J Am Coll Nutr 2015; 34: 56–59. [DOI] [PubMed] [Google Scholar]
- 13. Tham DM, Gardner CD, Haskell WL. Potential health benefits of dietary phytoestrogens: a review of the clinical, epidemiological, and mechanistic evidence. J Clin Endocrinol Metab 1998: 2223–2235. [DOI] [PubMed] [Google Scholar]
- 14. Manach C, Milenkovic D, Van de Wiele T, et al. Addressing the inter‐individual variation in response to consumption of plant food bioactives: towards a better understanding of their role in healthy aging and cardiometabolic risk reduction. Mol Nutr Food Res 2017; 61. [DOI] [PMC free article] [PubMed] [Google Scholar]
- 15. Cope MB, Erdman JW, Allison DB. The potential role of soyfoods in weight and adiposity reduction: an evidence‐based review. Obes Rev 2008; 9: 219–235. [DOI] [PubMed] [Google Scholar]
- 16. Hughes GJ, Ryan DJ, Mukherjea R, Schasteen CS. Protein digestibility‐corrected amino acid scores (PDCAAS) for soy protein isolates and concentrate: criteria for evaluation. J Agric Food Chem 2011; 59: 12707–12712. [DOI] [PubMed] [Google Scholar]
- 17. Hahn S. Understanding noninferiority trials. Korean J Pediatr [Internet] 2012; 55: 403 Available from: https://synapse.koreamed.org/DOIx.php?id=10.3345/kjp.2012.55.11.403. [DOI] [PMC free article] [PubMed] [Google Scholar]
- 18. Hill JO, Wyatt H, Aschwanden C. State of Slim: Fix Your Metabolism and Drop 20 Pounds in 8 Weeks on the Colorado Diet. Emmaus, Pennsylvania: Rodale; 2013. xx, 268 p. [Google Scholar]
- 19. Morse MH, Haub MD, Evans WJ, Campbell WW. Protein requirement of elderly women: nitrogen balance responses to three levels of protein intake. J Gerontol A Biol Sci Med Sci [Internet] 2001; 56: M724–M730. Available from: http://www.pubmedcentral.nih.gov/articlerender.fcgi?artid=2495087&tool=pmcentrez&rendertype=abstract. [DOI] [PMC free article] [PubMed] [Google Scholar]
- 20. Kulkarni KR. Cholesterol profile measurement by vertical auto profile method. Clin Lab Med 2006; 26: 787–802. [DOI] [PubMed] [Google Scholar]
- 21. Craig CL, Marshall AL, Sjöström M, et al. International physical activity questionnaire: 12‐country reliability and validity. Med Sci Sports Exerc 2003; 35: 1381–1395. [DOI] [PubMed] [Google Scholar]
- 22. Harris PA, Taylor R, Thielke R, Payne J, Gonzalez N, Conde JG. Research electronic data capture (REDCap) – A metadata‐driven methodology and workflow process for providing translational research informatics support. J Biomed Inform 2009; 42: 377–381. [DOI] [PMC free article] [PubMed] [Google Scholar]
- 23. Rothman KJ. No adjustments are needed for multiple comparisons. Epidemiology [Internet] 1990; 1: 43–46. Available from: http://content.wkhealth.com/linkback/openurl?sid=WKPTLP:landingpage&an=00001648-199001000-00010. [PubMed] [Google Scholar]
- 24. Feise RJ. Do multiple outcome measures require p‐value adjustment? BMC Med Res Methodol [Internet] 2002; 2: 8 Available from: 10.1186/1471-2288-2-8. [DOI] [PMC free article] [PubMed] [Google Scholar]
- 25. Hughes GJ, Kress KS, Armbrecht ES, Mukherjea R, Mattfeldt‐Beman M. Initial investigation of dietitian perception of plant‐based protein quality. Food Sci Nutr [Internet] 2014; 2: 371–379. Available from: http://www.pubmedcentral.nih.gov/articlerender.fcgi?artid=4221835&tool=pmcentrez&rendertype=abstract. [DOI] [PMC free article] [PubMed] [Google Scholar]
- 26. Kimball SR, Jefferson LS. New functions for amino acids: effects on gene transcription and translation. Am J Clin Nutr [Internet] 2006; 83: 500S–507S. Available from: http://www.ncbi.nlm.nih.gov/pubmed/16470021. [DOI] [PubMed] [Google Scholar]
- 27. Norton LE, Layman DK. Leucine regulates translation initiation of protein synthesis in skeletal muscle after exercise. J Nutr [Internet] 2006; 136: 533S–537S. Available from: http://www.ncbi.nlm.nih.gov/pubmed/16424142. [DOI] [PubMed] [Google Scholar]
- 28. Paddon‐Jones D, Sheffield‐Moore M, Zhang X‐J, Volpi E, Wolf SE, Aarsland A, Ferrando AA, Wolfe RR. Amino acid ingestion improves muscle protein synthesis in the young and elderly. Am J Physiol Endocrinol Metab 2004;286:E321–E328. [DOI] [PubMed] [Google Scholar]
- 29. Tipton KD, Ferrando AA, Phillips SM, Doyle D, Wolfe RR. Postexercise net protein synthesis in human muscle from orally administered amino acids. Am J Physiol [Internet] 1999; 276: E628–E634. Available from: http://ajpendo.physiology.org/content/276/4/E628.abstract. [DOI] [PubMed] [Google Scholar]
- 30. Craig WJ, Mangels AR. American Dietetic Association. Position of the American Dietetic Association: vegetarian diets. J Am Diet Assoc 2009; 109: 1266–1282. [DOI] [PubMed] [Google Scholar]
- 31. Kniskern MA, Johnston CS. Protein dietary reference intakes may be inadequate for vegetarians if low amounts of animal protein are consumed. Nutrition [Internet] 2011; 27: 727–730. Available from: http://linkinghub.elsevier.com/retrieve/pii/S0899900710003059. [DOI] [PubMed] [Google Scholar]
- 32. Dong J‐Y, Tong X, Wu Z‐W, Xun P‐C, He K, Qin L‐Q. Effect of soya protein on blood pressure: a meta‐analysis of randomised controlled trials. Br J Nutr 2011; 106: 317–326. [DOI] [PubMed] [Google Scholar]
- 33. Ridker P, Bassuk S, Toth P. C‐reactive protein and risk of cardiovascular disease: evidence and clinical application. Curr Atheroscler Rep 2003; 5: 341–349. [DOI] [PubMed] [Google Scholar]
- 34. Beavers KM, Gordon MM, Easter L, et al. Effect of protein source during weight loss on body composition, cardiometabolic risk and physical performance in abdominally obese, older adults: a pilot feeding study. J Nutr Health Aging [Internet] 2015; 19: 87–95. Available from: http://www.pubmedcentral.nih.gov/articlerender.fcgi?artid=4818969&tool=pmcentrez&rendertype=abstract. [DOI] [PMC free article] [PubMed] [Google Scholar]
- 35. Franz MJ, VanWormer JJ, Crain AL, et al. Weight‐loss outcomes: a systematic review and meta‐analysis of weight‐loss clinical trials with a minimum 1‐year follow‐up. J Am Diet Assoc 2007; 107: 1755–1767. [DOI] [PubMed] [Google Scholar]