Abstract
Objective
To evaluate the projection-resolved (PR) optical coherence tomography angiography (OCTA) algorithm in detecting plexus-specific vascular abnormalities in retinal pathologies.
Design
Cross-sectional observational clinical study
Participants
Patients diagnosed with retinal vascular diseases and healthy volunteers.
Methods
Eyes were imaged using an OCT system operating at 840 nm and employing the split-spectrum amplitude decorrelation algorithm. A novel algorithm suppressed projection artifacts inherent to OCTA. The volumetric scans were segmented and visualized on different plexuses.
Main Outcome Measures
Qualitative observation of vascular abnormalities on both cross-sectional and en face PR-OCTA images.
Results
Eight illustrative cases are reported. In cases of diabetic retinopathy, retinal vessel occlusion, and retinitis pigmentosa, PR-OCTA detected retinal nonperfusion regions within deeper retinal plexuses not visualized by conventional OCTA. In age-related macular degeneration, cross-sectional PR-OCTA permitted the classification of choroidal neovascularization, and, in a case of retinal angiomatous proliferation, identified a vertical vessel contiguous with the deep capillary plexus. In macular telangiectasia, PR-OCTA detected a diving perifoveal vein and delineated subretinal neovascularization.
Conclusions
Application of PR-OCTA promises to improve sensitive, accurate evaluation of individual vascular plexuses in multiple retinal diseases.
Introduction
While evaluation of retinal vasculature has historically depended on fluorescein angiography (FA), optical coherence tomography angiography (OCTA) has recently been developed as a noninvasive alternative imaging modality. OCTA systems, which harness the variability in reflectance of flowing red blood cells to differentiate vasculature from static tissue, permit 3D visualization of the vascular networks and are suitable for quantitative analysis.1 One of the major limitations of OCTA, however, lies in the presence of flow projection artifact. As the infrared beam interacts with the inner retina, the flowing blood cells in the more superficial vessels cast time-varying shadows on the deeper layers. An algorithm to detect decorrelation misinterprets these shadows as blood flow, thus confounding the 3D interpretation of OCTA.
Our group has proposed a projection-resolved OCTA (PR-OCTA) algorithm that resolves the ambiguity between in situ flow and projection artifact at the level of single volumetric pixels,2 rather than conventional projection removal by slab subtraction or masking, which was adopted by AngioVue and AngioPlex commercial systems. Our method is based on the observation that intensity-normalized projection artifact signal does not exceed the value of the original, more superficial signal. Hence at each axial position, flow signal peaks are successively analyzed, selectively removing those with lesser values than more superficial peaks. The resulting 3D macular angiogram appears to demonstrates 3 distinct retinal vascular plexuses in the analogous anatomic location described by perifoveal histopathology.3 Compared to conventional projection removal techniques, en face PR-OCTA better preserves the continuity of the deeper vessels, enabling detailed analysis of individual vascular plexuses.2
Herein we present 8 cases of normal and pathologic conditions to illustrate the potential utility of PR-OCTA in research and clinical settings. Visualization of the distinct vascular plexuses can better discern regions of nonperfused retina, classify the depth of invasion of neovascular vessels, and delineate vertical vessels that define certain disease states. With these capabilities, PR-OCTA stands to further our understanding of various disorders and provide valuable information for diagnosis and monitoring of disease progression.
Methods
Participants were enrolled after informed consent was obtained in accordance with a protocol approved by the Institutional Review Board at Oregon Health & Science University. This study adhered to the tenets of the Declaration of Helsinki and was conducted in compliance with the Health Insurance Portability and Accountability Act. Patient records were reviewed to identify cases of potential interest with clear media and ability to maintain fixation. In total, 100 healthy subjects, along with 118 diabetic retinopathy, 14 retinal vein occlusion, 5 retinal artery occlusion, 62 neovascular age-related macular degeneration, 10 retinal angiomatous proliferation, 12 macular telangiectasia and 35 retinitis pigmentosa patients were enrolled. To better demonstrate the potential clinical application of this novel OCT methodology, 8 cases with characteristic pathological and clinical features were selected for this article.
Clinical imaging was acquired, including color fundus photography, en face OCT, and fundus autofluorescence. FA was performed by intravenous injection of 10% sodium fluorescein in water with excitation by a 488 nm wavelength laser.
OCTA was obtained using AngioVue, RTVue XR Avanti (Optovue, Inc), a commercial spectral-domain instrument with a center wavelength of 840 nm and an axial scan rate of 70 kHz. The 3×3 or 6×6 mm scanning region was centered at the fovea. Each volumetric macular data set consisted of 2 orthogonal scans. In both the fast transverse and slow transverse directions, 304 A-scans were sampled; 2 repeated B-scans were obtained at each position before proceeding to the next sampling location.
The AngioVue software uses the split-spectrum amplitude-decorrelation angiography (SSADA) algorithm, which compares consecutive B-scans at the same location to detect flow using motion contrast.4 Each scan set comprises of 2 volumetric scans: 1 vertical-priority raster and 1 horizontal-priority raster. The AngioVue software uses an orthogonal registration algorithm to register the 2 raster volumes to produce a merged 3D OCT angiogram.5,6
The merged volumetric angiograms were then exported for custom processing. Prior to segmentation, the PR-OCTA algorithm was applied to each merged volumetric OCTA scan, as described in detail previously.2 As the flow projection artifact tends to be intensity dependent, decorrelation values were first normalized to the log amplitude of the OCT reflectance signal. Following normalization, projected flow signals were found almost uniformly to demonstrate decreased decorrelation values compared to in situ flow. Hence by searching for successive greater decorrelation values along each A-line, the PR algorithm was capable of distinguishing true vessels from projection artifact. Decorrelation values at successive peaks were maintained while weaker values were set to zero.
The volumetric angiogram was segmented using a previously described directional graph search approach7 to identify the boundaries of the inner limiting membrane (ILM), inner plexiform layer (IPL), inner nuclear layer (INL), outer plexiform layer (OPL), outer nuclear layer (ONL), and retinal pigment epithelium (RPE)/Bruchs membrane (BM). Manual adjustment of the segmentation (<10 minutes) was applied when necessary. En face angiograms were constructed from maximum flow projection within set slabs determined by the segmentation. The superficial vascular complex (SVC) was composed of flow signal from the inner 80% of the ganglion cell complex (GCC) which includes all structures between the ILM and IPL/INL border; the inner capillary plexus (ICP) from the outer 20% of the GCC to the inner 50% of the INL; the deep capillary plexus (DCP) from the outer 50% of the INL and the OPL; the inner retina from ILM to OPL/ONL border and the outer retina from the OPL/ONL border to the RPE/BM. For different en face plexus angiograms, the display range differs slightly; the decorrelation value range of the inner retina and SVC is from 0.025 to 0.2, and that of the ICP, DCP and outer retina is from 0.025 to 0.15.
Results
Distinction of the retinal vascular plexuses in the healthy eye
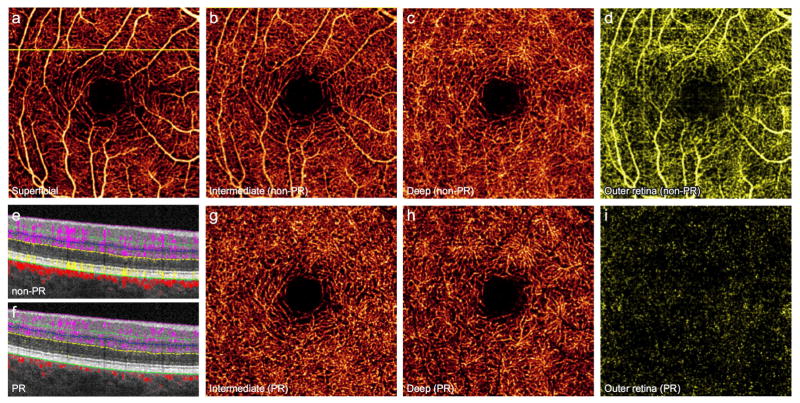
A normal human retina contains distinct retinal and choroidal circulations. At the macula, 3 permeating retinal vascular plexuses supply the inner retina, while the avascular outer retina is supplied by the underlying choroidal blood flow.8 In conventional OCTA, the signal from the innermost SVC projects onto the ICP and DCP, such that images of the 2 deeper plexuses contain artificially dense flow signal resembling the SVC (Fig. 1B, C). Moreover, projection from the retinal vessels appears in the avascular outer retina (Fig. 1D, E), particularly at the level of structurally hyperreflective layers such as the RPE.
Figure 1. 64-year-old man without retinal pathology.
(A), 3×3mm optical coherence tomography angiogram (OCTA) of the superficial vascular complex (SVC). Vessels from the SVC project angiographic artifact onto en face images of the intermediate capillary plexus (ICP) (B), deep capillary plexus (DCP) (C), and outer retina (D). Projection-resolved (PR) OCTA removes artifact while maintaining vascular continuity of the ICP (G) and DCP (H), and accurately conveys the avascular nature of the outer retina (I). (E), Cross-sectional OCTA corresponding to the yellow line in (A) demonstrates retinal vessels (purple) with angiographic tails, and flow artifact in the outer retina (yellow). (F), PR-OCTA removes both the tail artifact and outer retinal flow.
Application of PR-OCTA selectively removes projection artifact from the en face views of the ICP and DCP, allowing improved evaluation of deeper capillary morphology (Fig. 1G, H). On cross-sectional angiograms, the vertical streaks below superficial vessels are removed, distinguishing the deeper capillary plexuses (Fig. 1F). In addition, the algorithm minimizes artificial flow signal within the outer retina on both en face and cross-sectional images to more accurately reflect the avascular state (Fig. 1F, I).
Detection of nonperfusion in diabetic retinopathy
Screening for diabetic retinopathy (DR) and assessing its severity are essential for reducing morbidity related to diabetes. Objective, repeatable, and predictive biomarkers can improve screening and treatment. Macular ischemia is known to correlate with the severity of retinopathy and the risk of progression in DR.9,10 Although trained graders can qualitatively identify nonperfusion regions using FA, the technique is poorly suited for automated quantification of nonperfusion, due to variable contrast from dye leakage or pigmentation. OCTA, with consistently high contrast of capillary details generated by intrinsic flow motion, is better suited for quantified analysis.11,12 Therefore, nonperfusion area measured from OCTA has the potential to be a useful biomarker in DR.
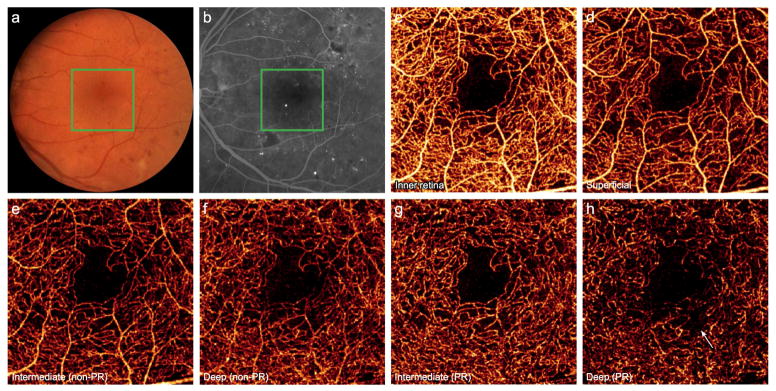
Furthermore, OCTA improves upon the 2D representation afforded by FA with the potential for a 3D construct of the retinal vasculature. However, projection artifact from superficial vessels hinders separation of distinct vascular layers in conventional OCTA. PR-OCTA resolves these artifacts and allows visualization of the 3 plexuses. In cases of DR, these separate slabs reveal a region of nonperfusion in deeper vascular plexuses (Fig. 2G, H), not evident in full-thickness retinal OCTA or FA, nor in three slabs without PR algorithm applied (Fig. 2E, F), thus improving the sensitivity of detecting microangiopathy.13,14 The advantages of 3D information and consistent contrast amenable to automated quantification merit exploration of a PR-OCTA-derived biomarker in DR.
Figure 2. 56-year-old man with moderate nonproliferative diabetic retinopathy with diabetic macular edema following 4 intravitreal injections of ranibizumab in the left eye.
(A), Color fundus photo of the left eye. (B), Fluorescein angiography demonstrates microaneurysms and an irregular foveal avascular zone. Green boxes indicate 3×3mm region imaged by optical coherence tomography angiography (OCTA). (C), Full thickness OCTA of the inner retina. (D), OCTA of the superficial vasculature. Conventional OCTA of the intermediate (E) and deep (F) plexuses retain several large caliber vessels from the superficial layer. Projection-resolved OCTA (G, H) removes this artifact and reveals a region of selective nonperfusion in the deep plexus (arrow).
Assessment of ischemic vascular diseases
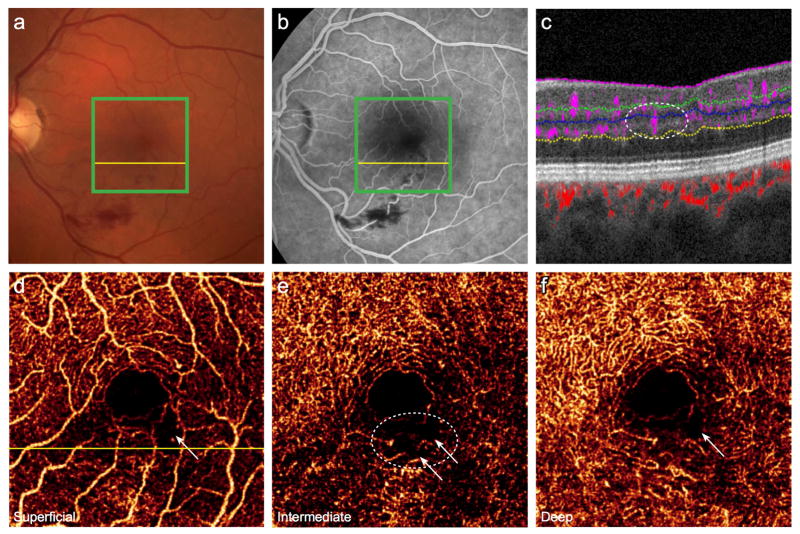
After DR, retinal vein occlusion is the second most common vascular disorder causing significant visual impairment, with a prevalence of approximately 1%.15 Clinical assessment of the extent of pathologic changes due to retinal vein occlusion has depended upon FA, which primarily reflects changes in the SVC.16 However, vascular abnormalities, including cystoid spaces and areas of nonperfusion, may be more frequently present in the deeper plexuses.17 This predilection may be due in part to the anatomic construct of the retinal vessels, as the fine-caliber capillaries that form the DCP drain directly into the venous system, and thus may be more susceptible to dysfunction due to retrograde pressure following vein occlusion. As illustrated in Figure 3, the 2 deeper plexuses contain disorganized vessels, nonperfusion, and capillary arcade disruption inferior to the fovea (white circle). These alterations are less prominent in the SVC (Fig. 3D). Corresponding areas of plexus-selective flow deficiency are also visualized on cross-sectional B-scan (Fig. 3C). These findings suggest that the 3 plexuses do not constitute a uniform anastomotic network of vessels, which may guide the understanding of the mechanism of microvasculature change in vein occlusion; therefore, PR-OCTA may promise clinical utility by revealing the extent of microvascular changes due to retinal vein occlusion and subsequent reperfusion abnormalities.
Figure 3. 55-year-old woman 17 months after branch retinal vein occlusion in the left eye.
(A), Color fundus photo reveals dot and blot hemorrhages and (B), fluorescein angiography demonstrates hemorrhage with an irregular foveal avascular zone. Green boxes indicate 3×3mm region imaged by projection-resolved optical coherence tomography angiography (PR-OCTA). (C), Cross-sectional PR-OCTA corresponding to the yellow lines, in which the white circle indicates a region of diminished intermediate and deep capillary flow beneath intact superficial retinal vasculature. PR-OCTA of the individual plexuses (D, E, F) reveals areas of nonperfusion (white arrows) and disorganized vasculature (white circle).
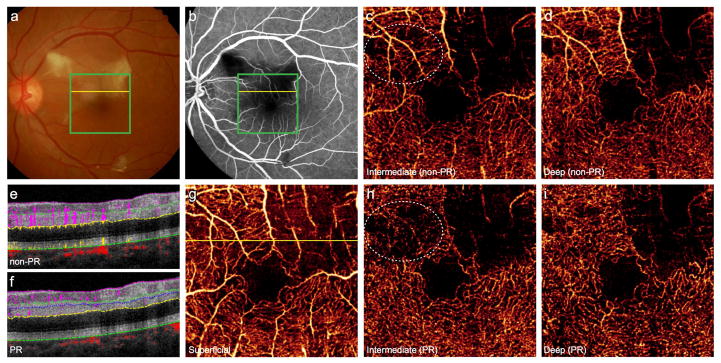
In retinal artery occlusion (RAO), FA demonstrates capillary dropout and decreased perfusion of vessels distal to the occlusion. Conventional OCTA shows reduced flow in these areas.18 There are frequently discrepancies between the perfusion of the superficial and deep plexuses,19–21 but projection artifacts may obscure areas of nonperfusion in the deeper plexuses. PR-OCTA can clearly delineate these incongruent areas of nonperfusion in the ICP and DCP (Fig. 4H–I). In this case of branch RAO, PR-OCTA enhances an additional region of ICP nonperfusion (Fig. 4H). By improving the assessment and distinction of the ICP and DCP, PR-OCTA will aid in exploring the etiology of the perfusion discrepancies between plexuses and the clinical impact on visual outcomes.
Figure 4. 52-year-old woman with branch retinal artery occlusion in the left eye.
(A), Color fundus photo discloses multiple intraarterial emboli and adjacent retinal whitening. (B), Fluorescein angiography demonstrates capillary nonperfusion in the regions of obstructed flow. Green boxes indicate 3×3mm region imaged by optical coherence tomography angiography (OCTA), and yellow lines correspond to the cross-sectional scans with (F) and without (E) projection-resolution (PR). Conventional OCTA of the intermediate (C) and deep (D) plexuses reveals a region of nonperfused retina superior temporal to the fovea. (G), OCTA of the superficial plexus shows less extensive nonperfusion. PR-OCTA of the intermediate plexus (H) reveals an additional region of nonperfusion superior nasal to the fovea (white circle) obscured by projection artifacts in conventional OCTA (C). The corresponding area of the deep plexus is intact (I).
Classification of neovascular age-related macular degeneration
Age-related macular degeneration (AMD) is a leading cause of blindness in the developed world.22,23 Neovascular AMD, responsible for the majority of vision loss, is characterized by the growth of abnormal vessels under the macula.24 Choroidal neovascularization (CNV) is anatomically classified as type 1 when the lesion is under the RPE and type 2 when it is between the RPE and the retina. Yet clinically, subjective interpretation of the leakage patterns on FA is used for this classification. The two types of CNV have shown distinct natural history and treatment response in clinical trials.25 A more objective classification may more accurately predict outcomes in clinical practice and in clinical trials.
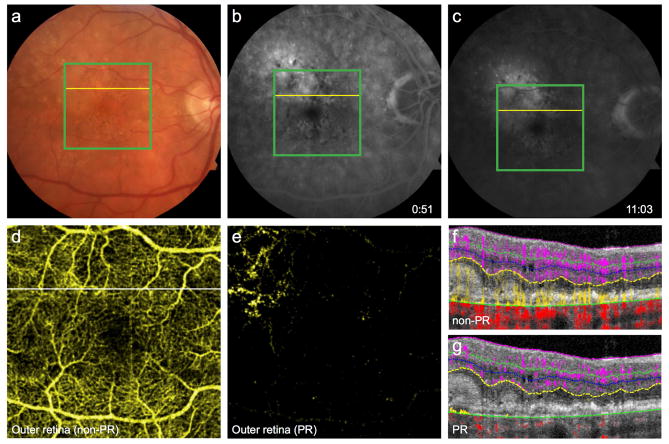
Cross-sectional OCTA displays the neovascular vessels in relation to the RPE,26 allowing an objective classification based on the anatomy. Projection artifacts from the inner retinal vessels, however, are present on the RPE and the region above and below the RPE, challenging the classification of CNV (see the vertical yellow signals in the outer retina in Fig. 5). By removing the projection artifacts, PR-OCTA facilitates CNV classification as type 1 (below RPE) or type 2 (above RPE). Figure 5 illustrates a case of neovascular AMD with occult CNV on FA (Fig 5B, 5C) that appears to have mixed subretinal and sub-RPE flow on conventional OCTA (Fig. 5F), but with PR-OCTA found to be purely type 1 CNV (Fig. 5G). In addition to anatomic classification, PR-OCTA improves the distinction of CNV on en face scans (Fig. 5D, E).
Figure 5. 74-year-old man diagnosed with neovascular age-related macular degeneration in the right eye.
(A), Color fundus photo demonstrates macular drusen, while early- (B) and late-phase (C) fluorescein angiography reveal stippled hyperfluorescence suggestive of type 1 choroidal neovascularization (CNV). Green boxes indicate 6×6mm region imaged by optical coherence tomography angiography (OCTA), and yellow lines correspond to cross-sectional scans. (D), Conventional OCTA of the outer retina reveals projection artifacts from the retinal vessels obscuring the CNV. (E), Projection-resolved (PR) OCTA clearly shows the CNV. (F), Cross-sectional OCTA (corresponding to the white line in D) without PR shows angiographic signal both above and below the retinal pigment epithelium (RPE). (G), PR-OCTA localizes the neovascular flow below the RPE, distinctly classifying the lesion as type 1 CNV. The flow signals within inner retina, outer retina and choroid are coded as purple, yellow and red, respectively.
Type 3 neovascularization, or retinal angiomatous proliferation (RAP), clinically presents with intraretinal or preretinal hemorrhage and foveal cysts.27,28 Unlike type 1 or 2 neovascularization, RAP vessels are thought to originate in the deep retinal plexus, then extend into the subretinal or sub-RPE space and potentially become associated with a serous pigment epithelial detachment (PED).28 Late-stage lesions can form a retinal-choroidal anastomosis (RCA).27 However, dye-based angiography has not been able to demonstrate conclusively this progression through the anatomic structures in vivo in 3D.28
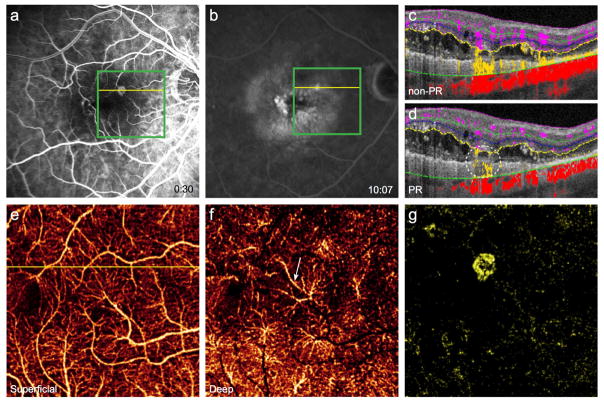
Phase-resolved Doppler OCTA has localized and staged RAP lesions.29 However, no OCTA technique has successfully isolated the vertical vessels in RAP due to the prominent angiographic tails that overlap with in situ signal. PR-OCTA removes tail artifact from the cross-sectional B-scans and demonstrates a vertical vessel within a RAP lesion that is contiguous with the DCP (Fig. 6D). En face angiograms show dilated vessels in the DCP and subretinal neovascularization in the outer retina, apparently connected by the vertical vessel (Fig. 6D–G). The combination of en face and cross-sectional PR-OCTA could be applied to observe the progression of RAP lesions in vivo and may provide additional evidence for the origin of neovascularization or the development of RCA.
Figure 6. 81-year-old woman with retinal angiomatous proliferation in the right eye.
Fluorescein angiography reveals a juxtafoveal hyperfluorescent focus (A) with late staining (B). Green boxes indicate 3×3mm region imaged by projection-resolved optical coherence tomography angiography (PR-OCTA), and yellow lines correspond to cross-sectional scans. (C), Diffuse outer retinal flow (yellow) is present on cross-sectional conventional OCTA; PR-OCTA (D) confirms neovascular flow (white circle), which appears to be continuous with the deep capillary plexus (DCP). (E), OCTA of the superficial vascular complex. (F), On PR-OCTA the DCP contains a prominently dilated vessel (white arrow), below which lies subretinal neovascularization (G).
Characterization of macular telangiectasia
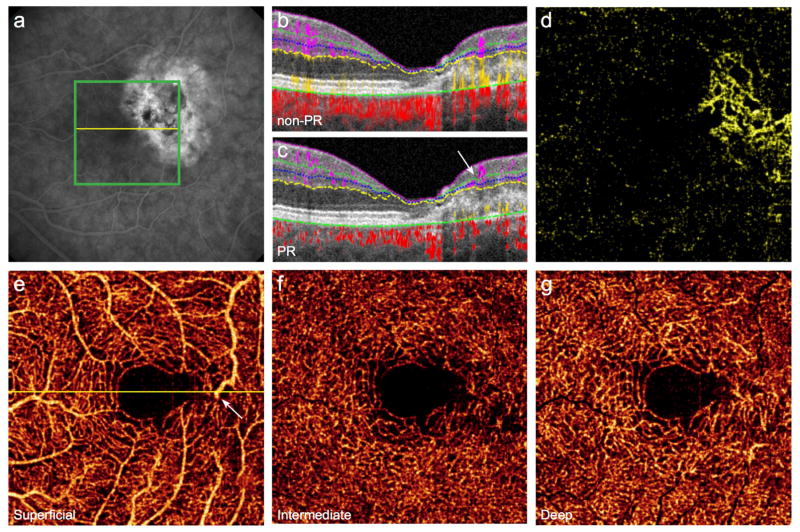
In macular telangiectasia type 2, juxtafoveal vessels undergo progressive ectatic changes, with characteristic alterations including diving right-angle venules and local retinal atrophy. In later stages, vascular proliferation with subretinal neovascularization can ensue.30 FA shows mild leakage in the perifoveal area but does not elucidate the progression of the disease through the various layers of the retina. Because of the presence of the leakage, a definite diagnosis of subretinal neovascularization can be challenging using FA. Previous reports using conventional OCTA have described vessel rarefication of the deeper vascular plexuses.31–33 En face PR-OCTA clearly delineates subretinal neovascularization (Fig. 7D), while cross-sectional PR-OCTA reveals the vertical course of right-angle veins (arrow in Fig. 7C).
Figure 7. 55-year-old woman with macular telangiectasia type 2 in the left eye.
(A), Fluorescein angiography reveals leakage temporal to the fovea. Green box indicates 3×3mm region imaged by projection-resolved optical coherence tomography angiography (PR-OCTA), and yellow line corresponds to cross-sectional scans. (B), Cross-sectional conventional OCTA illustrates projection of superficial angiographic signal into deeper layers. (C), PR-OCTA visualizes the course of a right-angle venule (white arrow) and the subretinal neovascular complex, also seen en face in the outer retina (D). PR-OCTA of the individual plexuses (E, F, G) reveal vascular rarefication temporal to the fovea and a diving venule (white arrow in E).
Particularly in the face of complex alterations to retinal architecture and the need for cross-sectional scans, PR-OCTA promises to be a valuable tool in understanding the vascular morphology of macular telangiectasia. Further investigations may demonstrate its utility in characterizing the progression and complications of disease.
Characterization of retinitis pigmentosa
Retinitis pigmentosa (RP) is a heterogeneous inherited retinal dystrophy with a worldwide prevalence of approximately 1 in 4000.34,35 Photoreceptor degeneration results in progressive loss of night vision and peripheral visual field. Fundus examination characteristically reveals pigmented bone-spicule deposits in the peripheral retina, waxy pallor of the optic nerve, and vascular attenuation.34 Hemodynamic studies employing laser Doppler velocimetry or magnetic resonance imaging have demonstrated grossly decreased retinal blood flow compared to healthy eyes.36,37
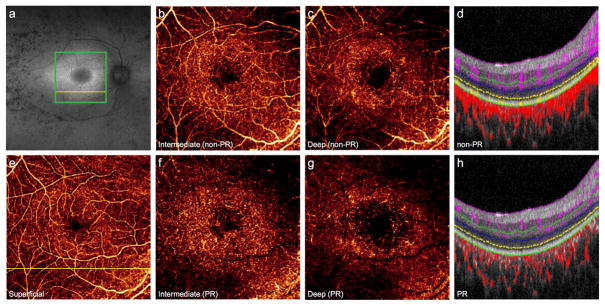
Conventional OCTA has demonstrated increased intercapillary spaces in eyes affected by RP.38 PR-OCTA reveals additional capillary loss, particularly in the ICP and DCP outside the fovea (Fig. 8F–H). Evaluation of the retinal vascular layers using PR-OCTA may augment a multimodal imaging approach in detecting early changes in affected families, assessing disease severity, and monitoring progression. Detailed in vivo assessment of vascular layer disruption may aid in characterizing the retinal degenerative process. Moreover, quantification of vascular degeneration may serve as an endpoint in future gene- or stem cell-based clinical trials.39,40
Figure 8. 26-year-old woman with autosomal recessive retinitis pigmentosa complicated by cystoid macular edema in the right eye.
(A), Fundus autofluorescence reveals a perifoveal hyperautofluorescent ring and regions of hypoautofluorescence in the periphery. Green box indicates 6×6mm region imaged by optical coherence tomography angiography (OCTA), and the yellow lines correspond to cross-sectional scans. Projection-resolved (PR) OCTA shows prominent vessel loss in the intermediate (F) and deep plexuses (G) that is less visible by conventional OCTA (B, C) due to projection artifacts from the superficial layer (E). Vascular loss of the deeper plexuses is noted on cross-sectional OCTA (D) and more prominent on PR-OCTA (H).
Discussion
The human retina offers a unique opportunity to study blood vessels in vivo. Without externally injected dye, OCTA visualizes retinal vessels using the variance in reflectivity secondary to blood cell movement. The 3D capabilities of OCTA open the possibility of evaluating the multi-layered retinal vasculature, not previously possible with dye-based, 2D angiography. However, projection artifacts confound the interpretation of the 3D vascular networks. By resolving the ambiguity between projection artifacts and in situ flow, PR-OCTA visualizes capillary dilation, nonperfusion, neovascularization, and axial vessels with clarity in the individual vascular plexuses in 3 dimensions. This advanced technique can facilitate clinical diagnosis and further our understanding of the wide variety of retinal vascular diseases.
Histopathologic evaluation of the retina has revealed the presence of multiple interconnected vascular plexuses.3 The long radial capillaries in the nerve fiber layer, found primarily in the peripapillary region, together with the branching vascular network in the retinal ganglion cell layer and superficial IPL, comprise the SVC. The ICP and DCP are networks of uniform capillaries in laminar configuration concentrated at the inner and outer borders of the INL, respectively. Axial interconnecting vessels bridge these three vascular networks. The outer retina is avascular in healthy eyes.
Projection artifacts have limited the OCTA visualization of the ICP and DCP as well as pathologic vessels of the outer retina. These artifacts also impede observations about vessels that travel in axial orientation with the retina, which are critical in conditions such as RAP and macular telangiectasia. Previous efforts to minimize projection artifact from OCTA have had significant limitations. One such approach is slab subtraction, which relies on the subtraction of superficial signal from deeper en face slabs.41–43 Compared to slab subtraction methodologies, PR-OCTA has several noteworthy advantages. First, unlike slab subtraction, PR-OCTA does not require prior segmentation of the retinal layers, which may be problematic particularly in cases of alterations in structural reflectivity, such as in RAO, or pathologically distorted architecture, as in RP or neovascular AMD. Also, by preserving the full decorrelation values of regions determined to contain in situ flow, PR-OCTA can often maintain the vascular continuity of the deeper vessels. Furthermore, while slab subtraction is only applicable to en face views, PR-OCTA resolves projection at the level of single volumetric pixels, allowing interpretation of flow with respect to retinal layers on cross-sectional scans.
Another approach to reduce projection artifacts has focused on the alteration of slab boundaries.44,45 Some attenuation of projection artifacts is possible by carefully selecting a slab that is more posterior from the known histologic location of the vascular plexus. However, this method introduces a new uncertainty to the interpretation of resulting images. The comparative advantage of PR-OCTA is that it does not assume a certain configuration of plexuses within its algorithm, and yet its application yields results in better agreement with histologic findings.
In contrast to the above-mentioned slab-based algorithms, only an approach such as PR-OCTA that deals with the artifacts in the whole volume without reference to specific slabs can reveal axial vessels. Approaches that reduce projection within specific slabs of en face angiograms cannot distinguish axial tails of projection artifacts from in situ diving vessels of macular telangiectasia, RAP or interconnecting vessels between the laminar vascular plexuses.
It can be observed that by removing tail artifact, the apparent continuity of true vertical vessels may be diminished. However, simultaneous elimination of surrounding projection artifact ensures these vessels are readily identifiable.
While PR-OCTA permits visualization of three distinct plexuses at the macula, laminar structures, which are used for segmentation algorithms, thin close to the foveal pit. However, the circumfoveal capillary ring is a single layer of vessels, and thus no additional information can be gleaned from PR-OCTA at the edge of the foveal avascular zone.
There remain some limitations to PR-OCTA. The current projection resolution algorithm functions well for small vessels but may retain some projection artifacts beneath large caliber superficial vessels due to the greater and more variable disturbances in angiographic signal. Further optimization based on experimental calibration and computational simulation may improve the algorithm. In addition, the utility of PR-OCTA, as with standard OCTA, is restricted by the relatively small scan size (3mm × 3mm or 6mm × 6mm). Larger angiograms may be obtainable by higher speed OCT systems or montaged scans, which would also be conducive to application of the PR-OCTA algorithm.
In summary, this noninvasive analysis of distinct retinal vascular plexuses and neovascularization is widely applicable to various diseases of the retina. PR-OCTA may facilitate disease diagnosis, assist in monitoring the response to therapy, and enhance our understanding of disease pathology and progression. Moreover, it enables further development of quantitative biomarkers of disease, and stands to be a powerful tool for research and clinical practice.
Acknowledgments
Financial Support: This work was supported by National Institutes of Health (Bathesda, MD) grants R01EY027833, DP3 DK104397, R01 EY024544, R01 EY023285, and P30 EY010572; by unrestricted departmental funding; by the William & Mary Greve Special Scholar Award from Research to Prevent Blindness (New York, NY); and by the National Natural Science Foundation of China under Grant No. 81501544. The funding organizations had no role in the design or conduct of this research.
Footnotes
Conflicts of Interest: Oregon Health & Science University (OHSU), D.H., and Y.J. have a significant financial interest in Optovue, Inc, a company that may have a commercial interest in the results of this research and technology. D.H. also has a financial interest in Carl Zeiss Meditec. These potential conflicts of interest have been reviewed and managed by OHSU. The other authors have no proprietary or commercial interest in any materials discussed in this article.
Publisher's Disclaimer: This is a PDF file of an unedited manuscript that has been accepted for publication. As a service to our customers we are providing this early version of the manuscript. The manuscript will undergo copyediting, typesetting, and review of the resulting proof before it is published in its final citable form. Please note that during the production process errors may be discovered which could affect the content, and all legal disclaimers that apply to the journal pertain.
References
- 1.Jia Y, Bailey ST, Hwang TS, et al. Quantitative optical coherence tomography angiography of vascular abnormalities in the living human eye. Proc Natl Acad Sci U S A. 2015;112(18):E2395–2402. doi: 10.1073/pnas.1500185112. [DOI] [PMC free article] [PubMed] [Google Scholar]
- 2.Zhang M, Hwang TS, Campbell JP, et al. Projection-resolved optical coherence tomographic angiography. Biomed Opt Express. 2016;7(3):816–828. doi: 10.1364/BOE.7.000816. [DOI] [PMC free article] [PubMed] [Google Scholar]
- 3.Chan G, Balaratnasingam C, Yu PK, et al. Quantitative morphometry of perifoveal capillary networks in the human retina. Invest Ophthalmol Vis Sci. 2012;53(9):5502–5514. doi: 10.1167/iovs.12-10265. [DOI] [PubMed] [Google Scholar]
- 4.Jia Y, Tan O, Tokayer J, et al. Split-spectrum amplitude-decorrelation angiography with optical coherence tomography. Opt Express. 2012;20(4):4710–4725. doi: 10.1364/OE.20.004710. [DOI] [PMC free article] [PubMed] [Google Scholar]
- 5.Kraus MF, Potsaid B, Mayer MA, et al. Motion correction in optical coherence tomography volumes on a per A-scan basis using orthogonal scan patterns. Biomed Opt Express. 2012;3(6):1182–1199. doi: 10.1364/BOE.3.001182. [DOI] [PMC free article] [PubMed] [Google Scholar]
- 6.Camino A, Zhang M, Gao SS, et al. Evaluation of artifact reduction in optical coherence tomography angiography with real-time tracking and motion correction technology. Biomed Opt Express. 2016;7(10):3905–3915. doi: 10.1364/BOE.7.003905. [DOI] [PMC free article] [PubMed] [Google Scholar]
- 7.Zhang M, Wang J, Pechauer AD, et al. Advanced image processing for optical coherence tomographic angiography of macular diseases. Biomed Opt Express. 2015;6(12):4661–4675. doi: 10.1364/BOE.6.004661. [DOI] [PMC free article] [PubMed] [Google Scholar]
- 8.Kiel J. The Ocular Circulation. San Rafael, CA: Morgan & Claypool Life Sciences; 2010. [PubMed] [Google Scholar]
- 9.Classification of diabetic retinopathy from fluorescein angiograms. ETDRS report number 11. Early Treatment Diabetic Retinopathy Study Research Group. Ophthalmology. 1991;98(5 Suppl):807–822. [PubMed] [Google Scholar]
- 10.Fluorescein angiographic risk factors for progression of diabetic retinopathy. ETDRS report number 13. Early Treatment Diabetic Retinopathy Study Research Group. Ophthalmology. 1991;98(5 Suppl):834–840. [PubMed] [Google Scholar]
- 11.Hwang TS, Jia Y, Gao SS, et al. Optical Coherence Tomography Angiography Features of Diabetic Retinopathy. Retina. 2015;35(11):2371–2376. doi: 10.1097/IAE.0000000000000716. [DOI] [PMC free article] [PubMed] [Google Scholar]
- 12.Hwang TS, Gao SS, Liu L, et al. Automated Quantification of Capillary Nonperfusion Using Optical Coherence Tomography Angiography in Diabetic Retinopathy. JAMA Ophthalmol. 2016;134(4):367–373. doi: 10.1001/jamaophthalmol.2015.5658. [DOI] [PMC free article] [PubMed] [Google Scholar]
- 13.Zhang M, Hwang TS, Dongye C, Wilson DJ, Huang D, Jia Y. Automated Quantification of Nonperfusion in Three Retinal Plexuses Using Projection-Resolved Optical Coherence Tomography Angiography in Diabetic Retinopathy. Invest Ophthalmol Vis Sci. 2016;57(13):5101–5106. doi: 10.1167/iovs.16-19776. [DOI] [PMC free article] [PubMed] [Google Scholar]
- 14.Hwang TS, Zhang M, Bhavsar K, et al. Projection-resolved optical coherence tomography angiography visualizes capillary nonperfusion in three distinct retinal plexuses in diabetic retinopathy. JAMA Ophthalmol. 2016 doi: 10.1001/jamaophthalmol.2016.4272. [DOI] [PMC free article] [PubMed] [Google Scholar]
- 15.Cheung N, Klein R, Wang JJ, et al. Traditional and novel cardiovascular risk factors for retinal vein occlusion: the multiethnic study of atherosclerosis. Invest Ophthalmol Vis Sci. 2008;49(10):4297–4302. doi: 10.1167/iovs.08-1826. [DOI] [PMC free article] [PubMed] [Google Scholar]
- 16.Freund KB, Sarraf D, Mieler WF, Yannuzzi LA. The Retinal Atlas. 2. Elsevier; 2016. [Google Scholar]
- 17.Coscas F, Glacet-Bernard A, Miere A, et al. Optical Coherence Tomography Angiography in Retinal Vein Occlusion: Evaluation of Superficial and Deep Capillary Plexa. Am J Ophthalmol. 2016;161:160–171. doi: 10.1016/j.ajo.2015.10.008. [DOI] [PubMed] [Google Scholar]
- 18.Mastropasqua R, Di Antonio L, Di Staso S, et al. Optical Coherence Tomography Angiography in Retinal Vascular Diseases and Choroidal Neovascularization. J Ophthalmol. 2015;2015 doi: 10.1155/2015/343515. [DOI] [PMC free article] [PubMed] [Google Scholar]
- 19.Bonini Filho MA, Adhi M, de Carlo TE, et al. Optical Coherence Tomography Angiography in Retinal Artery Occlusion. Retina. 2015;35(11):2339–2346. doi: 10.1097/IAE.0000000000000850. [DOI] [PubMed] [Google Scholar]
- 20.de Castro-Abeger AH, de Carlo TE, Duker JS, Baumal CR. Optical Coherence Tomography Angiography Compared to Fluorescein Angiography in Branch Retinal Artery Occlusion. Ophthalmic Surg Lasers Imaging Retina. 2015;46(10):1052–1054. doi: 10.3928/23258160-20151027-12. [DOI] [PubMed] [Google Scholar]
- 21.Philippakis E, Dupas B, Bonnin P, Hage R, Gaudric A, Tadayoni R. Optical Coherence Tomography Angiography Shows Deep Capillary Plexus Hypoperfusion in Incomplete Central Retinal Artery Occlusion. Retin Cases Brief Rep. 2015;9(4):333–338. doi: 10.1097/ICB.0000000000000211. [DOI] [PubMed] [Google Scholar]
- 22.Friedman DS, O’Colmain BJ, Munoz B, et al. Prevalence of age-related macular degeneration in the United States. Arch Ophthalmol. 2004;122(4):564–572. doi: 10.1001/archopht.122.4.564. [DOI] [PubMed] [Google Scholar]
- 23.Bressler NM. Age-related macular degeneration is the leading cause of blindness. JAMA. 2004;291(15):1900–1901. doi: 10.1001/jama.291.15.1900. [DOI] [PubMed] [Google Scholar]
- 24.Freund KB, Zweifel SA, Engelbert M. Do we need a new classification for choroidal neovascularization in age-related macular degeneration? Retina. 2010;30(9):1333–1349. doi: 10.1097/IAE.0b013e3181e7976b. [DOI] [PubMed] [Google Scholar]
- 25.Ying GS, Huang J, Maguire MG, et al. Baseline predictors for one-year visual outcomes with ranibizumab or bevacizumab for neovascular age-related macular degeneration. Ophthalmology. 2013;120(1):122–129. doi: 10.1016/j.ophtha.2012.07.042. [DOI] [PMC free article] [PubMed] [Google Scholar]
- 26.Jia Y, Bailey ST, Wilson DJ, et al. Quantitative optical coherence tomography angiography of choroidal neovascularization in age-related macular degeneration. Ophthalmology. 2014;121(7):1435–1444. doi: 10.1016/j.ophtha.2014.01.034. [DOI] [PMC free article] [PubMed] [Google Scholar]
- 27.Yannuzzi LA, Negrao S, Iida T, et al. Retinal angiomatous proliferation in age-related macular degeneration. Retina. 2001;21(5):416–434. doi: 10.1097/00006982-200110000-00003. [DOI] [PubMed] [Google Scholar]
- 28.Yannuzzi LA, Freund KB, Takahashi BS. Review of retinal angiomatous proliferation or type 3 neovascularization. Retina. 2008;28(3):375–384. doi: 10.1097/IAE.0b013e3181619c55. [DOI] [PubMed] [Google Scholar]
- 29.Amarakoon S, de Jong JH, Braaf B, et al. Phase-Resolved Doppler Optical Coherence Tomographic Features in Retinal Angiomatous Proliferation. Am J Ophthalmol. 2015;160(5):1044–1054. e1041. doi: 10.1016/j.ajo.2015.07.026. [DOI] [PubMed] [Google Scholar]
- 30.Charbel Issa P, Gillies MC, Chew EY, et al. Macular telangiectasia type 2. Prog Retin Eye Res. 2013;34:49–77. doi: 10.1016/j.preteyeres.2012.11.002. [DOI] [PMC free article] [PubMed] [Google Scholar]
- 31.Spaide RF, Klancnik JM, Jr, Cooney MJ. Retinal vascular layers in macular telangiectasia type 2 imaged by optical coherence tomographic angiography. JAMA Ophthalmol. 2015;133(1):66–73. doi: 10.1001/jamaophthalmol.2014.3950. [DOI] [PubMed] [Google Scholar]
- 32.Zhang Q, Wang RK, Chen CL, et al. Swept Source Optical Coherence Tomography Angiography of Neovascular Macular Telangiectasia Type 2. Retina. 2015;35(11):2285–2299. doi: 10.1097/IAE.0000000000000840. [DOI] [PMC free article] [PubMed] [Google Scholar]
- 33.Chidambara L, Gadde SG, Yadav NK, et al. Characteristics and quantification of vascular changes in macular telangiectasia type 2 on optical coherence tomography angiography. Br J Ophthalmol. 2016 doi: 10.1136/bjophthalmol-2015-307941. [DOI] [PubMed] [Google Scholar]
- 34.Hartong DT, Berson EL, Dryja TP. Retinitis pigmentosa. Lancet. 2006;368(9549):1795–1809. doi: 10.1016/S0140-6736(06)69740-7. [DOI] [PubMed] [Google Scholar]
- 35.Haim M. Epidemiology of retinitis pigmentosa in Denmark. Acta Ophthalmol Scand Suppl. 2002;(233):1–34. doi: 10.1046/j.1395-3907.2002.00001.x. [DOI] [PubMed] [Google Scholar]
- 36.Grunwald JE, Maguire AM, Dupont J. Retinal hemodynamics in retinitis pigmentosa. Am J Ophthalmol. 1996;122(4):502–508. doi: 10.1016/s0002-9394(14)72109-9. [DOI] [PubMed] [Google Scholar]
- 37.Zhang Y, Harrison JM, Nateras OS, Chalfin S, Duong TQ. Decreased retinal-choroidal blood flow in retinitis pigmentosa as measured by MRI. Doc Ophthalmol. 2013;126(3):187–197. doi: 10.1007/s10633-013-9374-1. [DOI] [PMC free article] [PubMed] [Google Scholar]
- 38.de Carlo TE, Adhi M, Salz DA, et al. Analysis of Choroidal and Retinal Vasculature in Inherited Retinal Degenerations Using Optical Coherence Tomography Angiography. Ophthalmic Surg Lasers Imaging Retina. 2016;47(2):120–127. doi: 10.3928/23258160-20160126-04. [DOI] [PMC free article] [PubMed] [Google Scholar]
- 39.Zheng A, Li Y, Tsang SH. Personalized therapeutic strategies for patients with retinitis pigmentosa. Expert Opin Biol Ther. 2015;15(3):391–402. doi: 10.1517/14712598.2015.1006192. [DOI] [PMC free article] [PubMed] [Google Scholar]
- 40.Ku CA, Pennesi ME. Retinal Gene Therapy: Current Progress and Future Prospects. Expert Rev Ophthalmol. 2015;10(3):281–299. doi: 10.1586/17469899.2015.1035711. [DOI] [PMC free article] [PubMed] [Google Scholar]
- 41.Huang D, Jia Y, Gao SS. Interpretation of Optical Coherence Tomography Angiography. In: Lumbroso B, Huang D, Chen CJ, et al., editors. Clinical OCT Angiography Atlas. New Delhi: Jaypee Brothers Medical Publishers; 2015. pp. 8–14. [Google Scholar]
- 42.Zhang A, Zhang Q, Wang RK. Minimizing projection artifacts for accurate presentation of choroidal neovascularization in OCT micro-angiography. Biomed Opt Express. 2015;6(10):4130–4143. doi: 10.1364/BOE.6.004130. [DOI] [PMC free article] [PubMed] [Google Scholar]
- 43.Liu L, Gao SS, Bailey ST, Huang D, Li D, Jia Y. Automated choroidal neovascularization detection algorithm for optical coherence tomography angiography. Biomed Opt Express. 2015;6(9):3564–3576. doi: 10.1364/BOE.6.003564. [DOI] [PMC free article] [PubMed] [Google Scholar]
- 44.Spaide RF, Fujimoto JG, Waheed NK. Image Artifacts in Optical Coherence Tomography Angiography. Retina. 2015;35(11):2163–2180. doi: 10.1097/IAE.0000000000000765. [DOI] [PMC free article] [PubMed] [Google Scholar]
- 45.Park JJ, Soetikno BT, Fawzi AA. Characterization of the Middle Capillary Plexus Using Optical Coherence Tomography Angiography in Healthy and Diabetic Eyes. Retina. 2016:19. doi: 10.1097/IAE.0000000000001077. [DOI] [PMC free article] [PubMed] [Google Scholar]


