

Abstract
The rising incidence of obesity requires the reevaluation of our current therapeutic strategies to optimize patient outcomes. The objective of this study was to determine if compositional and functional characteristics of the gut microbiota in adults predict responses to a comprehensive lifestyle intervention program in overweight and obese adults. We recruited 26 participants from the Mayo Clinic Obesity Treatment Research Program between August and September 2013 to participate in a lifestyle intervention program for weight loss. Adults aged 18 – 65 years with a BMI of 27 – 39.9 kg/m2 and able to provide informed consent were included in the study. Fecal samples were obtained at baseline after 3 months. Loss of at least 5% of baseline weight after 3 months was defined as success. Clinical features and gut microbial composition and function were compared between those who achieved at least 5% and less than 5% weight loss. After 3 months, 9 of out 26 subjects lost at least 5% of their weight. Mean weight loss in the success group was 7.89 kg (95% CI: 6.46 – 9.32) and 1.51 kg (95% CI: 0.52 – 2.49) in the less than 5% weight loss group. Increased abundance of Phascolarctobacterium was associated with success. In contrast, increased abundance of Dialister and of genes encoding gut microbial carbohydrate-active enzymes were associated with failure to lose 5% body weight. A gut microbiota with increased capability for carbohydrate metabolism appears to be associated with decreased weight loss in overweight and obese patients undergoing a lifestyle intervention program.
Obesity is a chronic disease that is increasing in prevalence around the world and is now considered a global epidemic. Obesity, as measured by body mass index (BMI) of 30 kg/m2 or greater, has been consistently associated with increased all-cause mortality.1
A comprehensive lifestyle intervention is usually the first step for achieving weight loss. A weight loss of just 5 percent through a combination of dietary restrictions, physical exercise, and behavioral therapy is effective in achieving better glycemic control and preventing diabetes.2,3 However, there is marked inter-individual variability in the success of this approach that has often been attributed to patient compliance.4
The pathophysiology of obesity is complex, with contributions from host genes as well as environmental factors.5 Recent evidence suggests that the human gut microbiome has a role in the pathophysiology of obesity by influencing host energy metabolism, adiposity,6 neuroendocrine signaling, and insulin sensitivity.7 Hence, the gut microbiome may be responsible in part for the inter-individual differences in outcomes of obesity-directed interventions. In this study, we report potential microbial markers that predict responses to a comprehensive lifestyle intervention program for weight loss.
Methods
Patient selection
Patients were recruited between August and September 2013 from the Mayo Clinic Obesity Treatment Research Program. Adults aged 18 – 65 years with a BMI of 27 – 39.9 kg/m2 and able to provide informed consent were included in the study. The exclusion criteria included health problems that prevented individuals from engaging in physical activity, previous surgeries for managing obesity (bariatric procedures, gastric bypass surgery), concurrent participation in another weight loss program, and use of weight loss medications with the previous 30 days. Participants with any use of antibiotics within the previous 30 days were also excluded from the analysis. Other medications, such as proton pump inhibitors, laxatives, statins, and analgesics were allowed. None of the included participants were taking probiotics.
Study interventions
The Mayo Clinic Obesity Treatment Research Program is a 12-month comprehensive lifestyle intervention program. During the first 3 months, participants were followed through weekly one hour sessions, biweekly in the fourth month, and monthly thereafter until 12 months. To minimize the impact of participant non-compliance on the results, we selected the first 3 months as the timeframe of our study. The nutritional intervention involved a volumetric approach8 that included larger amounts of fruits, vegetables and low energy density foods with lesser intake of foods with greater nutrient density. The goal was to reduce energy intake while achieving a high food intake volume.
The physical activity intervention involved recommendations to walk at least 10,000 steps per day or its equivalent. Physical activity was monitored using a pedometer with 7-day memory. Patients were instructed to wear the pedometer every day and review their step count data to assess progress towards the goal.
The behavioral intervention was given in weekly group sessions and included elements such as self-monitoring, managing expectations, goal setting, stimulus control, stress reduction, problem solving, social support, cognitive restructuring, and relapse prevention. The general outline of the sessions was based upon the Look AHEAD protocol.9
Outcome measures and data processing
Clinical, biochemical, and demographic information was collected from patients at baseline and after 3 months including age, sex, race, weight, height, BMI, smoking status, hypertension, pre-diabetes, type 2 diabetes, fasting blood glucose, high-density lipoprotein levels, low-density lipoprotein levels, and triglyceride levels. The percent weight loss after 3 months was calculated based on the participant’s baseline body weight. A 5% or greater weight loss after 3 months was defined as success. Fecal stool samples were collected at baseline and after 3 months.
DNA isolation from stool samples was performed using the Mo Bio PowerSoil® DNA Isolation Kit (Mo Bio Laboratories; Carlsbad, CA) following bead beating. The V4 variable region of bacterial 16S rRNA was amplified from stool DNA and sequenced with the MiSeq Illumina platform. Compositional and diversity data analysis was done using Quantitative Insights into Microbial Ecology (QIIME 1.9.1) pipeline.10
Predictive functional profiling from 16 rRNA was performed using the Phylogenetic Investigation of Communities by Reconstruction of Unobserved States (PICRUSt) pipeline.11 Gene content was predicted against the following databases: the Kyoto Encyclopedia of Genes and Genomes (KEGG) database,12 the Clusters of Orthologous Groups (COG) database,13 and the Carbohydrate-Active Enzymes (CAZy) database.14 The linear discriminant analysis (LDA) effect size (LEfSe) method15 was performed to identify predictive compositional and functional biomarkers for weight loss. An alpha of 0.05 and a LDA threshold of >2.0 were used.
Statistical analysis
Statistical analysis was performed using JMP Pro 12 software (SAS Institute; Cary, NC) and the QIIME pipeline. Two-sided Wilcoxon rank-sum tests were used to compare baseline differences in bacterial composition and alpha diversity, while permanova was used for beta diversity. For interval changes in bacterial composition and diversity between baseline and after 3 months, two-sided Wilcoxon signed-rank tests were used. A P value of 0.05 or less was considered statistically significant for all tests.
Results
Clinical features do not predict response to lifestyle intervention
47 participants volunteered for the study. 26 of 47 participants (55%) were included in the analysis and 21 participants were excluded for the following reasons: did not return at least one of their stool samples, (16) did not return their stool samples on time, hence not representative of their baseline gut microbiota, (3) insufficient stool sample for analysis, (1) or dropped from the study.(1) Excluded patients were not significantly different from included patients in terms of age (P=.30), sex (P=.73), and race (P=1.0).
Of the 26 participants included in the analysis, 4 were overweight and 22 were obese. The mean age of all participants was 53.5 years (95% CI: 50.3 – 56.8) with 81% of participants being female. Average weight at baseline was 95.7 kg (95% CI: 90.0 - 101.4) and average BMI at baseline was 34.1 kg/m2 (95% CI: 32.6 - 35.8). At 3 months, the mean weight loss was 3.71 kg (95% CI: 2.31 - 5.11) and the mean reduction in BMI was 1.27 (95% CI: 0.69 - 1.87), with 9 subjects (35%, 95% CI: 19% - 54%) achieving at least a 5% weight loss in 3 months. There was no significant difference in the proportion of participants who achieved at least a 5% weight loss compared to those who did not. Participants who lost at least 5% of their weight lost an average of 7.89 kg (95% CI: 6.46 – 9.32) and those who lost less than 5% of their baseline weight lost an average of 1.51 kg (95% CI: 0.52 – 2.49). After 6 months, a total of 8 out of the 9 participants who lost at least 5% of their baseline weight at 3 months maintained the weight loss. 2 of these 8 participants were able to achieve a 10% weight loss after 6 months. A comparison of baseline clinical, biochemical, and demographic characteristics between subjects at 3 months is shown in Table 1. There were no significant differences in these variables at baseline or at 3 months between the success and failure groups. There were also no associations with success at 3 months.
Table 1:
Distribution of baseline demographic and clinical characteristics
| ≥5% weight loss (n = 9) | <5% weight loss (n = 17) | Univariate OR (95% CI) | P value | |
|---|---|---|---|---|
| Age | 51.1 (43.1 – 59.1) | 54.8 (51.5 – 58.2) | 0.94 (0.84 – 1.04) | 0.25 |
| Sex, female (%) | 8 (89) | 13 (76) | 2.46 (0.29 – 52.81) | 0.63 |
| Race (%) | White: 9 (100) | White: 16 (94) Asian: 1 (6) |
0 | 1.00 |
| Weight, kg | 99.0 (86.9 – 111.1) | 94.0 (87.1 – 100.9) | 1.03 (0.97 – 1.10) | 0.39 |
| Height, cm | 169.5 (162.5 – 176.5) | 166.1 (161.2 – 171.2) | 1.04 (0.95 – 1.14) | 0.38 |
| BMI | 34.3 (31.4 – 37.3) | 34.0 (32.1 – 35.9) | 1.03 (0.82 – 1.31) | 0.81 |
| Smoking (%) | 1 (11) | 1 (6) | 0.50 (0.03 – 9.08) | 1.00 |
| Hypertension | 4 (44) | 5 (29) | 1.92 (0.35 – 10.70) | 0.67 |
| Fasting glucose | 94 (89 – 100) | 103 (96 – 110) | 0.91 (0.80 – 1.00) | 0.05 |
| Pre-diabetes (%) | 4 (44) | 9 (53) | 0.71 (0.13 – 3.62) | 0.68 |
| Type 2 diabetes (%) | 0 | 2 (12) | 0 | 0.53 |
| HDL | 53.0 (40.2 – 65.8) | 58.5 (50.19 – 66.7) | 0.98 (0.92 – 1.03) | 0.40 |
| LDL | 118.6 (100.5 – 136.6) | 125.0 (104.3 – 145.8) | 0.99 (0.97 – 1.02) | 0.64 |
| Triglycerides | 145.6 (86.8 – 204.3) | 170.6 (127.42 – 213.8 | 1.00 (0.98 – 1.01) | 0.43 |
BMI = body mass index; HDL = high density lipoprotein; LDL = low-density lipoprotein; OR = odds ratio
Compositional differences within the Veillonellaceae family at baseline were associated with ≥5% weight loss
Microbial compositional analysis using LEfSe identified 2 members of gut microbiota that were significantly different between the groups. Phascolarctobacterium was significantly increased at baseline in subjects that lost at least a 5% weight loss after 3 months (LDA 2.09, P=.008) and Dialister was significantly increased in those with less than 5% weight loss (LDA −2.07, P=.03). (Figure 1).
FIGURE 1.
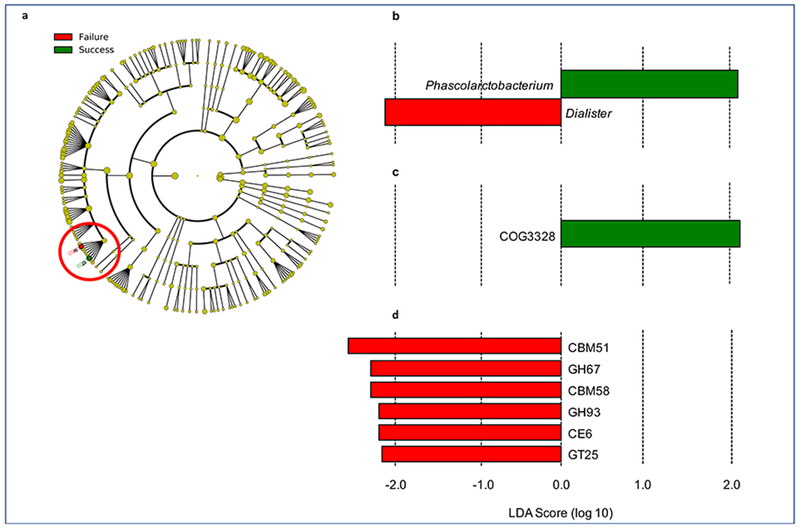
Linear discriminant analysis effect size analysis results showing baseline compositional and functional features that are predictive of at least 5% weight loss (success = blue) or less than 5% weight loss (failure = orange) after 3 months. A, Cladogram showing the location of the Veillonellaceae family containing Phascolarctobacterium (b, blue) and Dialister (a, orange) within the phylogenetic tree. B, LDA scores for the 2 identified bacterial biomarkers of weight loss. C, Increased abundance of a transposase (COG3328) predicts at least 5% weight loss. D, Increased abundance of 6 carbohydrate-active enzymes and binding proteins were predictive of losing less than 5% of baseline weight. LDA = linear discriminant analysis.
A gut microbiota with increased capacity for carbohydrate metabolism at baseline was associated with failure to lose ≥5% of baseline weight
We imputed gut microbiota functionality from compositional data using PICRUSt (Table 2). The abundance of predicted genes was then analyzed through LEfSe to identify biomarkers of weight loss. We identified a gene encoding a transposase (COG3328) that was predictive of success (Figure 1c). We also identified 6 bacterial genes encoding carbohydrate-active enzymes and binding proteins that were predictive of less than 5% weight loss after 3 months. These included two glycoside hydrolase families (GH67 and GH93), two carbohydrate-binding module families (CBM51 and CBM58), a carbohydrate esterase family (CE6), and a glycosyltransferase family (GT25) (Figure 1d).
Table 2:
Carbohydrate-active enzymes and proteins found to be predictive of responses to a 3-month lifestyle intervention
| Carbohydrate-active enzymes associated with failure to lose 5% of weight in 3 months | |
|---|---|
| Reference database identifier | Function |
| CBM51 | Carbohydrate-binding module: binds blood group A and B antigens |
| GH67 | Glycoside hydrolase |
| CBM58 | Carbohydrate-binding module: notable member is SusG, an α-amylase |
| GH93 | Glycoside hydrolase |
| CE6 | Carbohydrate esterase |
| GT25 | Glycosyltransferase |
SusG = starch utilization system G
Baseline gut microbial diversity is similar regardless of achieved weight loss after 3 months
Analysis of baseline gut microbial diversity between subjects in the two groups showed no significant differences in alpha diversity (observed OTUs, Shannon index, and Chaol metrics) or (beta diversity (Bray-Curtis dissimilarity, unweighted and weighted UniFrac).
No observed change in gut microbial composition and diversity after 3-month intervention
To determine if weight loss during a lifestyle intervention program led to changes in gut microbiota composition, we analyzed interval changes in gut microbial composition and diversity after 3 months. There were no significant changes in alpha diversity (observed OTUs, Shannon index, and Chao1 metrics) or beta diversity (Bray-Curtis dissimilarity, unweighted and weighted UniFrac) or bacterial composition in either group of patients.
Discussion
In this study, we identified compositional and predicted functional bacterial profiles that were associated with >5% weight loss responses in overweight and obese adults undergoing a lifestyle intervention program. Increased baseline abundance of Phascolarctobacterium was associated with a weight loss of at least 5%, while increased abundance of Dialister was associated with a weight loss of less than 5%. Interestingly, both genera belong to the Veillonellaceae family, which suggests that compositional shifts within this family may have a role in host energy metabolism. We also found that increased abundance of several carbohydrate metabolizing enzymes was associated with outcomes.
Phascolarctobacterium is a relatively abundant genus of bacteria in the human gastrointestinal tract.16 In terms of its role in energy metabolism and obesity, a previous study with obese rats showed that increased abundance of Phascolarctobacterium correlated positively with body weight gain, fat mass, plasma leptin, increased triglyceride concentrations, and increased glucose tolerance17 after receiving a high fat diet. Interestingly, while Phascolarctobacterium is associated with obesity in previous reports, our study suggests that it may potentiate the effect of lifestyle and dietary interventions on weight loss.
On the other hand, Dialister is a pathogenic genus of bacteria associated with oral infections, such as periodontitis, gingivitis, and dentoalveolar abscesses.18–20 However, the role that Dialister may have in energy expenditure and metabolism is unknown. The fact that both belong to the same family suggests that there might be a nutritional niche competition by which Dialister excludes Phascolarctobacterium. Despite these compositional findings, we were unable to detect significant differences in alpha or beta diversity between both groups of participants. However, the functional differences associated with carbohydrate metabolism may have a greater role in influencing weight loss than shifts in microbial diversity. However future studies are needed to validate these findings and better understand a role for these genera in energy metabolism.
Functional analyses using the CAZY database showed that participants who achieved less than 5% weight loss had significantly increased abundances of enzymes involved in carbohydrate metabolism. CBMs are polypeptides that bind carbohydrate substrates and facilitate enzymatic reactions, such as those of GHs, by holding the enzyme close to the substrate. CBM51 is a family of diverse carbohydrate-binding molecules known to bind blood group A and B antigens21 and CBM58 is characterized by the starch utilization system G (SusG), an α-amylase essential for starch degradation. SusG is part of the Sus protein group that work together in polysaccharide recognition and import into bacterial cells.22 The GHs present in human gut microbiota are essential for digesting carbohydrates which humans cannot process. GH67 and GH93, catalyze the hydrolysis of xylooligosaccharides23 and linear α-1,5-L-arabinan,24 respectively.
This is a pilot study and hence it is limited by a small sample size. Additionally, we limited our analysis to the first three months. While these findings highlight a potential approach to individualizing management for obesity using the gut microbiome, they need to be confirmed in a larger cohort with longitudinal follow-up. The volumetric approach employed in this study as part of the nutritional intervention allows for more dietary variability between participants, which may confound the results, given the known effect of diet on gut microbiome. However, gut microbial differences related to diet have been shown to be significant across different continents, but not between adults from different regions in the United States.25 The participants were largely from the same region, thus we expect that the impact of dietary variability on the gut microbiota between participants to be minimal. Finally, in this preliminary report we present data based on 16S rRNA marker-based approach, but a future study would require metagenomics and metabolomics to confirm functional consequences of the potential differences in carbohydrate metabolism.
Conclusion
An increased abundance of microbial genes encoding carbohydrate-active enzyme pathways and a decreased abundance of Phascolarctobacterium in the gut microbiota of obese and overweight individuals are associated with failure to lose at least 5% weight following a 3-month comprehensive lifestyle intervention program.
Supplementary Material
Acknowledgements
We would like to thank Kim L. Edens, RDN, Bradley Schmidt, and Marcia K. Mahlman, CCRP for their help with the study. We would like to thank Lyndsay Busby for her administrative assistance. We would also like to thank the Mayo Clinic Center for Clinical and Translational Science for their support. This work was supported by NIH DK114007 (PCK), and the Center for Individualized Medicine, Mayo Clinic (PCK).
Financial support and conflict of interest disclosure:
David A. Muñiz Pedrogo: nothing to disclose
Michael D. Jensen: MDJ has received a grant from SFI RESEARCH Pty Ltd.
Joseph A. Murray: JAM has received grant support from the National Institutes of Health, Alvine Pharmaceuticals, and Alba Therapeutics; receives ongoing support from Oberkotter Foundation and Broad Medical Research Program at CCFA; serves on the advisory board of Celimmune, LLC and ImmunogenX; was a consultant to, BioLineRx, GlaxoSmithKline (GSK), Genentech, and Glenmark Pharmaceuticals Ltd; and is a consultant to ImmunosanT, Institute for Protein Design (PvP Biologics), Takeda Pharmaceutical Company, Ltd., Innovate Biopharmaceuticals, Inc., UCB, Inc., and Intrexon.
Jeffrey Woods: Nothing to disclose.
Jun Chen: Nothing to disclose.
Purna C. Kashyap: nothing to disclose. This work was supported by NIH DK114007.
Vandana Nehra: Has received a grant from Alvine Pharmaceuticals.
Abbreviations
- BMI
body mass index
- CAZy
Carbohydrate-Active Enzymes
- CBM
Carbohydrate-binding module
- CI
Confidence interval
- COG
Clusters of Orthologous Groups
- DNA
Deoxyribonucleic acid
- GH
Glycoside hydrolase
- KEGG
Kyoto Encyclopedia of Genes and Genomes
- LDA
Linear discriminant analysis
- LEfSe
Linear discriminant analysis effect size
- OUT
Operational taxonomic unit
- OR
Odds ratio
- PICRUSt
Phylogenetic Investigation of Communities by Reconstruction of Unobserved States
- rRNA
Ribosomal ribonucleic acid
- SCFA
Short chain fatty acid
- SusG
Starch utilization system G
- QIIME
Quantitative Insights into Microbial Ecology
Footnotes
Publisher's Disclaimer: This is a PDF file of an unedited manuscript that has been accepted for publication. As a service to our customers we are providing this early version of the manuscript. The manuscript will undergo copyediting, typesetting, and review of the resulting proof before it is published in its final citable form. Please note that during the production process errors may be discovered which could affect the content, and all legal disclaimers that apply to the journal pertain.
References
- 1.Aune D, Sen A, Prasad M, et al. BMI and all cause mortality: systematic review and non-linear dose-response meta-analysis of 230 cohort studies with 3.74 million deaths among 30.3 million participants. BMJ. 2016;353:i2156. [DOI] [PMC free article] [PubMed] [Google Scholar]
- 2.Knowler WC, Barrett-Connor E, Fowler SE, et al. Reduction in the incidence of type 2 diabetes with lifestyle intervention or metformin. N Engl J Med 2002;346(6):393–403. [DOI] [PMC free article] [PubMed] [Google Scholar]
- 3.Magkos F, Fraterrigo G, Yoshino J, et al. Effects of Moderate and Subsequent Progressive Weight Loss on Metabolic Function and Adipose Tissue Biology in Humans with Obesity. Cell Metab. 2016;23(4):591–601. [DOI] [PMC free article] [PubMed] [Google Scholar]
- 4.Wright TG, Dawson B, Jalleh G, Guelfi KJ. Program compliance, weight loss and health profile changes in WHO obesity classes after very low energy dietary intervention. Global Epidemic Obesity. 2013; 1 (1):4. [Google Scholar]
- 5.Heymsfield SB, Wadden TA. Mechanisms, Pathophysiology, and Management of Obesity. N Engl J Med 2017;376(3):254–266. [DOI] [PubMed] [Google Scholar]
- 6.Fernandes J, Su W, Rahat-Rozenbloom S, Wolever TM, Comelli EM. Adiposity, gut microbiota and faecal short chain fatty acids are linked in adult humans. Nutr Diabetes. 2014;4:e121. [DOI] [PMC free article] [PubMed] [Google Scholar]
- 7.Vrieze A, Van Nood E, Holleman F, et al. Transfer of intestinal microbiota from lean donors increases insulin sensitivity in individuals with metabolic syndrome. Gastroenterology. 2012;143(4):913–916 e917. [DOI] [PubMed] [Google Scholar]
- 8.Ello-Martin JA, Ledikwe JH, Rolls BJ. The influence of food portion size and energy density on energy intake: implications for weight management. Am J Clin Nutr 2005;82(1 Suppl):236S–241S. [DOI] [PubMed] [Google Scholar]
- 9.Look ARG, Wadden TA, West DS, et al. The Look AHEAD study: a description of the lifestyle intervention and the evidence supporting it. Obesity (Silver Spring). 2006;14(5):737–752. [DOI] [PMC free article] [PubMed] [Google Scholar]
- 10.Caporaso JG, Kuczynski J, Stombaugh J, et al. QIIME allows analysis of high-throughput community sequencing data. Nat Methods. 2010;7(5):335–336. [DOI] [PMC free article] [PubMed] [Google Scholar]
- 11.Langille MG, Zaneveld J, Caporaso JG, et al. Predictive functional profiling of microbial communities using 16S rRNA marker gene sequences. Nat Biotechnol 2013;31(9):814–821. [DOI] [PMC free article] [PubMed] [Google Scholar]
- 12.Kanehisa M, Goto S. KEGG: kyoto encyclopedia of genes and genomes. Nucleic Acids Res 2000;28(1):27–30. [DOI] [PMC free article] [PubMed] [Google Scholar]
- 13.Tatusov RL, Galperin MY, Natale DA, Koonin EV. The COG database: a tool for genome-scale analysis of protein functions and evolution. Nucleic Acids Res 2000;28(1):33–36. [DOI] [PMC free article] [PubMed] [Google Scholar]
- 14.Lombard V, Golaconda Ramulu H, Drula E, Coutinho PM, Henrissat B. The carbohydrate-active enzymes database (CAZy) in 2013. Nucleic Acids Res 2014;42(Database issue):D490–495. [DOI] [PMC free article] [PubMed] [Google Scholar]
- 15.Segata N, Izard J, Waldron L, et al. Metagenomic biomarker discovery and explanation. Genome Biol 2011;12(6):R60. [DOI] [PMC free article] [PubMed] [Google Scholar]
- 16.Wu F, Guo X, Zhang J, Zhang M, Ou Z, Peng Y. Phascolarctobacterium faecium abundant colonization in human gastrointestinal tract. Exp Ther Med 2017;14(4):3122–3126. [DOI] [PMC free article] [PubMed] [Google Scholar]
- 17.Lecomte V, Kaakoush NO, Maloney CA, et al. Changes in gut microbiota in rats fed a high fat diet correlate with obesity-associated metabolic parameters. PLoS One 2015; 10(5):e0126931. [DOI] [PMC free article] [PubMed] [Google Scholar]
- 18.Contreras A, Doan N, Chen C, Rusitanonta T, Flynn MJ, Slots J. Importance of Dialister pneumosintes in human periodontitis. Oral Microbiology and Immunology. 2000;15(4):269–272. [DOI] [PubMed] [Google Scholar]
- 19.Doan N, Contreras A, Flynn J, Slots J, Chen C. Molecular identification of Dialister pneumosintes in subgingival plaque of humans. J Clin Microbiol 2000;38(8):3043–3047. [DOI] [PMC free article] [PubMed] [Google Scholar]
- 20.Wade WG, Spratt DA, Dymock D, Weightman AJ. Molecular detection of novel anaerobic species in dentoalveolar abscesses. Clin Infect Dis 1997;25 Suppl 2:S235–236. [DOI] [PubMed] [Google Scholar]
- 21.Gregg KJ, Finn R, Abbott DW, Boraston AB. Divergent modes of glycan recognition by a new family of carbohydrate-binding modules. J Biol Chem 2008;283(18):12604–12613. [DOI] [PMC free article] [PubMed] [Google Scholar]
- 22.Koropatkin NM, Smith TJ. SusG: a unique cell-membrane-associated alpha-amylase from a prominent human gut symbiont targets complex starch molecules. Structure. 2010;18(2):200–215. [DOI] [PubMed] [Google Scholar]
- 23.Nagy T, Emami K, Fontes CMGA, Ferreira LMA, Humphry DR, Gilbert HJ. The Membrane-Bound -Glucuronidase from Pseudomonas cellulosa Hydrolyzes 4-O-Methyl-D-Glucuronoxylooligosaccharides but Not 4-O-Methyl-D-Glucuronoxylan. Journal of Bacteriology. 2002;184(17):4925–4929. [DOI] [PMC free article] [PubMed] [Google Scholar]
- 24.Carapito R, Imberty A, Jeltsch JM, et al. Molecular basis of arabinobio-hydrolase activity in phytopathogenic fungi: crystal structure and catalytic mechanism of Fusarium graminearum GH93 exo-alpha-L-arabinanase. J Biol Chem 2009;284(18): 12285–12296. [DOI] [PMC free article] [PubMed] [Google Scholar]
- 25.Yatsunenko T, Rey FE, Manary MJ, et al. Human gut microbiome viewed across age and geography. Nature. 2012;486(7402):222–227. [DOI] [PMC free article] [PubMed] [Google Scholar]
Associated Data
This section collects any data citations, data availability statements, or supplementary materials included in this article.