Abstract
Wall shear stress gradients (WSSGs) induce an inflammatory phenotype in endothelial cells (ECs) which is hypothesized to be mediated by mechanotransduction through the EC glycocalyx (GCX). We used a three-dimensional in vitro cell culture model with a 180o curved geometry to investigate if WSSGs created by curvature can cause EC inflammation and disruption of the GCX. The hydrodynamics of the model elicited a morphological response in ECs as well as a pattern of leukocyte adhesion towards the inner wall of curvature that was attenuated with enzymatic removal of GCX components. GCX degradation was also observed in regions of curvature which corresponded to increased activity of MMPs. Together, these results support the hypothesis that the EC GCX is involved in mechanotransduction of WSSGs and that components of the GCX are regulated by MMP activity in regions of curvature.
1. Introduction
The localization of atherosclerosis to regions of disturbed flow is hypothesized to be caused by endothelial cell (EC) dysfunction in response to the wall shear stress (WSS) patterns in these areas [1]. ECs are sensitive to WSS and are known to exhibit an anti-inflammatory phenotype in response to steady, uniform WSS and a pro-inflammatory phenotype, including cellular rounding and increased leukocyte adhesion, when exposed to wall shear stress gradients (WSSGs) [2–6]. Curved arteries exhibit WSSGs which are prone to focal inflammation and atherosclerosis [7].
The mechanotransduction of WSS is poorly understood in ECs, however, the apical glycocalyx (GCX) layer is commonly implicated [8, 9]. The GCX extends 0.5–4.5μm into the vessel in vivo [10–12] and is comprised of a variety of components including glycocsaminoglycans of which heparan sulfate (HS) is the most abundant [13]. It is a dynamic structure [14] whose disruption has been linked to atherosclerosis and diabetes [15–17]. Shedding of GCX components has been linked to matrix metalloproteinases (MMPs) expression and activity, which has been documented to increase in regions of complex flow both in vivo [18] and in vitro [19].
We investigated how the hydrodynamics of a curved vessel related to the inflammatory response of ECs and the regulation of GCX health. Using a novel in vitro cell culture model, it was observed that cell morphology and leukocyte adhesion patterns were dependent on GCX integrity and that enzymatic degradation of GCX components resulted in a loss of these observed patterns. We hypothesized that the hydrodynamic forces created by a curved geometry were responsible for regional GCX degradation which was linked to MMP regulation. Together these findings can explain the observed focal inflammation observed in regions of vessel curvature.
2. Materials and methods
Three-dimensional cell culture models
In vitro models were made of Sylgard®184 (Dow Corning), prepared similarly to previously described methods [20]. A polished metal rod was bent to match the radius of curvature then cast in a mold with Sylgard®184. Once the elastomer was fully cured, the metal rod was removed and connectors for perfusion tubing were added to the inlet and outlet of the model. Dimensionless analysis matched the model dynamics to regions of arterial curvature. The Dean’s Number (DN) is the most relevant of these parameters and is defined as:
which takes into account the Reynolds Number (ReN) and the curvature ratio (D/2RCurv) of a curved cylindrical vessel [21]. The model had a vessel diameter (D) of 2 mm and a radius of curvature (RCurv) of 25.4 mm and the cell culture media had a viscosity and density of 9.75x10⁻⁴ Pa∙s and 994.3 kg/m3, respectively. By controlling the media flow rate, a Dean’s Number of 104 was achieved which falls in the physiological range (10–700 in vivo, [22]) and corresponds with a relevant inlet WSS of 10 dyne/cm2 and Reynolds Number of 543. Under these conditions, fluid momentum caused differential WSS profiles between the inner and outer wall of curvature, Fig 1A.
Fig 1. Overview of curved model and associated fluid dynamics.
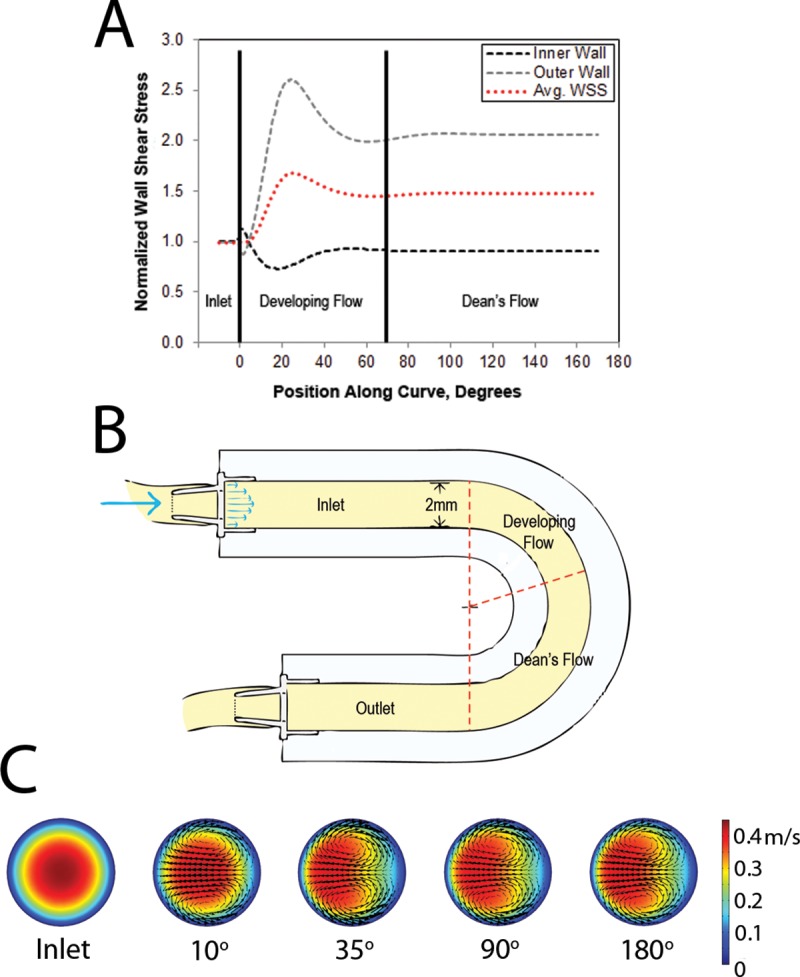
(A) WSS plot normalized to inlet WSS of 10 dyne/cm2 with 3 defined regions of curvature, (B) schematic drawing of 180o curve model with regions of curvature annotated and (C) Cross-sectional velocity plots at different positions along the curve demonstrating secondary flows and fluid momentum shift (right: inner wall, left: outer wall).
The WSS profile was used to segment the model into 3 distinct flow regions for analysis: the uniform WSS inlet region (inlet), a developing flow region (developing flow) and a fully developed Dean’s flow region (Dean’s flow), Fig 1B.
Computational fluid dynamics
CFD simulations were conducted in Comsol Multiphysics 5.0 (Comsol Inc. Burlington, MA) to determine the WSS profile in the cell culture model. Simulations were run at an inlet Reynolds number of 543 to achieve an inlet WSS of 10 dyne/cm2 and a Dean’s Number of 104. Wall effects from cells were assumed to be negligible due to their much smaller size compared to the channel diameter. WSS was calculated from the near wall velocity gradient using a mesh independent laminar solver for steady, incompressible, Newtonian flow with a zero-pressure outlet condition. Simulations also confirmed the development of secondary flows in the form of Dean vortices exhibiting transverse shear gradients along the model circumference, Fig 1C.
Tissue culture
Human abdominal aortic endothelial cells (HAAECs, Coriell, AG09799) were cultured and grown to confluence in 0.1% gelatin-coated T-175 flasks in incubators (37°C, 100% humidity and 5% CO2) over 48 hours. The HAAECs were grown in EC media (PromoCell, C-22010) with 10% fetal bovine serum (Invitrogen, 26140–079) and 1% penicillin-streptomycin (Invitrogen, 15140–122).
The Sylgard®184 models were coated with 40 μg/mL fibronectin (Sigma Aldrich, F2006-5X5MG) for 24 hours prior to cell seeding. The cultured HAAECs were removed from the T-175 flasks using a trypsin solution (0.25% Trypsin/EDTA, Invitrogen) and seeded into the in vitro models at a density of 1x10⁶ cells/mL. The HAAECs were cultured for 48 hours prior to each flow experiment, with a fresh media change after 24 hours, allowing them to establish a confluent monolayer on the models’ luminal surface.
NB4 cells (DSMZ, ACC 207), a human promyelocytic cell line, were used to simulate leukocyte adhesion to the endothelium [23, 24]. NB4 cells were cultured in suspension in T-75 flasks with RPMI Media (Global Cell Solutions, 89140–464) containing 10% fetal bovine serum (Invitrogen, 26140–079) and 1% penicillin-streptomycin (Invitrogen, 15140–122). Prior to experimentation, NB4 cells were treated with RPMI media spiked with 10−6 M all-trans retinoic acid (ATRA) (Life Sciences, 89158–732) for 48 hours to differentiate them into neutrophil-like cells exhibiting increased expression of β1 and β2 integrins, as previously described [25]. Following ATRA stimulation, the NB4 cells were suspended in HAAEC media at a cell density of 1.67x10⁶ cells/mL and then used in adhesion assays.
HS degradation
To impair the structure of the GCX, degradation of HS was performed by heparinase III (Sigma Aldrich, H8891-10UN) treatment [8, 26]. Briefly, serum free media (PromoCell, C-22010) was spiked with 180mU/mL heparinase III and incubated with ECs for 2 hours immediately prior to perfusion experiments. This resulted in a significant decrease in HS intensity of 33±4%, with no loss in cell viability, as previously shown [27]. At the start of experiments, standard EC media was reintroduced into the models.
Perfusion experiments
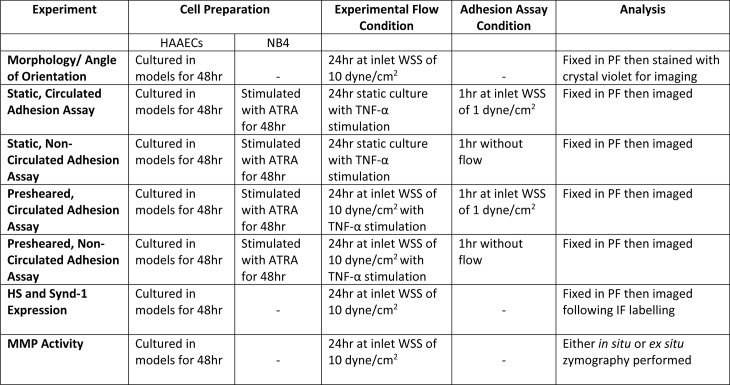
Perfusion experiments were performed in an incubator at standard cell culture conditions (37°C, 100% humidity and 5% CO2) in a sterilized closed-loop as previously described [20]. The flow rate was maintained to achieve an inlet WSS of 10 dyne/cm2 in morphology and preshearing experiments and 1 dyne/cm2 in circulating adhesion assays. A summary of the different experimental protocols can be referred to in Fig 2.
Fig 2. Summary of experimental conditions and subsequent assay analysis.
When HS degradation was included in an experiment, this would be preformed immediately prior to the appropriate “Experimental Flow Condition”.
EC morphology
The shape index (SI), as defined by Nerem et al () [4], was determined by staining ECs with Crystal Violet and imaging the 3 defined sections of the in vitro model. The images were processed by a MatLab® protocol to determine the SI of the stained nuclei of at least 10 cells per image [20]. Cells become more rounded as the SI approaches 1 and more elongated as it approaches 0.
Immunofluoresence quantification of glycocalyx
Immediately following the completion of an experiment, ECs were fixed with a 1% paraformaldehyde solution and subsequently probed with a monoclonal antibody specific to HS (Millipore, MAB2040) or syndecan-1 (Santa Cruz, SC-7099) and an Alexa Fluor® 488 secondary antibody (Invitrogen, A31570). Images were taken with a laser scanning confocal microscope (Zeiss Exciter) and an average intensity of at least 10 cells per image was used.
NB4 adhesion assays
Leukocyte adhesion to the endothelium was investigated using ATRA-stimulated NB4 cells. NB4 cells exhibit similar binding sites to leukocytes following ATRA stimulation and have thus been used in similar adhesion studies [23, 25, 28]. Models were presheared for 24 hours at an inlet WSS of 10 dyne/cm2 and were simultaneously stimulated with 10 μg/mL of the cytokine TNF-α to increase total adhesion [29]. Following this treatment, a suspension of 1x10⁶ NB4 cells/mL was either statically added to the models (non-circulated) or circulated at an inlet WSS of 1 dyne/cm2 [26, 30]. Both the low WSS circulation and TNF-α stimulation were included in adhesion assays to ensure measurable differences in cell adherence over the time scale accessible in vitro. Following a 1 hour exposure to the NB4 cell suspension, the models were fixed using a 1% paraformaldehyde solution and imaged. Images included the entire diameter of the model and the average of 3 images were taken for each data point.
In situ gel zymography
HAAECs were fixed in 1% paraformaldehyde and rinsed with PBS. DQ gelatin (Molecular Probes, D12054) was diluted in Tris Zymo buffer (50mM Tris (pH 7.3), 15mM CaCl2) at a concentration of 1:40. Cells were incubated with the solution for 16hr then washed and mounted before imaging.
Ex situ gel zymography
Following experiments, HAAECs were removed from the models with a 0.25% Trypsin solution (0.25% Trypsin/EDTA, Invitrogen) and were treated with RIPA lysis buffer. Samples were prepared and run on acrylamide gels as previously described [31].
Statistical analysis
All results were expressed as mean ± standard error of the mean and experiments were performed at least in triplicates. Analysis of results was completed using Graphpad Prism 5 (Graphpad Software, La Jolla, CA) software. One-way and Two-way ANOVAs were used for comparisons when needed and were accompanied by multiple comparisons tests (Bonferroni post-hoc tests). Differences between means were considered significant at P<0.05.
3. Results
Characterization of fluid dynamics of the in vitro model using CFD analysis
The WSS profile was obtained from CFD analysis using the experimental flow conditions, Fig 1. This profile was used to section the model into 3 regions where distinct WSS patterns were observed. The inlet demonstrated a uniform parabolic velocity profile and was used as an internal control. The developing flow region was defined from 0 to approximately 70o around the curve where the velocity profile changed in the axial direction. WSS gradients were observed on the inner and outer wall of curvature in this region. The Dean’s flow region from 70o to the curve outlet exhibited fully developed Dean’s flow with a lower WSS on the inner wall of curvature which was similar in magnitude to the inlet and no spatial gradients in the axial direction.
Morphological response of HAAECs to WSS
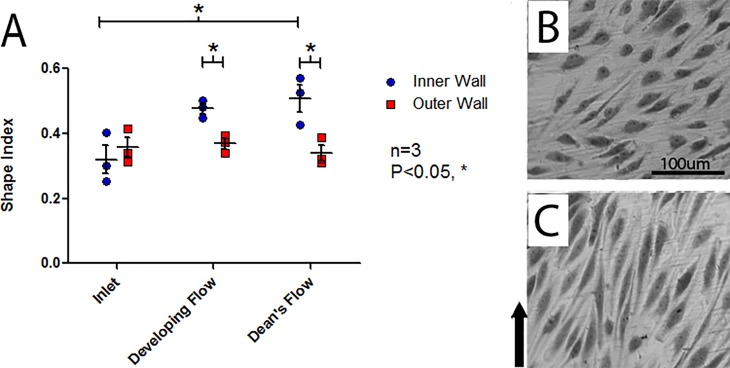
Following flow conditioning for 24 hours at an inlet WSS of 10 dyne/cm2, a significant dependence of EC morphology (SI) to both the side of the curve (two-way ANOVA, P<0.01) and model region (two-way ANOVA, P<0.05) were observed, Fig 3 (S1 Table). There was also significant interaction between model region and side of the curve (two-way ANOVA, P<0.05). In the Dean’s flow region, the inner wall of curvature demonstrated significant rounding when compared to the inlet (Bonferroni post-hoc test, P<0.05). Further, the inner wall of the developing and Dean’s flow regions exhibited significant rounding when compared to their matched outer wall (Bonferroni post-hoc test, P<0.05 and P<0.05, respectively).
Fig 3. Analysis of shape index of HAAECs.
(A) Analysis of shape index of HAAECs on the inner and outer walls of curvature following 24hr of flow conditioning at an inlet WSS of 10dyne/cm2 (n = 3, mean SI ± SEM). The inner wall in the Dean’s flow region had a significantly higher SI than the inlet inner wall (Bonferroni post-hoc test, P<0.05). The developing and Dean’s flow regions also exhibited a significantly higher SI on the inner wall compared to the outer wall in the same region (Bonferroni post-hoc test, P<0.05 and P<0.05, respectively). Representative images used for analysis from Developing Flow region, with direction of flow indicated, in the (B) inner wall of curvature (average shape index = 0.51) and (C) outer wall of curvature (average shape index = 0.34) with direction of flow identified with an arrow.
Angle of orientation of HAAECs in response to WSS
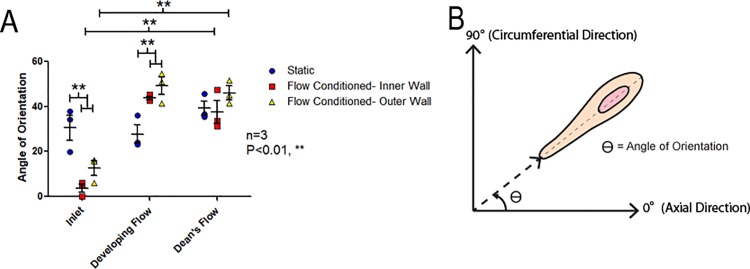
Following flow conditioning for 24 hours at an inlet WSS of 10 dyne/cm2 (flow conditioned), the angle of orientation, defined as the absolute value of the angle of the longitudinal cell axis relative to the axial flow through the channel (0o is perfectly along the axial direction and 90o is perfectly circumferential), was significantly affected by the model region as well as the side of the curve (two-way ANOVA, P<0.001 and P<0.05, respectively), Fig 4 (S2 Table). Both the inner and outer walls of the inlet region in presheared models demonstrated HAAECs which were significantly more oriented along the longitudinal axis of the model than static controls (Bonferroni post-hoc test, P<0.01). However, ECs in the developing and Dean’s low regions were less oriented along the longitudinal axis than static controls (Bonferroni post-hoc test, both P<0.01). In both the inner and outer walls of presheared models, the respective inlet was significantly more oriented along the longitudinal axis of the model than the developing and Dean’s flow regions (Bonferroni post-hoc test, P<0.01).
Fig 4. Angle of orientation of HAAECs.
(A) Angle of orientation (absolute value) of HAAECs on the inner and outer walls of curvature following 24hr of flow conditioning at an inlet WSS of 10dyne/cm2 (n = 3, mean angle ± SEM). Both the inner and outer walls of the inlet were significantly more oriented in the direction of axial flow when compared to static controls (Bonferroni post-hoc test, P<0.01), however, flow conditioned HAAECs were significantly less oriented across the longitudinal axis in the developing flow region (Bonferroni post-hoc test, P<0.01). In both the inner and outer wall of the Developing and Dean’s flow regions, HAAECs were significantly less oriented along the vessel axis when compared to their respective inlet control (Bonferroni post-hoc test, P<0.01). (B) Representative cartoon of the angle of orientation (θ) of the longitudinal cell axis with 0o being axial and 90o being circumferential to the channel.
Distribution of adhered NB4 cells
Circulated and non-circulated adhesion assays were performed on both statically cultured and flow conditioned (presheared) HAAECs, with and without GCX degradation. Adhesion assays on statically cultured HAAECs were included to determine if any bias was attributed to the hydrodynamics in the model. Since the HAAECs were not exposed to the shear fields created in the model, there would be no phenotypical changes in the cells and hence any patterns of adhesion could be attributed to hydrodynamics acting on the NB4 cells.
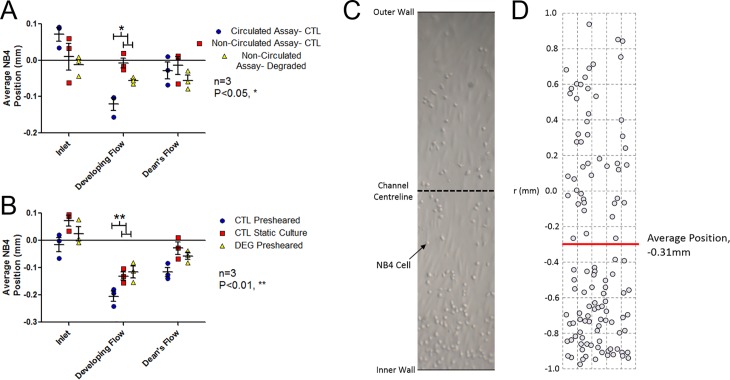
Static cultures demonstrated that the type of assay (circulated/ non-circulated) and model region both had a significant effect on adhesion (two-way ANOVA, P<0.05 and P<0.05), Fig 5A (Table A in S3 Table). In the developing flow region, there was a significant bias of adhesion towards the inner wall of curvature in circulated compared to non-circulated assays. There was no significant difference in adhesion distribution between control and degraded cultures.
Fig 5. Average position of adhered NB4s relative to the centreline with the inner wall in the negative direction and outer wall in the positive direction.
(A) Both circulated (inlet WSS of 1 dyne/cm2) and non-circulated (no WSS) adhesion assays for statically cultured control (CTL) and HS-degraded (DEG) HAAECs (n = 3, mean average position ± SEM). The developing flow region of the circulated adhesion assay showed a significant bias towards the inner wall compared to static controls (Bonferroni post-hoc test, P<0.05). (B) Mean average position of circulated (inlet WSS of 1 dyne/cm2) adhesion assays following 24hr preshearing (inlet WSS of 10 dyne/cm2) or static culture. Controls exhibited a significant bias in adhesion to the inner wall in the developing flow region relative to HS-degraded HAAECs (Bonferroni post-hoc test, P<0.01). (C) Representative image of the full model diameter used for analysis from the Dean’s Flow region of circulated adhesion assay of CTL presheared HAAECs. (D) Analysis of the image collecting coordinates of each adhered NB4 cell to determine average position as reported in (A) and (B), demonstrating a bias to the inner wall of curvature.
The adhesion assays were then repeated following flow conditioning for 24 hours at an inlet WSS of 10 dyne/cm2 (presheared). Both degradation and location had a significant effect on adhesion (two-way ANOVA, P<0.001 and P<0.001, respectively), Fig 5B (Table B in S3 Table). Following preshearing, adhesion was higher on the inner wall of curvature in the developing flow region when compared to statically cultured control (Bonferroni post-hoc test, P<0.01) and HS-degraded (Bonferroni post-hoc test, P<0.01) HAAECs.
HS and syndecan-1 expression
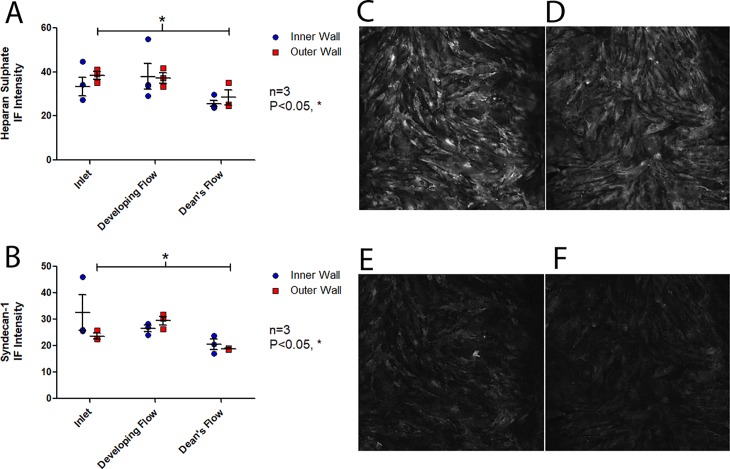
Following flow conditioning for 24 hours at an inlet WSS of 10 dyne/cm2, the expression of HS was similar between the inner and outer wall, however there was significant variation in HS amongst the model regions (two-way ANOVA, P<0.01), Fig 6A (Table A in S4 Table). A significant decrease in HS expression was observed in the Dean’s flow region when compared to the inlet (Bonferroni post-hoc test, P<0.05).
Fig 6. Immunofluorescence staining of HS and Syndecan-1.
Following 24hr of flow conditioning (inlet WSS of 10 dyne/cm2), mean fluorescence intensity (n = 3, mean intensity ± SEM) of (A) of HS which showed a significant decrease in mean intensity in the Dean’s flow region relative to the inlet (Bonferroni post-hoc test, P<0.05) and (B) Syndecan-1 which also showed a significant decrease in mean intensity in the Dean’s flow region relative to the inlet (Bonferroni post-hoc test, P<0.05). Representative images of (C) Inlet and (D) Dean’s Flow HS immunofluorescence for the outer wall of curvature and (E) Inlet and (F) Dean’s Flow Synd-1 immunofluorescence for the outer wall of curvature.
Similarly, following flow conditioning for 24 hours at an inlet WSS of 10 dyne/cm2, the side of the curve showed no effect on syndecan-1 expression, however expression varied significantly by model region (two-way ANOVA, P<0.01), Fig 6B (Table B in S4 Table). On the outer wall of curvature, there was a significant decrease in syndecan-1 expression in the Dean’s flow region when compared to the inlet (Bonferroni post-hoc test, P<0.05).
MMP activity
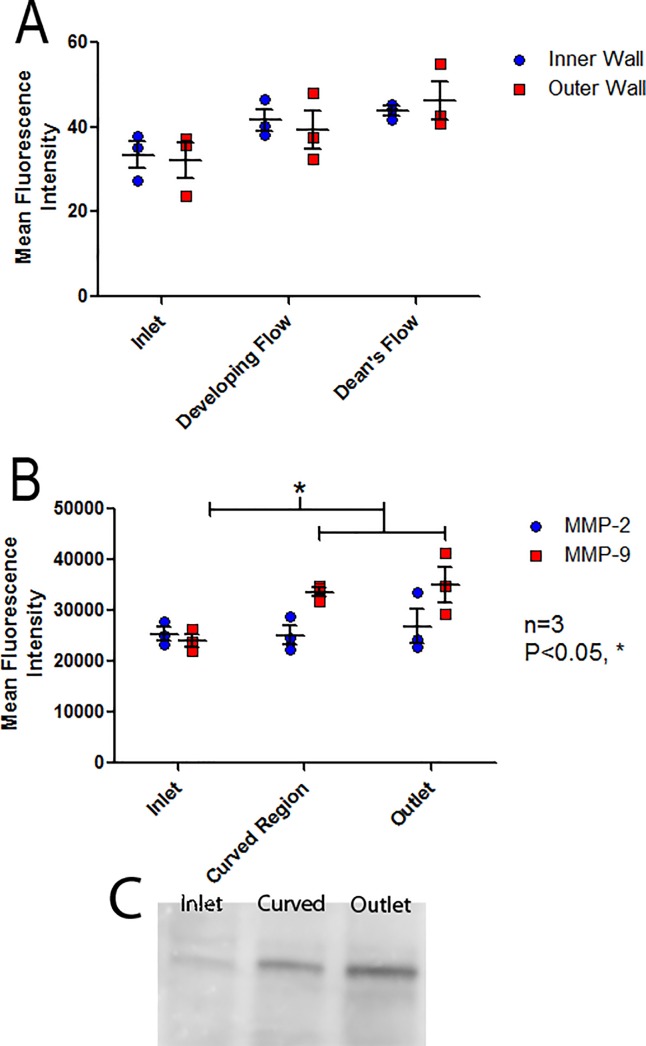
Following flow conditioning for 24 hours at an inlet WSS of 10 dyne/cm2, in situ gel zymography demonstrated that MMP activity was significantly affected by model region (two-way ANOVA, P<0.05) but did not show dependence on the side of curvature, Fig 7A (Table A in S5 Table).
Fig 7. Analysis of MMP activity throughout the curved model.
(A) Regional MMP activity quantified by in situ gel zymography following treatment of HAAEC with DQ gelatin showing a trend for increased activity throughout the curve and (B) Regional MMP activity quantified by ex situ gel zymography showing a significant increase in MMP-9 activity in the curve and outlet regions of the model when compared to the inlet (Bonferonni post-hoc test, P<0.05). (n = 3, mean intensity ± SEM). (C) Representative zymography image from ex situ MMP-9 experiments.
Ex situ gel zymography was performed and HAAECs were pooled from both the Developing Flow and Dean’s Flow regions and labelled “Curved region” to ensure adequate protein concentrations for analysis. Ex situ gel zymography demonstrated that MMP activity was dependent on model region (one-way ANOVA, P<0.05). Significantly higher MMP-9 activity was observed in both the curve and the outlet when compared to the inlet of the model (Bonferroni post-hoc test, P<0.05), whereas no differences were observed for MMP-2, Fig 7B (Table B in S5 Table).
4. Discussion
In this study, we investigated the role of the EC GCX in cellular inflammation in regions of a 180o curved vessel. Results demonstrated that the hydrodynamics of this geometry regionally degraded the EC GCX which correlated with increased MMP activity and altered patterns of leukocyte adhesion.
CFD simulations suggested a spatially variable midline shear field exhibiting WSSGs along the model. Further, 3D velocity profiles demonstrated recirculating Deans vortices, creating secondary gradients across the circumference of the model. The fluid dynamics of the model were found to significantly alter EC phenotype, with observed differences in morphology (quantified by shape index and orientation) and leukocyte adhesion patterns in the different model regions. Degradation of HS and syndecan-1 was observed downstream of WSSGs, corresponding to regions of increased MMP activity, suggesting a link between GCX health and MMP regulation in curved vessels.
HAAECs exhibited a differential morphological response to WSS in regions of curvature
The model’s fluid dynamics lead to an elongated morphology on the outer wall of curvature, with the developing and Dean’s flow regions exhibiting significantly greater elongation than both the inlet and matched inner wall of the model, Fig 3. This can be correlated with a higher WSS on the outer wall due to momentum carrying the bulk flow to the outer curve. Further, this resulted in a lower WSS acting on the inner wall of curvature that was accompanied by secondary flows. Elongation of EC morphology is indicative of an "atheroprotective" phenotype [5], indicating the outer wall may be comparatively less prone to developing pathology than the more rounded ECs on the inner wall as seen in animal models [32, 33].
Potter et al used an elongation index to show that ECs on the outer wall of curvature were elongated when compared to those found on the inner wall of porcine aortic ECs in tissue culture models [34]. In contrast, Wang et al found increases in VCAM-1 and E-selectin, markers of EC inflammation, on the outer wall of curvature, but these results were confounded by having suspended red blood cells which they hypothesized “bombarded” the outer wall, causing more severe EC damage [35]. These results support the former findings, suggesting the fluid dynamics in a curved vessel result in a differential EC response favouring an inflamed, rounded shape, on the inner wall of curvature.
The angle of EC orientation demonstrated significantly less alignment with the direction of bulk flow on both sides of the flow channel in the developing flow region when compared with static controls, Fig 4. Typically, WSS will result in alignment with the direction of bulk flow in regions of steady, uniform flow [5]. In contrast, complex fluid dynamics and WSSGs have been shown to cause a less organized orientation [5]. Interestingly, there was low variance in the angle of orientation in the curve, suggesting the cells were in relative alignment but this alignment was skewed towards the circumferential direction. This lack of orientation in the axial direction can be attributed to the nature of Dean's flow. Dean's flow produces secondary flows in the circumferential direction which redistribute the increased momentum on the outer wall back towards the inner wall of curvature, as shown in Fig 1C. Therefore, this flow will take a more circumferential than axial path when compared to flow in a straight cylinder. The angle of orientation may have been offset from the axial direction due to these secondary flows. Potter et al showed that in vivo, ECs in the aortic arch had increased variability in alignment when compared to static in vitro cultures [36]. Ghriallais et al found an increased alignment in the direction of flow compared to static controls in a curved model (without inner/ outer wall specificity) and noted less alignment in curved regions when compared to straight tube models [37]. Alloush et al observed decreased alignment with flow in regions of curvature where complex fluid dynamics were present [38]. This study furthers these findings suggesting the orientation of the ECs may be a consequence of secondary flows.
Differential NB4 adhesion to ECs was observed in regions of curvature
To determine the effect of the model’s hydrodynamics on adhesion patterns, ECs were statically cultured before being exposed to a suspension of either circulated or non-circulated NB4 cells for 1hr. Circulated adhesion assays were performed to better mimic the rolling and tethering mechanics which accompany leukocyte adhesion in vivo but at a low enough WSS that it would not illicit a phenotypical response in ECs. Therefore, any adhesion patterns which differed between the circulated and non-circulated adhesion assays were assumed to be the result of the hydrodynamics acting on the NB4 cells. These experiments demonstrated the hydrodynamic forces caused a bias in NB4 adhesion towards the inner wall of curvature in the developing flow region, Fig 5A.
To determine the phenotypical response of ECs to curved vessel hydrodynamics, ECs were presheared (flow conditioned for 24 hours at an inlet WSS of 10 dyne/cm2) prior to circulated adhesion assays. These assays demonstrated a significant bias of NB4 adhesion to the inner wall of curvature beyond the effect of the hydrodynamic forces acting on the circulated NB4 cells, Fig 5B. This bias can therefore be attributed to the WSS fields eliciting a phenotypical change in ECs in these regions. Suo et al demonstrated an increased expression of cellular adhesion molecules on the inner wall of curvature in mouse aortas which could help support this finding [39]. Similarly, increased adhesion has been linked to regions of WSSGs and lower WSS [40] and is indicative of EC inflammation. The lower observed WSS and secondary flows creating circumferential WSSGs on the inner wall of curvature, Fig 1, would agree with this focal inflammation. The observed adhesion patterns in this study are further supported by clinical evidence of an increased prevalence of plaque development on the inner wall of curvature in arteries [41–43].
Disruption of the GCX attenuates NB4 adhesion patterns in regions of curvature
Mechanotransduction of fluid forces through the GCX was hypothesized to be responsible for the WSS mediated phenotypical changes which lead to the NB4 adhesion bias. Supporting this hypothesis, presheared HS-degraded ECs did not exhibit the amplified adhesion bias to the inner wall of curvature seen in control cultures, Fig 5B. Cooper et al demonstrated a similar effect in a 50% stenosis model, where non-uniform regional NB4 adhesion patterns were attenuated following GCX degradation [26].
Disruption of HS and syndecan-1 occurs in regions of curvature
In the Dean’s flow region, significant decreases were observed in both HS and Syndecan-1 compared to the inlet, Fig 6, demonstrating that flow through regions of curvature negatively affected EC GCX health. Studies have found similar findings in vivo, reporting that GCX components, including HS, are focally shed in regions of disturbed flow [44–46]. The observed degradation was hypothesized to be the result of increased MMP activity in response to the complex of flow in the curved model. Studies utilizing oscillatory flow found upregulation of MMP-9 [47], bifurcation models increased activity of MMP-2 and MMP-9 in regions of WSSGs [19] and MMP expression has been linked to NF-κB activity which is regulated in response to WSSGs [36, 48, 49], all supporting this notion. A variety of MMPs have been linked to GCX disruption, with MMP-9 cleaving HS [50] and MMP-1 and MMP-14 cleaving syndecan-1 [51, 52].
MMP activity was increased in regions of curvature
MMP activity was quantified by in situ and ex situ gel zymography, both demonstrating a correlation with MMP activity and GCX degradation. Although increased activity of the gelatinases (MMP-2 and MMP-9) was not observed in any distinct region with in situ analysis, there was still a significant overall effect of region on MMP activity. Ex Situ zymography showed significant increases in MMP-9 activity in the curve and outlet when compared to the inlet. Due to constraints in protein concentrations extracted from the models, ECs from the entire curve had to be pooled for this analysis, losing spatial resolution in this finding. However, observing this increase in the curve still correlated with decreased HS and syndecan-1 expression in the Deans Flow region which makes up the majority of the 180o curve and was in agreeance with previous findings [49]. These results support the proposed hypothesis that the complex flow which develops in a curved geometry increases MMP activity which then degrades the GCX, eliciting an inflammatory response in ECs.
Although increased activity was expected in the curve where complex flow was found, it was unexpected to see higher MMP-9 activity in the outlet region where uniform flow was re-established. We hypothesize this to be a “wash down” effect whereby MMP-9 activation in the curve is subsequently carried downstream by the fluid flow. We have suggested a similar mechanism in a 50% stenosis model [26].
Overall, this study demonstrated that a curved vessel geometry elicits a differential inflammatory response in ECs. Specifically, experiments showed changes in morphology and NB4 adhesion patterns were tied to GCX health. Regional degradation of GCX components also correlated with increased MMP activity, suggesting MMP regulation in areas of complex flow can significantly affect GCX health and lead to an inflammatory EC response.
Supporting information
Raw data from morphology experiments to determine shape index in model regions.
(TXT)
Raw data from flow experiments to determine angle of orientation in model regions.
(TXT)
Raw data from adhesion experiments to determine position of NB4 adhesion in model regions.
(TXT)
Immunoflourescence intensity for Table A) Heparan sulphate and Table B) Syndecan-1 for Fig 6. Raw data from flow experiments to determine abundance of heparan sulphate and syndecan-1 in model regions.
(TXT)
Table A) In situ gel zymography and Table B) Ex situ gel zymography for Fig 7. Raw data to determine levels of MMP activity in the model regions.
(TXT)
Data Availability
All relevant data are within the paper and its Supporting Information files.
Funding Statement
This work was funded by grant 261938-13 from the Natural Sciences and Engineering Research Council of Canada to RL. The funders had no role in study design, data collection and analysis, decision to publish, or preparation of the manuscript.
References
- 1.Lopez AD, Mathers CD, Ezzati M, Jamison DT, Murray CJ. Global and regional burden of disease and risk factors, 2001: systematic analysis of population health data. Lancet. 2006;367(9524):1747–57. 10.1016/S0140-6736(06)68770-9 [DOI] [PubMed] [Google Scholar]
- 2.Alon R, Ley K. Cells on the run: shear-regulated integrin activation in leukocyte rolling and arrest on endothelial cells. Curr Opin Cell Biol. 2008;20(5):525–32. 10.1016/j.ceb.2008.04.003 [DOI] [PMC free article] [PubMed] [Google Scholar]
- 3.Levesque MJ, Nerem RM. The elongation and orientation of cultured endothelial cells in response to shear stress. Journal of biomechanical engineering. 1985;107(4):341–7. [DOI] [PubMed] [Google Scholar]
- 4.Nerem RM, Levesque MJ, Cornhill JF. Vascular endothelial morphology as an indicator of the pattern of blood flow. J Biomech Eng. 1981;103(3):172–6. [DOI] [PubMed] [Google Scholar]
- 5.Dewey CF Jr., Bussolari SR, Gimbrone MA Jr., Davies PF. The dynamic response of vascular endothelial cells to fluid shear stress. J Biomech Eng. 1981;103(3):177–85. [DOI] [PubMed] [Google Scholar]
- 6.Malek AM, Izumo S. Mechanism of endothelial cell shape change and cytoskeletal remodeling in response to fluid shear stress. Journal of cell science. 1996;109 (Pt 4):713–26. [DOI] [PubMed] [Google Scholar]
- 7.Goode TB, Davies PF, Reidy MA, Bowyer DE. Aortic endothelial cell morphology observed in situ by scanning electron microscopy during atherogenesis in the rabbit. Atherosclerosis. 1977;27(2):235–51. [DOI] [PubMed] [Google Scholar]
- 8.Florian JA, Kosky JR, Ainslie K, Pang Z, Dull RO, Tarbell JM. Heparan sulfate proteoglycan is a mechanosensor on endothelial cells. Circulation research. 2003;93(10):e136–42. 10.1161/01.RES.0000101744.47866.D5 [DOI] [PubMed] [Google Scholar]
- 9.Pahakis MY, Kosky JR, Dull RO, Tarbell JM. The role of endothelial glycocalyx components in mechanotransduction of fluid shear stress. Biochemical and biophysical research communications. 2007;355(1):228–33. 10.1016/j.bbrc.2007.01.137 [DOI] [PMC free article] [PubMed] [Google Scholar]
- 10.Nieuwdorp M, Meuwese MC, Vink H, Hoekstra JB, Kastelein JJ, Stroes ES. The endothelial glycocalyx: a potential barrier between health and vascular disease. Current opinion in lipidology. 2005;16(5):507–11. [DOI] [PubMed] [Google Scholar]
- 11.Coombe DR, Kett WC. Heparan sulfate-protein interactions: therapeutic potential through structure-function insights. Cellular and molecular life sciences: CMLS. 2005;62(4):410–24. 10.1007/s00018-004-4293-7 [DOI] [PubMed] [Google Scholar]
- 12.van Haaren PM, VanBavel E, Vink H, Spaan JA. Localization of the permeability barrier to solutes in isolated arteries by confocal microscopy. American journal of physiology Heart and circulatory physiology. 2003;285(6):H2848–56. 10.1152/ajpheart.00117.2003 [DOI] [PubMed] [Google Scholar]
- 13.Ihrcke NS, Wrenshall LE, Lindman BJ, Platt JL. Role of heparan sulfate in immune system-blood vessel interactions. Immunology today. 1993;14(10):500–5. 10.1016/0167-5699(93)90265-M [DOI] [PubMed] [Google Scholar]
- 14.Zeng Y, Adamson RH, Curry FR, Tarbell JM. Sphingosine-1-phosphate protects endothelial glycocalyx by inhibiting syndecan-1 shedding. American journal of physiology Heart and circulatory physiology. 2014;306(3):H363–72. 10.1152/ajpheart.00687.2013 [DOI] [PMC free article] [PubMed] [Google Scholar]
- 15.Lewis JC, Taylor RG, Jones ND, St Clair RW, Cornhill JF. Endothelial surface characteristics in pigeon coronary artery atherosclerosis. I. Cellular alterations during the initial stages of dietary cholesterol challenge. Laboratory investigation; a journal of technical methods and pathology. 1982;46(2):123–38. [PubMed] [Google Scholar]
- 16.Vink H, Duling BR. Identification of distinct luminal domains for macromolecules, erythrocytes, and leukocytes within mammalian capillaries. Circulation research. 1996;79(3):581–9. [DOI] [PubMed] [Google Scholar]
- 17.Nieuwdorp M, Mooij HL, Kroon J, Atasever B, Spaan JA, Ince C, et al. Endothelial glycocalyx damage coincides with microalbuminuria in type 1 diabetes. Diabetes. 2006;55(4):1127–32. [DOI] [PubMed] [Google Scholar]
- 18.Castier Y, Brandes RP, Leseche G, Tedgui A, Lehoux S. p47phox-dependent NADPH oxidase regulates flow-induced vascular remodeling. Circulation research. 2005;97(6):533–40. 10.1161/01.RES.0000181759.63239.21 [DOI] [PubMed] [Google Scholar]
- 19.Wang Z, Kolega J, Hoi Y, Gao L, Swartz DD, Levy EI, et al. Molecular alterations associated with aneurysmal remodeling are localized in the high hemodynamic stress region of a created carotid bifurcation. Neurosurgery. 2009;65(1):169–77; discussion 77–8. 10.1227/01.NEU.0000343541.85713.01 [DOI] [PMC free article] [PubMed] [Google Scholar]
- 20.Farcas MA, Rouleau L, Fraser R, Leask RL. The development of 3-D, in vitro, endothelial culture models for the study of coronary artery disease. Biomedical engineering online. 2009;8:30 10.1186/1475-925X-8-30 [DOI] [PMC free article] [PubMed] [Google Scholar]
- 21.Berger SA. Flow in Curved Pipes. Annual Review of Fluid Mechanics. 1983;15:461–512. [Google Scholar]
- 22.Nichols W, O'Rourke M, Vlachopoulos C. McDonald's Blood Flow in Arteries: Theoretical, Experimental and Clinical Principles. Sixth ed: CRC Press; 2011. July 29, 2011. 768 p. [Google Scholar]
- 23.Marchetti M, Falanga A, Giovanelli S, Oldani E, Barbui T. All-trans-retinoic acid increases adhesion to endothelium of the human promyelocytic leukaemia cell line NB4. British journal of haematology. 1996;93(2):360–6. [DOI] [PubMed] [Google Scholar]
- 24.Rouleau L, Farcas M, Tardif JC, Mongrain R, Leask RL. Endothelial cell morphologic response to asymmetric stenosis hemodynamics: effects of spatial wall shear stress gradients. Journal of biomechanical engineering. 2010;132(8):081013 10.1115/1.4001891 [DOI] [PubMed] [Google Scholar]
- 25.Rouleau L, Copland IB, Tardif JC, Mongrain R, Leask RL. Neutrophil adhesion on endothelial cells in a novel asymmetric stenosis model: effect of wall shear stress gradients. Annals of biomedical engineering. 2010;38(9):2791–804. 10.1007/s10439-010-0032-4 [DOI] [PMC free article] [PubMed] [Google Scholar]
- 26.Cooper S, McDonald K, Burkat D, Leask RL. Stenosis Hemodynamics Disrupt the Endothelial Cell Glycocalyx by MMP Activity Creating a Proinflammatory Environment. Annals of biomedical engineering. 2017. [DOI] [PubMed] [Google Scholar]
- 27.McDonald KK, Cooper S, Danielzak L, Leask RL. Glycocalyx Degradation Induces a Proinflammatory Phenotype and Increased Leukocyte Adhesion in Cultured Endothelial Cells under Flow. PloS one. 2016;11(12). [DOI] [PMC free article] [PubMed] [Google Scholar]
- 28.Zang C, Liu H, Ries C, Ismair MG, Petrides PE. Enhanced migration of the acute promyelocytic leukemia cell line NB4 under in vitro conditions during short-term all-trans-retinoic acid treatment. Journal of cancer research and clinical oncology. 2000;126(1):33–40. [DOI] [PubMed] [Google Scholar]
- 29.Zhang C. The role of inflammatory cytokines in endothelial dysfunction. Basic research in cardiology. 2008;103(5):398–406. 10.1007/s00395-008-0733-0 [DOI] [PMC free article] [PubMed] [Google Scholar]
- 30.Lawrence MB, Kansas GS, Kunkel EJ, Ley K. Threshold levels of fluid shear promote leukocyte adhesion through selectins (CD62L,P,E). The Journal of cell biology. 1997;136(3):717–27. [DOI] [PMC free article] [PubMed] [Google Scholar]
- 31.Frankowski H, Gu YH, Heo JH, Milner R, Del Zoppo GJ. Use of gel zymography to examine matrix metalloproteinase (gelatinase) expression in brain tissue or in primary glial cultures. Methods in molecular biology (Clifton, NJ). 2012;814:221–33. [DOI] [PMC free article] [PubMed] [Google Scholar]
- 32.LaMack JA, Himburg HA, Friedman MH. Distinct Profiles of Endothelial Gene Expression in Hyperpermeable Regions of the Porcine Aortic Arch and Thoracic Aorta. Atherosclerosis. 2007;195(2):e35–e41. 10.1016/j.atherosclerosis.2007.04.054 [DOI] [PMC free article] [PubMed] [Google Scholar]
- 33.Hajra L, Evans AI, Chen M, Hyduk SJ, Collins T, Cybulsky MI. The NF-κB signal transduction pathway in aortic endothelial cells is primed for activation in regions predisposed to atherosclerotic lesion formation. Proceedings of the National Academy of Sciences of the United States of America. 2000;97(16):9052–7. [DOI] [PMC free article] [PubMed] [Google Scholar]
- 34.Potter CM, Lundberg MH, Harrington LS, Warboys CM, Warner TD, Berson RE, et al. Role of shear stress in endothelial cell morphology and expression of cyclooxygenase isoforms. Arteriosclerosis, thrombosis, and vascular biology. 2011;31(2):384–91. 10.1161/ATVBAHA.110.214031 [DOI] [PubMed] [Google Scholar]
- 35.Wang Y, Mannino RG, Myers DR, Li W, Joiner CH, Lam WA. vessel geometry interacts with red blood cell stiffness to promote endothelial cell dysfunction in sickle cell disease Blood. 2015;126:965. [Google Scholar]
- 36.Potter CM, Schobesberger S, Lundberg MH, Weinberg PD, Mitchell JA, Gorelik J. Shape and compliance of endothelial cells after shear stress in vitro or from different aortic regions: scanning ion conductance microscopy study. PloS one. 2012;7(2):e31228 10.1371/journal.pone.0031228 [DOI] [PMC free article] [PubMed] [Google Scholar]
- 37.Ghriallais RN, McNamara L, Bruzzi M. Comparison of in vitro human endothelial cell response to self-expanding stent deployment in a straight and curved peripheral artery simulator. Journal of the Royal Society, Interface. 2013;10(81):20120965 10.1098/rsif.2012.0965 [DOI] [PMC free article] [PubMed] [Google Scholar]
- 38.Alloush MM, Oweis GF, Nasr R, Zeidan A, editors. An aortic arch flow loop for the study of hemodynamic-induced endothelial cell injury and inflammation. 2nd Middle East Conference on Biomedical Engineering; 2014 17–20 Feb. 2014.
- 39.Suo J, Ferrara DE, Sorescu D, Guldberg RE, Taylor WR, Giddens DP. Hemodynamic shear stresses in mouse aortas: implications for atherogenesis. Arteriosclerosis, thrombosis, and vascular biology. 2007;27(2):346–51. 10.1161/01.ATV.0000253492.45717.46 [DOI] [PubMed] [Google Scholar]
- 40.Wahle A, Lopez JJ, Olszewski ME, Vigmostad SC, Chandran KB, Rossen JD, et al. Plaque development, vessel curvature, and wall shear stress in coronary arteries assessed by X-ray angiography and intravascular ultrasound. Medical image analysis. 2006;10(4):615–31. 10.1016/j.media.2006.03.002 [DOI] [PMC free article] [PubMed] [Google Scholar]
- 41.Smedby O, Johansson J, Molgaard J, Olsson AG, Walldius G, Erikson U. Predilection of atherosclerosis for the inner curvature in the femoral artery. A digitized angiography study. Arteriosclerosis, thrombosis, and vascular biology. 1995;15(7):912–7. [DOI] [PubMed] [Google Scholar]
- 42.VanderLaan PA, Reardon CA, Getz GS. Site specificity of atherosclerosis: site-selective responses to atherosclerotic modulators. Arteriosclerosis, thrombosis, and vascular biology. 2004;24(1):12–22. 10.1161/01.ATV.0000105054.43931.f0 [DOI] [PubMed] [Google Scholar]
- 43.Moore JE Jr., Ku DN, Zarins CK, Glagov S. Pulsatile flow visualization in the abdominal aorta under differing physiologic conditions: implications for increased susceptibility to atherosclerosis. Journal of biomechanical engineering. 1992;114(3):391–7. [DOI] [PubMed] [Google Scholar]
- 44.Gouverneur M, Berg B, Nieuwdorp M, Stroes E, Vink H. Vasculoprotective properties of the endothelial glycocalyx: effects of fluid shear stress. Journal of internal medicine. 2006;259(4):393–400. 10.1111/j.1365-2796.2006.01625.x [DOI] [PubMed] [Google Scholar]
- 45.Haldenby KA, Chappell DC, Winlove CP, Parker KH, Firth JA. Focal and regional variations in the composition of the glycocalyx of large vessel endothelium. Journal of vascular research. 1994;31(1):2–9. 10.1159/000159025 [DOI] [PubMed] [Google Scholar]
- 46.van den Berg BM, Spaan JA, Rolf TM, Vink H. Atherogenic region and diet diminish glycocalyx dimension and increase intima-to-media ratios at murine carotid artery bifurcation. American journal of physiology Heart and circulatory physiology. 2006;290(2):H915–20. 10.1152/ajpheart.00051.2005 [DOI] [PubMed] [Google Scholar]
- 47.Magid R, Murphy TJ, Galis ZS. Expression of matrix metalloproteinase-9 in endothelial cells is differentially regulated by shear stress. Role of c-Myc. The Journal of biological chemistry. 2003;278(35):32994–9. 10.1074/jbc.M304799200 [DOI] [PubMed] [Google Scholar]
- 48.Hajra L, Evans AI, Chen M, Hyduk SJ, Collins T, Cybulsky MI. The NF-kappa B signal transduction pathway in aortic endothelial cells is primed for activation in regions predisposed to atherosclerotic lesion formation. Proceedings of the National Academy of Sciences of the United States of America. 2000;97(16):9052–7. [DOI] [PMC free article] [PubMed] [Google Scholar]
- 49.Nagel T, Resnick N, Dewey CF Jr., Gimbrone MA Jr. Vascular endothelial cells respond to spatial gradients in fluid shear stress by enhanced activation of transcription factors. Arteriosclerosis, thrombosis, and vascular biology. 1999;19(8):1825–34. [DOI] [PubMed] [Google Scholar]
- 50.Hawinkels LJ, Zuidwijk K, Verspaget HW, de Jonge-Muller ES, van Duijn W, Ferreira V, et al. VEGF release by MMP-9 mediated heparan sulphate cleavage induces colorectal cancer angiogenesis. European journal of cancer (Oxford, England: 1990). 2008;44(13):1904–13. [DOI] [PubMed] [Google Scholar]
- 51.Endo K, Takino T, Miyamori H, Kinsen H, Yoshizaki T, Furukawa M, et al. Cleavage of syndecan-1 by membrane type matrix metalloproteinase-1 stimulates cell migration. The Journal of biological chemistry. 2003;278(42):40764–70. 10.1074/jbc.M306736200 [DOI] [PubMed] [Google Scholar]
- 52.Manon-Jensen T, Multhaupt HA, Couchman JR. Mapping of matrix metalloproteinase cleavage sites on syndecan-1 and syndecan-4 ectodomains. The FEBS journal. 2013;280(10):2320–31. 10.1111/febs.12174 [DOI] [PubMed] [Google Scholar]
Associated Data
This section collects any data citations, data availability statements, or supplementary materials included in this article.
Supplementary Materials
Raw data from morphology experiments to determine shape index in model regions.
(TXT)
Raw data from flow experiments to determine angle of orientation in model regions.
(TXT)
Raw data from adhesion experiments to determine position of NB4 adhesion in model regions.
(TXT)
Immunoflourescence intensity for Table A) Heparan sulphate and Table B) Syndecan-1 for Fig 6. Raw data from flow experiments to determine abundance of heparan sulphate and syndecan-1 in model regions.
(TXT)
Table A) In situ gel zymography and Table B) Ex situ gel zymography for Fig 7. Raw data to determine levels of MMP activity in the model regions.
(TXT)
Data Availability Statement
All relevant data are within the paper and its Supporting Information files.


