Abstract
Low-cost, robust, and reusable continuous glucose monitoring systems that can provide quantitative measurements at point-of-care settings is an unmet medical need. Optical glucose sensors require complex and time-consuming fabrication processes, and their readouts are not practical for quantitative analyses. Here, a wearable contact lens optical sensor was created for the continuous quantification of glucose at physiological conditions, simplifying the fabrication process and facilitating smartphone readouts. A photonic microstructure having a periodicity of 1.6 μm was printed on a glucose-selective hydrogel film functionalized with phenylboronic acid. Upon binding with glucose, the microstructure volume swelled, which modulated the periodicity constant. The resulting change in the Bragg diffraction modulated the space between zero- and first-order spots. A correlation was established between the periodicity constant and glucose concentration within 0–50 mM. The sensitivity of the sensor was 12 nm mM–1, and the saturation response time was less than 30 min. The sensor was integrated with commercial contact lenses and utilized for continuous glucose monitoring using smartphone camera readouts. The reflected power of the first-order diffraction was measured via a smartphone application and correlated to the glucose concentrations. A short response time of 3 s and a saturation time of 4 min was achieved in the continuous monitoring mode. Glucose-sensitive photonic microstructures may have applications in point-of-care continuous monitoring devices and diagnostics at home settings.
Keywords: contact lenses, photonic nanostructures, glucose sensors, phenylboronic acid, smartphone diagnostics, wearable sensors
Diabetes is a significant global health challenge caused by either a deficiency or resistance to insulin.1 This epidemic affecting more than 382 million people is on the rise worldwide.2 Diabetes has an annual cost burden of $245 billion ($176 billion in direct expenses) for the United States healthcare system.3 Diabetes as a chronic illness requires constant monitoring of blood glucose concentration to manage insulin administration.4,5 Fluctuations in the concentration of glucose in blood may result in diabetic ketoacidosis that can lead to a seizure.6 Long-term complications of diabetes include neuropathy, cardiovascular diseases, kidney failure, and limb amputation.7
The concentration of glucose is typically monitored by using fingerstick blood samples.8 Patients on multiple-dose insulin injection or insulin pump therapy should measure their blood glucose concentration 6–8 times a day. However, the test is performed more infrequently due to the pain and inconvenience associated with fingersticks, particularly among children with type 1 diabetes.9,10 Another strategy is to use subcutaneously inserted electrochemical sensors for continuous glucose monitoring (CGM) systems (e.g., Dexcom, Medtronic).11,12 These devices aim to provide real-time, long-term measurements that can also be used with insulin pumps to form an automated feedback loop to manage insulin delivery when hypo/hyperglycemia is developing.13−15 The primary application of these CGM devices is in type 1 diabetic patients. CGM systems also help prediabetic and type 2 diabetic patients to self-regulate their exercise and achieve effective intervention programs and to optimize an insulin regimen.16−18 Commercial CGM systems, however, do not completely provide a solution for uncontrolled glycemic fluctuations due to low patient compliance. Calibration of CGM systems requires at least 3–4 fingerstick blood tests per day.19 These devices are subject to signal drift due to electrochemical reaction instability, resulting in time lags and sensor replacement every 3–7 days.20 Therefore, the development of minimally invasive continuous monitoring systems that can accurately measure the blood glucose concentration for long periods without frequent calibration and replacement is an unmet need in diabetes care.
To overcome the instability issues with electrochemical sensors, alternative approaches involving phenylboronic acid (PBA) derivatives and optical sensors have emerged. Functionalizing a hydrogel with PBA that exhibits affinity to diol-containing molecules can be exploited for continuous monitoring of glucose. Binding of PBA with glucose reversibly alters the volume of the hydrogel matrix.21−23 This mechanism of volumetric changes in glucose-selective hydrogels has motivated the investigation of glucose sensors. For example, hydrogels containing 3D crystalline colloidal arrays (CCAs) have been synthesized and functionalized with PBA after polymerization.24−26 The periodicity of the dielectric 3D photonic crystal (PC) embedded in hydrogel acts as a wavelength filter and diffracts specific wavelengths according to Bragg’s law. Thereby, any volumetric change because of variation in glucose concentration can be sensed as Bragg peak shifts. Recent studies focused on improving the selectivity, sensitivity, and response time of the inverse opal 3D PC hydrogels functionalized with PBA for glucose sensing.22,27−30 Nevertheless, the preparation of a 3D PC has stringent constraints; their fabrication is complex (monodispersed, highly charged microparticles), time-consuming (e.g., ion depletion, dialysis), and requires considerable optimization to realize the required lattice order.31 Recently, a hydrogel-based 2D CCA monolayer sensor was demonstrated.32,33 The volumetric changes of the hydrogel upon binding with glucose in 2D CCA sensors are based on the detection of the particle interspace variation that leads to a change in diffraction wavelength. Although fabrication of a 2D PC sensor is relatively less time-consuming compared to 3D PCs, it still requires a well-ordered monolayer of particles, optimization not to disrupt the array, and postpolymerization functionalization with PBA. Based on glucose-induced hydrogel volume modulation, reflection hologram-based sensors have also been realized.34,35 These sensors are sensitive to glucose but require a sophisticated fabrication technique based on continuous or pulsed laser recording. The complications in fabricating photonic crystal sensors hinder their way to mass production at low cost. Additionally, it remains a challenge to obtain visual quantitative readouts.
Here, a photonic microstructure-based sensor is developed via a facile stamping method on the surface of glucose-sensitive hydrogel networks. As a free-standing sensor, the volumetric changes of the hydrogel in response to the variation glucose concentration modulate the periodic constant of the microstructure, changing the diffraction angle and the zero/first-order interspacing for the diffracted monochromatic light in transmission mode. The sensor was also attached to the surface of a commercial contact lens, and a smartphone application was utilized to record the reflection power of the first-order diffracted light. The groove depth of the constrained sensor on the contact lens surface increased with glucose complexation, leading to a change in diffraction efficiency. This sensor offers advantages in terms of fast and facile preparation, swift response at low glucose concentrations, and simple readouts within physiological conditions.
Results and Discussion
The photonic structure (PS) was replicated on a hydrogel matrix during the UV curing process (Figure 1a). Surface characterization has confirmed successful replication of the 1D master PS on the hydrogel film as probed by an optical microscope (Figure 1b). Optical microscopy images revealed that the replicated structure on the hydrogel matrix was intact and well ordered. Photographs of the master PS and the prepared PS hydrogel sensor exhibited comparable diffraction colors and showed a complete visible spectrum (Figure 1c). The diffraction of broadband light in transmission mode by the PS hydrogel sensor produced visible colors (rainbow), as displayed on a screen (Figure 1c). Figure 1d shows the schematic of the setup for the transmission mode diffraction experiment. The setup was fixed on an optical bench and consisted of a 3D translation stage for controlling the position of the sample, and the broadband light source was used to illuminate the sample and to project a transmitted diffraction pattern on a screen.
Figure 1.
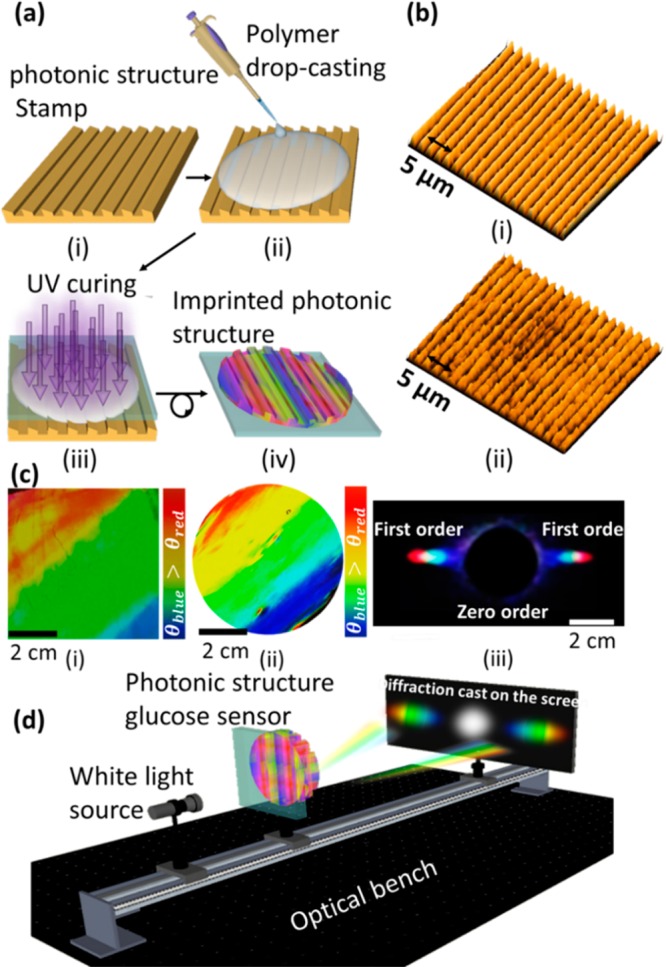
Fabrication process and surface characterization of the 1D PS sensor. (a) Schematic of the fabrication process of the hydrogel glucose sensor: (i) PS master was used as a stamp; (ii) PS was coated with a monomer solution by a drop-casting method; (iii) monomer solution was UV polymerized; (iv) replica of the stamp was peeled off from the master PS. (b) Optical microscope images of (i) the master PS and (ii) the stamped responsive hydrogel. (c) Photos of (i) the original grating, (ii) the prepared hydrogel sensor, and (iii) the diffraction pattern (transmission) for the white light source by the PS sensor. (d) Schematic of the setup used to project transmitted diffraction patterns.
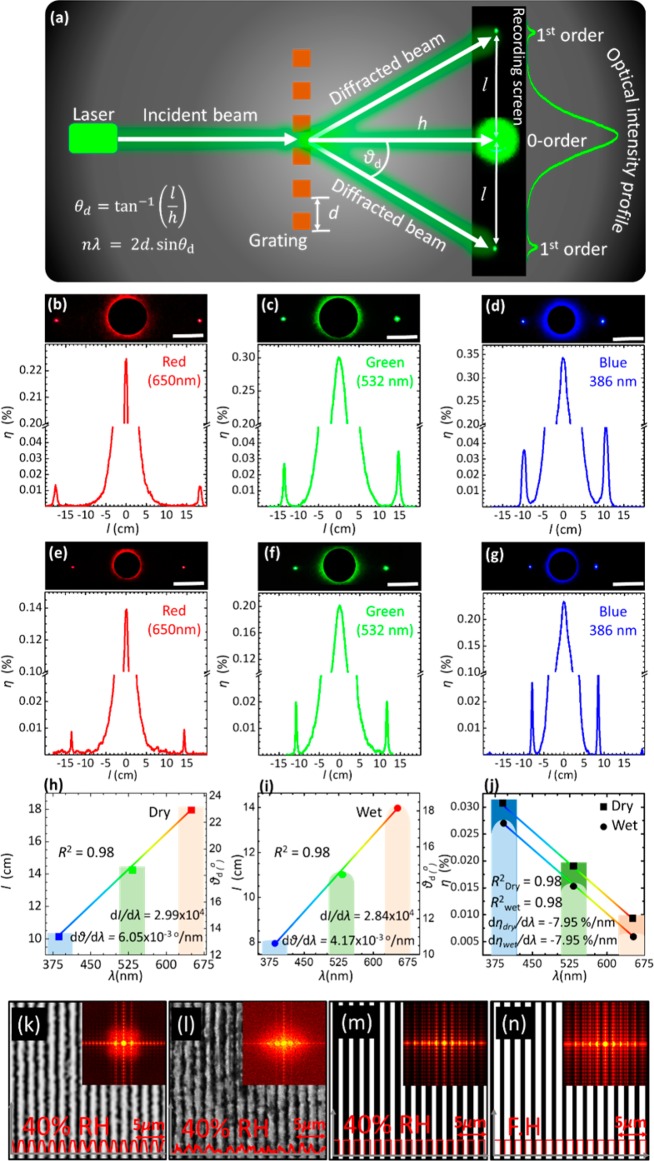
The diffraction of monochromatic blue (405 nm), green (532 nm), and red (650 nm) laser light by the PS sensor in transmission mode was studied in 40% relative humidity and fully hydrated conditions (equilibration in phosphate-buffered saline (PBS) solution) to record the swelling effect in terms of the change in diffraction pattern. When the sensor was illuminated at normal incidence, the diffracted light on the screen perpendicularly placed to the laser beam was observed in the form of a 1D interference fringe array. Photographs of the diffraction patterns for the three laser wavelengths were captured from a fixed distance to the imaging screen, and zero/first-order interspace (l), diffraction angles (θd), and diffraction efficiency were measured using the ImageJ program (Figure 2). The linear array of diffracted light from the 1D PS sensor obeyed the transmission grating formula, mλ = d(sin θi – sin θd), where m is an integer, λ is the diffraction wavelength, d is the periodic constant or groove constant, and θi and θd are the incidence and diffraction angles, respectively. In the experimental configuration, the transmission diffraction angle, θd, can be obtained from the relationship, θd = tan–1 lh–1, where h is the distance between the PS sensor and the imaging screen. The volumetric changes in PS sensor affected the periodicity constant, which subsequently altered the zero/first-order interspace. Conversely, change in periodic constant (Δd) and the diffraction angle (Δθd) could be determined by measuring the interspace between zero- and first-order fringes, and this principle allowed the measurements of the glucose concentration.
Figure 2.
Diffraction pattern of the PS hydrogel sensor when it is illuminated by a monochromatic light in 40% relative humidity and fully hydrated conditions. (a) Schematic setup for recording the diffraction in transmission mode. (b–d) Diffraction pattern of the PS sensor when it is illuminated by red (650 nm), green (532 nm), and blue (405 nm) lasers in 40% relative humidity conditions, respectively. (e–g) Diffraction pattern of the sensor in fully hydrated conditions when it is shined by red, green, and blue lasers, respectively (scale bar 8 cm). (h,i) Zero/first-order interspace versus laser wavelengths in 40% relative humidity and fully hydrated conditions. (j) Diffraction efficiency in 40% humidity and fully hydrated conditions for various laser wavelengths. (k,l) Microscopic images for the master grating and imprinted hydrogel surfaces in 40% relative humidity. (m,n) Schematic diagrams and Fourier transform for the hydrogel sensor in 40% relative humidity and fully hydrated (FH) conditions, respectively.
In 40% relative humidity conditions, θd and l for blue, green, and red beams were larger compared to their counterpart values in a fully hydrated case. The PS sensor swelled upon immersion in PBS solution, increasing the periodicity constant that decreased the diffraction angle, and consequently, the zero/first-order interspace shrunk. That is, for the red, green, and blue beams, l shrunk from its pristine values of around 18, 16, and 14 cm to 15, 13, and 11 cm, respectively, and the diffraction angles decreased from 23, 18, and 14° to 18, 14, and 11°, respectively. The diffraction angle was wavelength-dependent, where the smallest angle was for the blue light and the largest angle was for the red light, as expected according to the grating formula. In fully hydrated condition, the calculated values of θd and l using the grating formula were found to be consistent with the measured values using the identical experiment parameters; d = 1.6 μm, θi = 0°, and λ = 405, 532, and 650 nm. The absolute efficiency of the first order for the PS sensor was wavelength-dependent, and it subtly decreased in fully hydrated conditions. The highest diffraction efficiency was measured in the case of the blue beam, which decreased with increased illumination wavelength. In 40% relative humidity conditions, as d and θi are constants, and the absolute efficiencies were recorded to be 0.030, 0.028, and 0.009% for blue, green, and red laser beams, respectively. Thus, these results match with the grating formula that states the absolute efficiency is dependent upon the wavelength, incident angle, and the periodicity constant.36 The absolute efficiency of the PS sensor was inversely proportional to the periodicity constant—the first-order efficiencies in a fully hydrated condition for blue, green, and red lasers were ∼0.027, 0.015, and 0.006%, which were less than their counterparts in 40% relative humidity conditions.
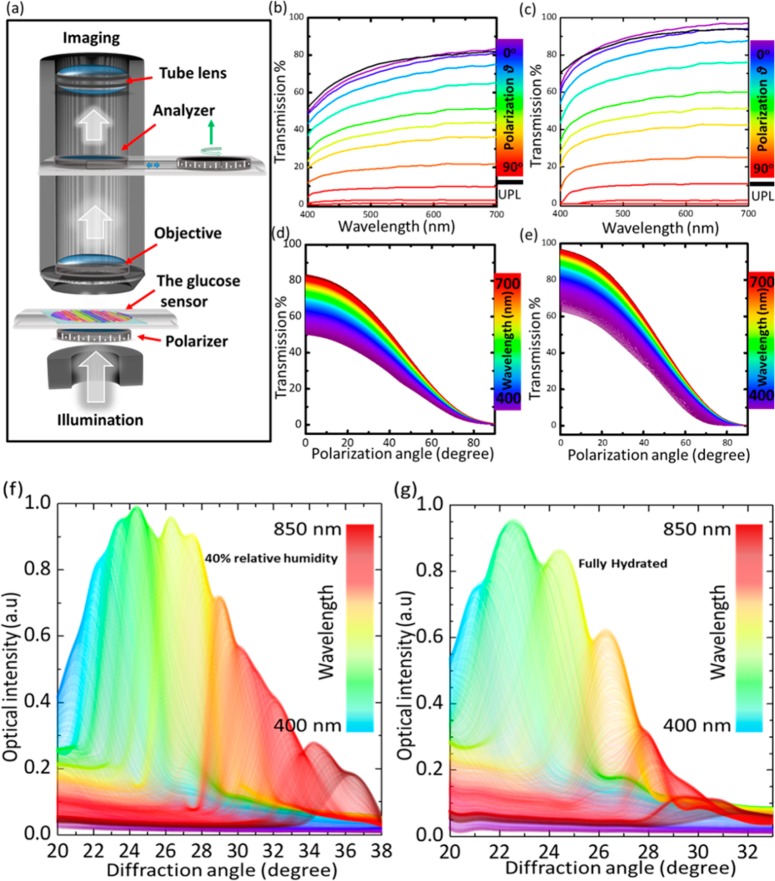
Transmission characteristics of the PS sensor were investigated at different polarization angles (0–90°) to study the swelling effect on the transmission properties and the sensor’s response to polarized light in 40% relative humidity and fully hydrated conditions. Figure 3a shows the schematic of the experimental setup for transmittance measurements. Transmittance of the sensor in fully hydrated conditions was higher than that in the 40% relative humidity case; this is due to the swelling of the hydrogel which absorbs more water that leads to a decrease of the refractive index and increases the periodic constant that decreases the diffraction efficiency of the sensor. The trend for transmission curves for all polarization angles remained similar in 40% relative humidity and fully hydrated conditions—transmittance increased gradually from shorter to longer wavelengths and decreased systematically with polarization angles. This could also be explained from the results in Figure 2, which showed that the diffraction efficiency for short wavelengths (blue laser beam) was higher than that of longer wavelength laser beams (green and red). The decrease of the transmission spectra over all the wavelength ranges with polarization angle confirmed that the PS sensor is insensitive to polarized light and exhibited no polarization effects itself.
Figure 3.
Transmittance properties of a photonic structure sensor. (a) Schematic for the setup of measuring the transmission of the sensor under various polarization angles. (b,c) Transmission of unpolarized and polarized light versus wavelengths at various polarization angles while the sensor was in 40% relative humidity and fully hydrated, respectively. (d,e) Transmission spectra of the sensor as a function of polarization angle across white light wavelengths (400–700 nm) in 40% relative humidity and fully hydrated conditions, respectively. (f,g) Angle-resolved measurements of the diffracted light in the reflection mode for the photonic structure sensor on a plane mirror in 40% relative humidity and fully hydrated conditions, respectively.
Angle-resolved diffraction measurements in reflection mode for the sensor in 40% relative humidity and fully hydrated conditions were recorded to analyze the hydrogel swelling effect (Figure 3f,g). First-order diffraction of the PS sensor in reflection mode was recorded using a spectrophotometer, while the sensor was fixed horizontally on an aluminum mirror and illuminated by a fiber-optic halogen light source. In 40% relative humidity conditions, the detector was rotated 18° (20–38°), to pick up the first-order diffraction rainbow of the 450–850 nm spectral range. However, for fully hydrated conditions, the same spectral bandwidth was picked up by traversing the detector within only 13° (20–33°), which is 5° less than that in 40% relative humidity conditions. This was due to the expanding periodic constant upon hydrogel swelling of the PS sensor that leads to a decrease in the angular dispersion of PS and shrinks the spatially separated rainbow.
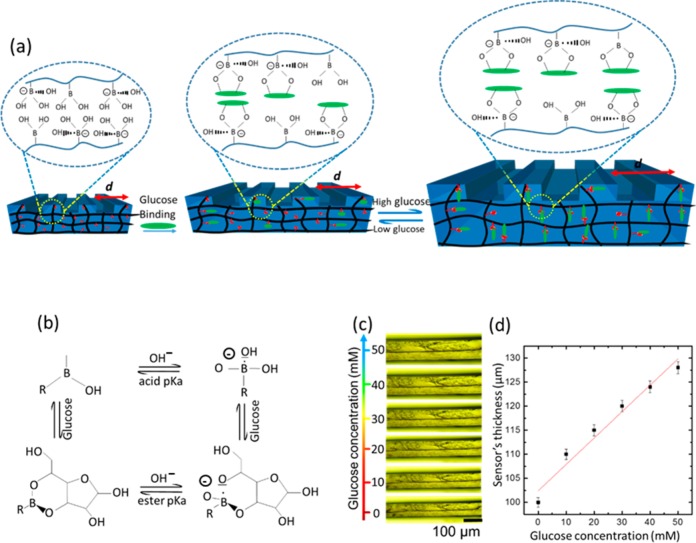
Sensing was first carried out by investigating the cross section variation of the PS sensor in various glucose concentrations at 24 °C. The cross section dynamics of the hydrogel matrix were measured under an optical microscope and correlated with glucose concentrations (Figure 4d and Supporting Information Figure S1). Boronic acid has a pKa ∼8.8, and at low pH values (pH < pKa), PBA exists in an uncharged trigonal planar configuration. When PBA interacts with cis-diol molecules, a cyclic ester is formed whose pKa is less than that of boronic acid and dissociates into the hydrogen ion and the stable boronate anion (Figure 4b). At higher pH values in an aqueous solution (pH > pKa), the trigonal form of PBA dissociates, donating a proton to form a boronate ion of tetrahedral configuration that binds to cis-diol molecules (Figure 4b).37 PBA reversibly bind with diols in glucose, forming either a 1:1 complex or a 2:1 cross-linking complex. Glucose-induced PS sensor swelling resulted from the anionic 1:1 complexation of boronate–glucose in the hydrogel matrix that increased the boronate anions; subsequently, the Donnan osmatic pressure increased to swell the hydrogel.38 The hydrogel swelling upon glucose binding occurs not only across the cross section but also in-plane to the surface, increasing the periodic constant (d). First, the sensor was equilibrated in PBS solution (pH 7.4, ionic strength = 150 mM) for 2 h, then thickness measurements of the hydrogel cross section were carried out after 60 min for each concentration. Glucose concentrations (0–50 mM) in PBS solution with 10 mM increments were presented to the PS and analyzed under an optical microscope (Figure 4c). The sensor swelled due to glucose binding, and the cross section linearly increased with increasing concentrations. When the glucose concentration was increased from 0 to 10 mM, the sensor’s cross section thickness increased from an original value of 100 to 110 μm and reached 130 μm for 50 mM glucose concentration (Figure 4d).
Figure 4.
Sensing principle of the 1D photonic structure sensor. (a) Effect of the glucose–phenylboronic acid complexation in the 1D PS sensor. (b) Complexation equilibrium between the boronic acid and glucose. (c) Microscopic images of the 1D PS sensor’s cross section in various glucose concentrations. (d) Change in the sensor’s cross section as a function of glucose concentration. The scale bars show standard error (n = 3).
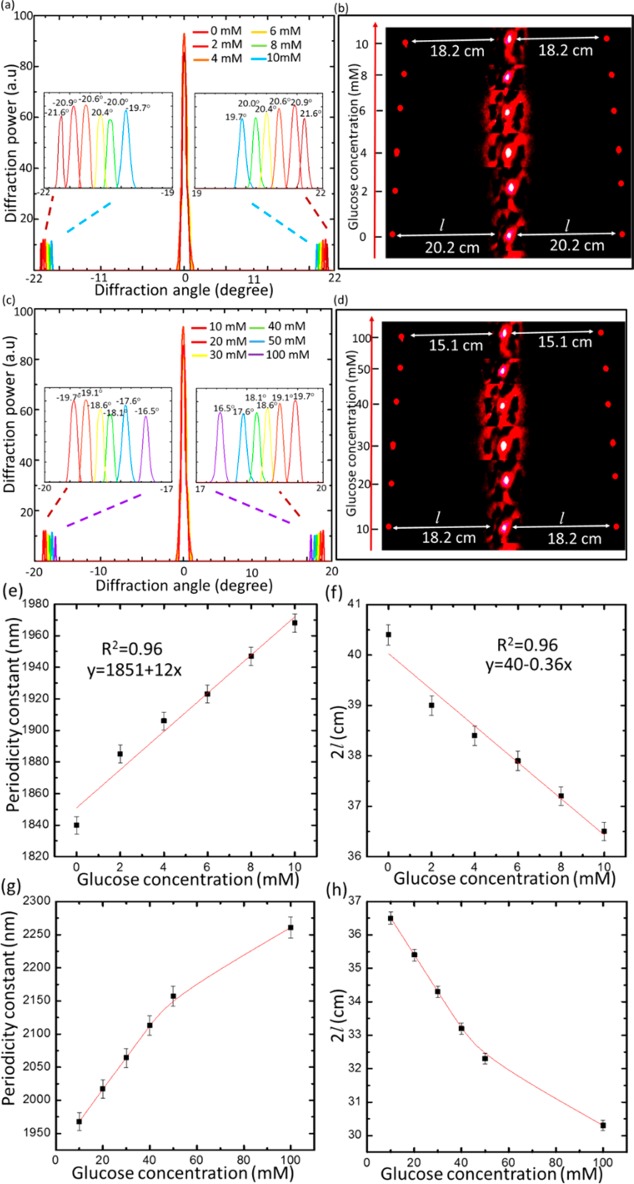
Diffraction experiments in transmission mode for the PS sensor at physiological conditions were carried out to quantify glucose concentrations. The setup used for the sensor readout consisted of an image screen and a red laser pointer as a beam source. The glucose binding induced swelling in the periodic constant (d), leading to shrinkage of zero/first-order interspace (l), and decreased the diffraction angle (θd). For low glucose concentrations, the interspace (l) linearly decreased from 20.2 to 18.3 cm, in response to an increase in glucose concentration from 0 to 10 mM, when d increased from 1840 to 1968 nm with an overall 128 nm increase (Figure 5a,b). For high glucose concentrations from 10 to 50 mM, the sensor produced a linear response, and the periodic constant increased by 180 nm to reach 2150 nm, shrinking the zero/first-order interspace to 16.1 cm, a 2.1 cm decrease (Figure 5c,d). When the glucose concentration increased to 100 mM, the periodic spacing increased to 2270 nm by a 120 nm shift. The slope of the linear relation for the periodic constant versus the glucose concentration was 12 nm/mM in the low glucose concentration range (0–10 mM), which was more than double the slope of the linear relation (4.5 nm/mM) for the high glucose concentration range (10–50 mM). This indicated that the sensor’s sensitivity decreased above 10 mM, and this might be due to the decrease in the elasticity of the hydrogel matrix by swelling.39 The sensor’s sensitivity decreased subtly with increasing glucose concentrations and had nonlinear response above 50 mM (Figure 5g,h).
Figure 5.
Glucose sensing via recording the diffraction images of the PS sensor in transmission mode. (a) Transmitted diffraction pattern for the PS sensor in low glucose concentrations (0–10 mM). (b) Images taken by a camera of the diffraction pattern on the screen for the grating sensor immersed in low glucose concentrations, from 0 to 10 mM. (c) Transmitted diffraction of the sensor in high glucose concentrations from 10 to 100 mM. (d) Images of the diffraction pattern on a screen for the sensor immersed in high glucose concentrations. (e) Dependence of the periodic constant of the PS sensor on glucose concentrations (0–10 mM) in PBS (ionic strength 150 mM, pH 7.4 at 24°) as probed by a red laser beam in normal incidence configuration. (f) Dependence of the interspace of the first-order diffraction spots (2l) on glucose concentrations (0–10 mM). (g) Periodic constant of the sensor versus high glucose concentrations (10–100 mM) in a PBS of ionic strength 150 mM, pH 7.4 at 24 °C. (h) Interspace between the first-order spots for the sensor in high glucose concentrations. The scale bars show standard error (n = 3).
The sensitivity of the sensor for glucose can be
given by the slope
of the linear correlation of the periodic constant versus the glucose concentration,  , where
Δd is the
change in the periodicity constant and Δcon is the
change in glucose concentration. For low glucose concentrations (0–10
mM), which is the most significant range (human physiological range
such as in tears, urine, and blood), the sensitivity of the PS sensor
was ∼12.8 nm/mM, which resulted in a decrease of 3.7 mm between
the first-order spots, whereas the image screen was placed at 50 cm
away from the sensor. Within the range of 10–50 mM, the sensor’s
sensitivity decreased to ∼4.5 nm/mM, and this behavior agrees
with previously reported work.24,25,27,39 As 3PBA complexes with cis-diol molecules, both lactate and fructose, which are
present in the blood, were estimated to interfere by 5% in the sensor
readouts.40
It is well-known that the constrained sensors that undergo volumetric change in only one dimension (1D) upon glucose binding are more sensitive compared to the free-standing systems.41 However, the free-standing 1D PS sensor swells isotropically in 3D, and it shows a significantly high response compared to the physically constrained 3D crystalline colloidal array sensor. The 1D holographic and polymerized crystalline colloidal array (PCCA)-based glucose sensors exhibit 300 nm wavelength shift over a glucose range from 0 to 50 mM.27,34 The 1D PS sensor increased by 310 nm in the periodicity constant for the same glucose concentration range. Diffraction measurements from holographic and PCCA arrays are relatively complex and require measurements in the dark to prevent ambient light interference and a high-cost fiber-optic spectrophotometer.40 In contrast, readout and quantitative measurements of the glucose concentration by the PS sensor only requires a screen and a laser pointer, which renders this approach simple, low-cost, and practical. When the sensitivity of the 1D PS sensor is compared with the 2D sensors that are free-standing, the PS offers nearly double their sensitiviy. For example, in 2D glucose sensors, particle spacing shifted by 7 nm/mM glucose concentration in the range from 0 to 10 mM, but the periodic constant of the PS sensor shifted by 12 nm/mM.31 The higher sensitivity of the PS sensor compared to that of the 2D array sensors can be attributed to the larger active surface area of the PS sensor as the stamped photonic structure increases the active surface area. In contrast, the existing 2D arrays compose of unactive polysterene particles, which reduce the sensor’s active area.
The swelling kinetics of the PS sensor upon glucose binding has been studied for low (2 mM) and high (10 mM) glucose concentrations. The periodic constant change of the sensor was recorded every 5 min for each concentration. The sensor exhibited rapid response to glucose and reached complexation equilibrium in 25 and 20 min for low and high glucose concentrations, respectively (Figure 6a,b). The low glucose concentration (2 mM) had longer time to reach saturation (25 min), which agreed with the previously reported work.40,42 In recent studies, the saturation time for the 3PBA-modified PCCAs was 40 min for 10 mM glucose concentration, which was double the saturation time (20 min) for our sensor.27 Additionally, the saturation time for 3PBA_holographic sensors was 120 min for low glucose concentration and more than 50 min for high glucose concentrations.40 The rapid response for low and high glucose concentrations is one of the advantageous characteristics of the PS sensor that can be explained by increased active surface area by printing the PS on the top of the responsive hydrogel matrix that improved the glucose diffusion rate.
Figure 6.
Response kinetics of the PC sensor: (a) swelling kinetics of the sensor in PBS of 2 mM glucose, (b) 10 mM glucose (pH 7.4 and ionic strength 150 mM). Scale bar = 10 cm. (c) Periodicity constant versus time for 10 mM glucose concentration during three cycles as the sensor was reset for 10 s in pH 4.6 then 60 min in PBS in each cycle.
To investigate the stability and reusability of the sensor, the response of the sensor during three cycles was recorded (Figure 6c). The sensor was examined for 60 min and then reset by a buffer solution of pH 4.6 for 10 s and 60 min in PBS before the next cycle (Figure 6c). The periodic spacing swelled to become 1905 ± 3 nm from its original value of 1840 nm in each cycle, and by resetting, d shrinks to its pristine value of around 1840 ± 3 nm each time without hysteresis.
Back-diffraction measurements were employed to confirm that the PS sensor can sense glucose by this method, as well. The sensor was placed at a horizontal mirror and illuminated by a broadband source at 38° (Figure 7a). The back-diffracted light was collected by the spectrophotometer fixed at a precision rotation stage. Figure 7b–f illustrates the experimental data for diffracted light plotted against wavelength at various diffraction angles for glucose concentrations from 10 to 50 mM. The whole spectra at certain detection angles underwent a red shift (Figure 7g). This was in accordance with the diffraction law, where diffracted spectra traversed a negative displacement (i.e., decreasing angle) upon positive increment in the periodic constant, which also supported angle-resolved measurements carried out in the reflection mode. The diffracted wavelength shifts from 470 to 504 nm upon glucose concentration from 10 to 50 mM.
Figure 7.
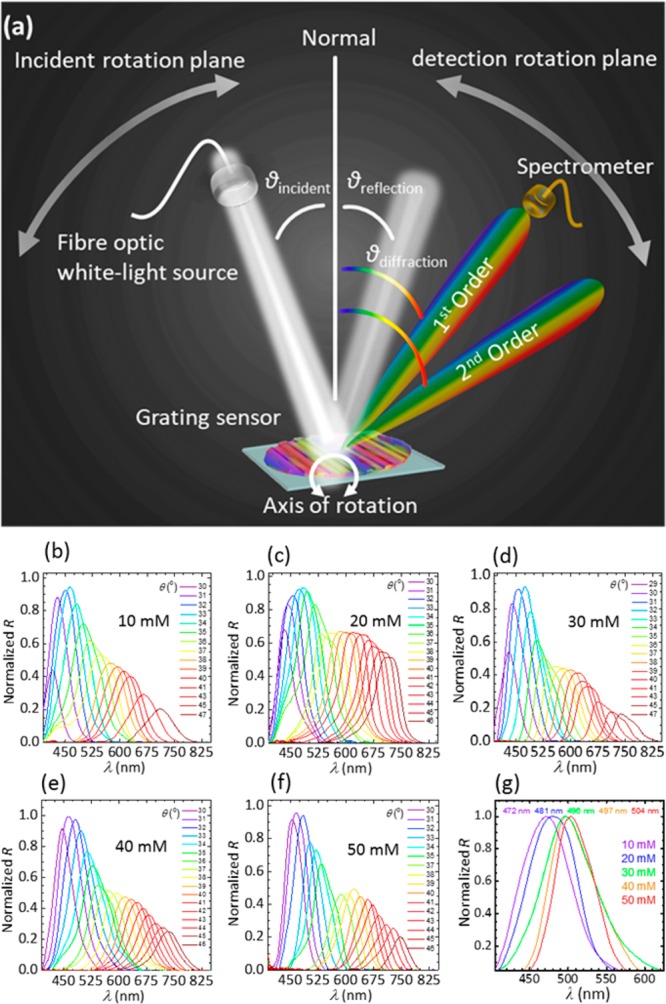
Sensing glucose by measuring the diffracted light in the reflection mode. (a) Schematic of the setup used for measuring the diffraction in the reflection mode. (b–f) Light diffraction versus wavelengths at various diffraction angles for the PS sensor in various glucose concentrations from 10 to 50 mM. (g) Dependence of the diffracted wavelength on the glucose concentration.
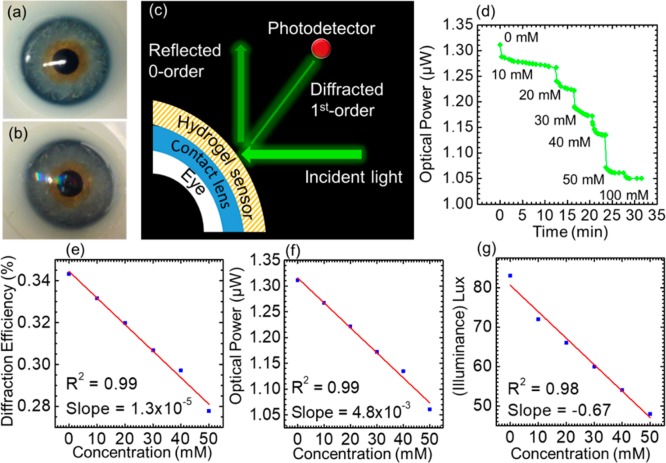
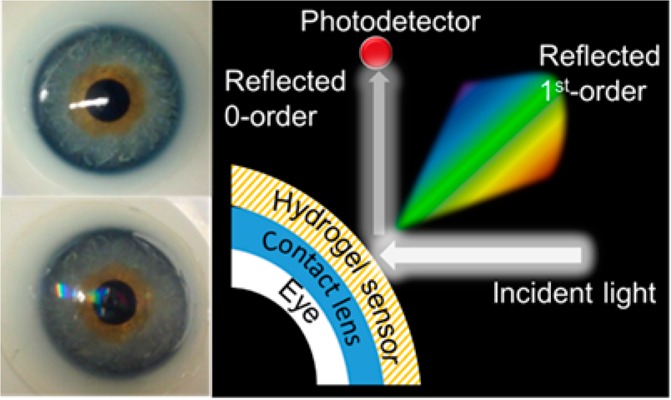
The utility of the glucose sensor was demonstrated in the form of a point-of-care wearable sensor; the sensor was attached to a commercial contact lens, and the glucose concentration was measured by a smartphone app (Figure 8a–c). As shown in Figure 8b, the sensor exhibits a rainbow light effect on the contact lens surface under normal room light conditions. For the constrained sensor on the contact lens surface, the glucose concentration was monitored by recording the reflected power of the first-order spot (P1). The constraint offered by the contact lens does not allow the grating spacing to significantly change; however, the groove depth of the sensor increases with glucose complexing, leading to changes in the diffraction efficiency (P1/Po). The contact lens was illuminated with a low power monochromatic light with a wavelength of 532 nm, and the reflected power of the first-order spot was recorded by a powermeter and a smartphone’s photodetector. Continuous monitoring of the reflected power in response to glucose concentrations (0–50 mM) was carried out (Figure 8d–g). As the contact lens was used as the substrate platform for the sensor, this allowed us to cut down the sensor thickness to around ∼2 μm, which offered a fast response time of around 3 s, and reached an equilibrium state in 12, 4, 4, 2, 2, and 1.5 min for glucose concentrations of 10, 20, 30, 40, 50, and 100 mM, respectively (Supporting Information Figure S2). The response and saturation times for the contact-lens-based PS sensor are impressive compared to those in a recently published report, where an equilibrium time of ∼20 min was recorded.38 The effect of the mechanical strain on the output signal of the contact lens sensor was also studied (Supporting Information Figure S3). The contact lens with an integrated photonic sensor was exposed to an extension force, and the change in the output signal was recorded by an optical powermeter. The mechanical strain was monitored against the reflected power in the first-order spot. A 2.2% change in the mechanical strain affected the output signal by 3.0%. In the present work, it was found that increasing the glucose concentration from 0 to 50 mM decreased the output power by ∼20% (1.31–1.05 μW). Therefore, a 2.2% change in the mechanical strain caused 13% interference in the output reading when the sensor monitored a glucose concentration of 50 mM. This interference may increase at lower glucose concentrations. For example, for 10 mM glucose concentration, the interference is expected to be ∼40%. Therefore, the sensor is not recommended for patients who suffer from eye diseases that change the intraocular pressure. The PS glucose sensor attached to the contact lens had advantages compared to the previously proposed electrochemical and fluorescent glucose sensors attached to contact lenses. The PS contact lens sensor was easy and quick to be fabricated, and its readout does not require high-cost complex equipment. In addition, the sensor was nontoxic and biocompatible. Moreover, the sensor cost was reasonable, and it had a rapid response. On the contrary, the electrochemical sensors attached to contact lenses are associated with significant fabrication complexity. In 2014, Google announced the development of a glucose monitoring contact lens; however, it has not released the product yet. Their prototype was composed of an electrochemical glucose sensor, antenna, power supply, and light-emitting diode, and it is embedded between two layers of lens material. A significant challenge of this electrochemical technology concerns the limitations in miniaturization of electronics in contact lenses. Additionally, the capability to transmit power and receive data from a contact lens remains a hurdle. Furthermore, fluorescent sensors have many disadvantages, such as hotobleaching, and the pH/oxygen of the environment can interfere with the dye’s response. In addition, the potential toxicity of the dyes and their potential accumulation in the cells is a major safety concern. Moreover, the sensor’s materials are costly, and the readout is complicated as it requires an expensive appliance (spectrofluorometer) and a dedicated monochromatic light source.
Figure 8.
Contact lens integrated glucose sensor. (a) Photograph of a commercial contact lens on an artificial eye. (b) Photograph of the sensor attached to the contact lens and placed on the eye model. (c) Schematic diagram of the measurement setup. (d) Reflected optical power of the diffracted first-order for various glucose concentrations (0–50 mM) versus time measured using the optical powermeter. (e) Diffraction efficiency of the sensor versus glucose concentrations (0–50 mM). (f) Optical power of the first-order spot reflected from the sensor against glucose concentrations. (g) Reflected illuminance recorded by a smartphone against glucose concentration.
Conclusion
A photonic structure glucose sensor was developed and integrated with a contact lens that operates within the physiological conditions (pH 7.4, 150 mM ionic strength). The whole fabrication processes of the PS sensor involving polymerization, functionalizing the hydrogel, printing the PS, and attaching the sensor to the contact lens were carried out in one step, requiring a short time of nearly 5 min. The volumetric change resulting from glucose binding to the hydrogel sensor was monitored by two different strategies: for the free-standing PS sensor, the periodicity constant through measuring the zero/first-order interspace (l), and for the contact-lens-based sensor, the diffraction efficiency or the power of the first-order spot. The PS sensor that is constrained on the contact lens has advantages of rapid response time (3 s), a short saturation time (4 min), and high sensitivity. Thus, a rapid and highly sensitive glucose sensor was developed, and it offers simple/visual quantitative readouts. Contact lenses based on PS sensor may find applications in quantitative glucose measurements at point-of-care settings.
Methods
Materials and Fabrication
Acrylamide (AA), N,N′-methylenebis(acrylamide) (BIS), 3-(acrylamido)phenylboronic acid (3-APBA), dimethylsulfoxide (DMSO), 2,2-diethoxyacetophenone (DEAP), β-d-(+) glucose, and PBS were purchased from Sigma-Aldrich and used without further purification.
The acrylamide hydrogel film was synthesized by free radical polymerization utilizing DEAP as the photoinitiator and BIS as the cross-linker. The monomer solution was prepared from AA (78.5 mol %), BIS (1.5 mol %), 3-APBA (20 mol %), and DEAP in DMSO. The suspended monomer solution was stir-mixed for 10 min at 24 °C. Monomer solution (100 μL) was drop-cast directly onto a 1D photonic structure (600 lines mm–1). A hydrophobic glass slide was placed on top the solution to obtain a layer having uniform thickness. Photopolymerization process was initiated with a UV lamp (Black Ray, 365 nm), and the sample was exposed to UV light for 5 min. The resulting periodic microstructure hydrogel was peeled off from the master 1D photonic structure and washed three times with deionized water and kept in dry conditions in the dark prior to experiments.
Photonic Device Characterization
The photonic hydrogel sensor (PHS) and the original 1D structure were investigated by optical microscopy (Zeiss, 100× objective lens). Upon illumination with blue (405 nm), green (532 nm), and red (650 nm) lasers, the diffraction of monochromatic light (transmission mode) of the PHS in 40% relative humidity and fully hydrated conditions was recorded to investigate the effect of swelling on the PHS’s diffraction pattern. The setup was fixed on an optical bench and composed of a 3D movable holder for the sample, another movable holder for the light source, and a movable screen on which the diffraction pattern was projected. A digital camera was fixed near by the screen, where the diffraction fringes for each blue, green, and red lasers were captured. These images were analyzed by ImageJ (NIH) to measure the zero/first-order interspace and the absolute diffraction efficiency. Transmission spectra of the sensor at various polarization angles were recorded by a UV–vis spectrometer attached to an optical microscope (Zeiss, 5× objective lens). The PS sensor was illuminated by a broadband white light source, where light passed through a linear polarizer and propagated through the sensor. Transmitted light passed through another linear polarizer which could be rotated from 0 to 90°. A 20× tube lens collected the transmitted light at the imaging side of the microscope, which was coupled with a photodetector to measure the spectra. Angle-resolved measurements for the sensor were acquired by collecting the back-diffracted light, while the sensor was positioned on an aluminum mirror and was illuminated by a halogen light source (Ocean Optics HL-2000). The incident angle of the white light was fixed at 38°, and the back-diffracted light was collected by rotating the detector. To characterize the response of the photonic hydrogel sensor to the variation in glucose concentration, the hydrogel was equilibrated in PBS (7.4 pH, 24 °C, ionic strength = 150 mM) for 2 h. Glucose concentrations from 0 to 100 mM were prepared in the same PBS. The sensor’s cross section was measured under the optical microscope (5× lens) in different glucose concentrations. The diffraction of a monochromatic light in transmission mode for the sensor was utilized for visual detection of the glucose concentrations.
Acknowledgments
The authors thank for the Wellcome Trust for research funding.
Supporting Information Available
The Supporting Information is available free of charge on the ACS Publications website at DOI: 10.1021/acsnano.8b00829.
Sensor’s cross section versus glucose concentration, kinetic swelling for the contact-lens-attached sensor in various glucose concentrations in detail, and effect of the mechanical strain on the sensor’s output signal (PDF)
Author Contributions
M.E. and H.B. conceived the project idea. M.E. designed the project, carried out experiments, analyzed results, and wrote the article. H.B. supervised experiments and led the project. M.U.H. and A.K.Y. revised the manuscript and provided intellectual contributions throughout the project.
The authors declare no competing financial interest.
Supplementary Material
References
- Zimmet P. Z.; Magliano D. J.; Herman W. H.; Shaw J. E. Diabetes: A 21st Century Challenge. Lancet Diabetes Endocrinol. 2014, 2, 56–64. 10.1016/S2213-8587(13)70112-8. [DOI] [PubMed] [Google Scholar]
- Danaei G.; Finucane M. M.; Lu Y.; Singh G. M.; Cowan M. J.; Paciorek C. J.; Lin J. K.; Farzadfar F.; Khang Y.-H.; Stevens G. A.; Rao M.; Ali M. K.; Riley L. M.; Robinson C. A.; Ezzati M. National, Regional, and Global Trends in Fasting Plasma Glucose and Diabetes Prevalence since 1980: Systematic Analysis of Health Examination Surveys and Epidemiological Studies with 370 Country-Years and 2·7 Million Participants. Lancet 2011, 378, 31–40. 10.1016/S0140-6736(11)60679-X. [DOI] [PubMed] [Google Scholar]
- Centers for Disease Control and Prevention. National diabetes fact sheet: national estimates and general information on diabetes and prediabetes in the United States, 2011. U.S. Department of Health and Human Services, Centers for Disease Control and Prevention, Atlanta, GA, 2011.
- Zoungas S.; Patel A.; Chalmers J.; de Galan B. E.; Li Q.; Billot L.; Woodward M.; Ninomiya T.; Neal B.; MacMahon S.; et al. Severe Hypoglycemia and Risks of Vascular Events and Death. N. Engl. J. Med. 2010, 363, 1410–1418. 10.1056/NEJMoa1003795. [DOI] [PubMed] [Google Scholar]
- Inzucchi S. E.; Bergenstal R. M.; Buse J. B.; Diamant M.; Ferrannini E.; Nauck M.; Peters A. L.; Tsapas A.; Wender R.; Matthews D. R. Management of Hyperglycemia in Type 2 Diabetes: A Patient-Centered Approach. Diabetes Care 2012, 35, 1364–1379. 10.2337/dc12-0413. [DOI] [PMC free article] [PubMed] [Google Scholar]
- Usher-Smith J. A.; Thompson M. J.; Sharp S. J.; Walter F. M. Factors Associated with the Presence of Diabetic Ketoacidosis at Diagnosis of Diabetes in Children and Young Adults: A Systematic Review. BMJ 2011, 343, d4092. 10.1136/bmj.d4092. [DOI] [PMC free article] [PubMed] [Google Scholar]
- Nathan D. M. Long-Term Complications of Diabetes Mellitus. N. Engl. J. Med. 1993, 328, 1676–1685. 10.1056/NEJM199306103282306. [DOI] [PubMed] [Google Scholar]
- Olansky L.; Kennedy L. Finger-Stick Glucose Monitoring. Diabetes Care 2010, 33, 948–949. 10.2337/dc10-0077. [DOI] [PMC free article] [PubMed] [Google Scholar]
- Norman J. J.; Brown M. R.; Raviele N. A.; Prausnitz M. R.; Felner E. I. Faster Pharmacokinetics and Increased Patient Acceptance of Intradermal Insulin Delivery Using a Single Hollow Microneedle in Children and Adolescents with Type 1 Diabetes. Pediatr. Diabetes 2013, 14, 459–465. 10.1111/pedi.12031. [DOI] [PubMed] [Google Scholar]
- Ul Hasan K.; Asif M. H.; Hassan M. U.; Sandberg M. O.; Nur O.; Willander M.; Fagerholm S.; Strålfors P. A Miniature Graphene-Based Biosensor for Intracellular Glucose Measurements. Electrochim. Acta 2015, 174, 574–580. 10.1016/j.electacta.2015.06.035. [DOI] [Google Scholar]
- Wilson G. S.; Hu Y. Enzyme-Based Biosensors for in Vivo Measurements. Chem. Rev. 2000, 100, 2693–2704. 10.1021/cr990003y. [DOI] [PubMed] [Google Scholar]
- Nichols S. P.; Koh A.; Storm W. L.; Shin J. H.; Schoenfisch M. H. Biocompatible Materials for Continuous Glucose Monitoring Devices. Chem. Rev. 2013, 113, 2528. 10.1021/cr300387j. [DOI] [PMC free article] [PubMed] [Google Scholar]
- Wang J. Electrochemical Glucose Biosensors. Chem. Rev. 2008, 108, 814–825. 10.1021/cr068123a. [DOI] [PubMed] [Google Scholar]
- Heller A.; Feldman B. Electrochemical Glucose Sensors and Their Applications in Diabetes Management. Chem. Rev. 2008, 108, 2482–2505. 10.1021/cr068069y. [DOI] [PubMed] [Google Scholar]
- Choudhary P.; Ramasamy S.; Green L.; Gallen G.; Pender S.; Brackenridge A.; Amiel S. A.; Pickup J. C. Real-Time Continuous Glucose Monitoring Significantly Reduces Severe Hypoglycemia in Hypoglycemia-Unaware Patients with Type 1 Diabetes. Diabetes Care 2013, 36, 4160–4162. 10.2337/dc13-0939. [DOI] [PMC free article] [PubMed] [Google Scholar]
- van Dijk J.-W.; van Loon L. J. Exercise Strategies to Optimize Glycemic Control in Type 2 Diabetes: A Continuing Glucose Monitoring Perspective. Diabetes Spectr. 2015, 28, 24–31. 10.2337/diaspect.28.1.24. [DOI] [PMC free article] [PubMed] [Google Scholar]
- Maurizi A. R.; Pozzilli P. Do We Need Continuous Glucose Monitoring in Type 2 Diabetes?. Diabetes/Metab. Res. Rev. 2013, 10.1002/dmrr.2450. [DOI] [PubMed] [Google Scholar]
- Monnier L.; Colette C.; Boegner C.; Pham T.; Lapinski H.; Boniface H. Continuous Glucose Monitoring in Patients with Type 2 Diabetes: Why? When? Whom?. Diabetes Metab. 2007, 33, 247–252. 10.1016/j.diabet.2006.11.007. [DOI] [PubMed] [Google Scholar]
- Durner J. Clinical Chemistry: Challenges for Analytical Chemistry and the Nanosciences from Medicine. Angew. Chem., Int. Ed. 2010, 49, 1026–1051. 10.1002/anie.200903363. [DOI] [PubMed] [Google Scholar]
- Rodbard D. Continuous Glucose Monitoring: A Review of Successes, Challenges, and Opportunities. Diabetes Technol. Ther. 2016, 18, S2-3. 10.1089/dia.2015.0417. [DOI] [PMC free article] [PubMed] [Google Scholar]
- Kikuchi A.; Suzuki K.; Okabayashi O.; Hoshino H.; Kataoka K.; Sakurai Y.; Okano T. Glucose-Sensing Electrode Coated with Polymer Complex Gel Containing Phenylboronic Acid. Anal. Chem. 1996, 68, 823–828. 10.1021/ac950748d. [DOI] [PubMed] [Google Scholar]
- Lee Y.-J.; Pruzinsky S. A.; Braun P. V. Glucose-Sensitive Inverse Opal Hydrogels: Analysis of Optical Diffraction Response. Langmuir 2004, 20, 3096–3106. 10.1021/la035555x. [DOI] [PubMed] [Google Scholar]
- Matsumoto A.; Ikeda S.; Harada A.; Kataoka K. Glucose-Responsive Polymer Bearing a Novel Phenylborate Derivative as a Glucose-Sensing Moiety Operating at Physiological Ph Conditions. Biomacromolecules 2003, 4, 1410–1416. 10.1021/bm034139o. [DOI] [PubMed] [Google Scholar]
- Alexeev V. L.; Das S.; Finegold D. N.; Asher S. A. Photonic Crystal Glucose-Sensing Material for Noninvasive Monitoring of Glucose in Tear Fluid. Clin. Chem. 2004, 50, 2353–2360. 10.1373/clinchem.2004.039701. [DOI] [PubMed] [Google Scholar]
- Alexeev V. L.; Sharma A. C.; Goponenko A. V.; Das S.; Lednev I. K.; Wilcox C. S.; Finegold D. N.; Asher S. A. High Ionic Strength Glucose-Sensing Photonic Crystal. Anal. Chem. 2003, 75, 2316–2323. 10.1021/ac030021m. [DOI] [PubMed] [Google Scholar]
- Asher S. A.; Alexeev V. L.; Goponenko A. V.; Sharma A. C.; Lednev I. K.; Wilcox C. S.; Finegold D. N. Photonic Crystal Carbohydrate Sensors: Low Ionic Strength Sugar Sensing. J. Am. Chem. Soc. 2003, 125, 3322–3329. 10.1021/ja021037h. [DOI] [PubMed] [Google Scholar]
- Zhang C.; Losego M. D.; Braun P. V. Hydrogel-Based Glucose Sensors: Effects of Phenylboronic Acid Chemical Structure on Response. Chem. Mater. 2013, 25, 3239–3250. 10.1021/cm401738p. [DOI] [Google Scholar]
- Zhang C.; Cano G. G.; Braun P. V. Linear and Fast Hydrogel Glucose Sensor Materials Enabled by Volume Resetting Agents. Adv. Mater. 2014, 26, 5678–5683. 10.1002/adma.201401710. [DOI] [PubMed] [Google Scholar]
- Honda M.; Kataoka K.; Seki T.; Takeoka Y. Confined Stimuli-Responsive Polymer Gel in Inverse Opal Polymer Membrane for Colorimetric Glucose Sensor. Langmuir 2009, 25, 8349–8356. 10.1021/la804262b. [DOI] [PubMed] [Google Scholar]
- Nakayama D.; Takeoka Y.; Watanabe M.; Kataoka K. Simple and Precise Preparation of a Porous Gel for a Colorimetric Glucose Sensor by a Templating Technique. Angew. Chem. 2003, 115, 4329–4332. 10.1002/ange.200351746. [DOI] [PubMed] [Google Scholar]
- Xue F.; Meng Z.; Wang F.; Wang Q.; Xue M.; Xu Z. A 2-D Photonic Crystal Hydrogel for Selective Sensing of Glucose. J. Mater. Chem. A 2014, 2, 9559–9565. 10.1039/C4TA01031K. [DOI] [Google Scholar]
- Zhang J.-T.; Smith N.; Asher S. A. Two-Dimensional Photonic Crystal Surfactant Detection. Anal. Chem. 2012, 84, 6416–6420. 10.1021/ac300174m. [DOI] [PubMed] [Google Scholar]
- Zhang J.-T.; Wang L.; Chao X.; Asher S. A. Periodicity-Controlled Two-Dimensional Crystalline Colloidal Arrays. Langmuir 2011, 27, 15230–15235. 10.1021/la203363e. [DOI] [PubMed] [Google Scholar]
- Kabilan S.; Marshall A. J.; Sartain F. K.; Lee M.-C.; Hussain A.; Yang X.; Blyth J.; Karangu N.; James K.; Zeng J.; et al. Holographic Glucose Sensors. Biosens. Bioelectron. 2005, 20, 1602–1610. 10.1016/j.bios.2004.07.005. [DOI] [PubMed] [Google Scholar]
- Lee M.-C.; Kabilan S.; Hussain A.; Yang X.; Blyth J.; Lowe C. R. Glucose-Sensitive Holographic Sensors for Monitoring Bacterial Growth. Anal. Chem. 2004, 76, 5748–5755. 10.1021/ac049334n. [DOI] [PubMed] [Google Scholar]
- Loewen E. G.; Popov E.. Diffraction Gratings and Applications; Marcel Dekker: New York, 1997. [Google Scholar]
- Egawa Y.; Miki R.; Seki T. Colorimetric Sugar Sensing Using Boronic Acid-Substituted Azobenzenes. Materials 2014, 7, 1201–1220. 10.3390/ma7021201. [DOI] [PMC free article] [PubMed] [Google Scholar]
- Yetisen A. K.; Jiang N.; Fallahi A.; Montelongo Y.; Ruiz-Esparza G. U.; Tamayol A.; Zhang Y. S.; Mahmood I.; Yang S. A.; Kim K. S.; et al. Glucose-Sensitive Hydrogel Optical Fibers Functionalized with Phenylboronic Acid. Adv. Mater. 2017, 29, 1606380. 10.1002/adma.201606380. [DOI] [PMC free article] [PubMed] [Google Scholar]
- Elsherif M.; Hassan M. U.; Yetisen A. K.; Butt H. Glucose Sensing with Phenylboronic Acid Functionalized Hydrogel-Based Optical Diffusers. ACS Nano 2018, 12, 2283. 10.1021/acsnano.7b07082. [DOI] [PMC free article] [PubMed] [Google Scholar]
- Yetisen A. K.; Montelongo Y.; da Cruz Vasconcellos F.; Martinez-Hurtado J.; Neupane S.; Butt H.; Qasim M. M.; Blyth J.; Burling K.; Carmody J. B.; et al. Reusable, Robust, and Accurate Laser-Generated Photonic Nanosensor. Nano Lett. 2014, 14, 3587–3593. 10.1021/nl5012504. [DOI] [PubMed] [Google Scholar]
- Tokarev I.; Minko S. Stimuli-Responsive Hydrogel Thin Films. Soft Matter 2009, 5, 511–524. 10.1039/B813827C. [DOI] [Google Scholar]
- Ben-Moshe M.; Alexeev V. L.; Asher S. A. Fast Responsive Crystalline Colloidal Array Photonic Crystal Glucose Sensors. Anal. Chem. 2006, 78, 5149–5157. 10.1021/ac060643i. [DOI] [PubMed] [Google Scholar]
Associated Data
This section collects any data citations, data availability statements, or supplementary materials included in this article.


