. 2018 Jul 31;7:e36468. doi: 10.7554/eLife.36468

Figure 7. Inhibition of Fgf signaling blocks morphogenesis of dermal condensate ex vivo.

(A) Confocal optical sections of paired E14.25 Fgf20+/- skins explants cultured for 12 hr with SU5402 (20 µM) or DMSO vehicle control. Samples were stained for β-Gal (red) and Sox2 (white). (B) Quantification of Sox2+ DC cell numbers in control and SU5402-treated samples relative to DMSO control (n = 14 DCs each from six skins). (C) Quantification of the distance of Sox2+ DC cells to their nearest neighbor in control and SU5402-treated samples (n = 14 DCs each from six skins). (D) Confocal optical sections of E14.25 paired skin explants either fixed at T0 or cultured 12 hr with SU5402 (20 µM). Samples were stained for β-gal (red) and Sox2 (white). (E, F) Quantification of Sox2+ DC cell numbers and distance to neighbor (n = 11 DCs from four skins). Significance was assessed with Student’s T-test. n.s., not significant; **, p≤0.01. Error bars represent SD. See also Figure 7—source data and Figure 7—figure supplement 1.

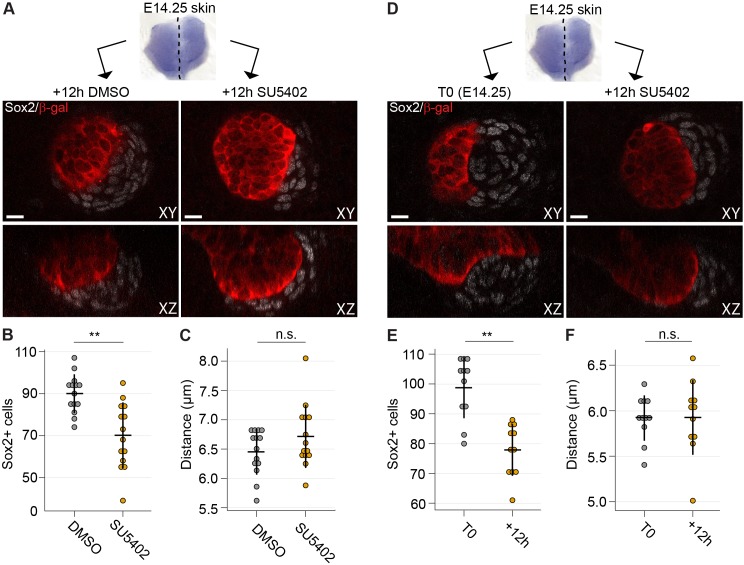
Figure 7—source data 1. Values used to quantify DC morphogenesis in the presence of Fgfr inhibitor.
Values used to quantify E14 + 12 hr culture with DMSO or SU5402 DC normalized cell numbers (Figure 7B). Values used to quantify E14 + 12 hr culture with DMSO or SU5402 distance of DC cells (Figure 7C). Values used to quantify DC cell number at E14 and after 12 hr culture with SU5402. (Figure 7E). Values used to quantify DC cell distance at E14 and after 12 hr culture with SU5402 (Figure 7F).
DOI: 10.7554/eLife.36468.035

Figure 7.

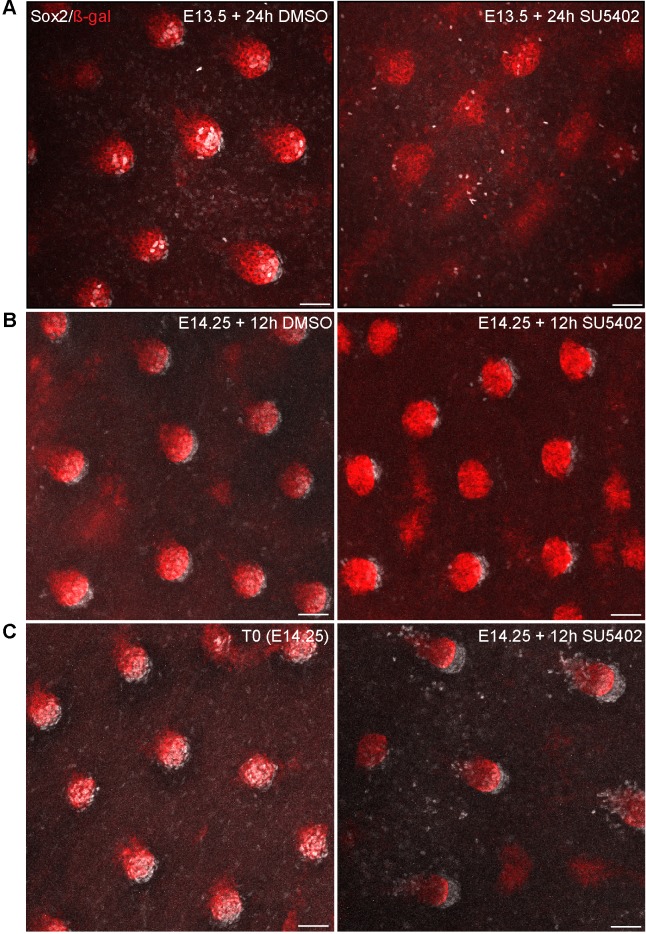
Figure 7—figure supplement 1. Inhibition of Fgf signaling at different developmental stages ex vivo impairs DC formation and maintenance.

Figure 7—figure supplement 1.

(A–C) Maximum intensity projections of confocal image stacks of Fgf20+/- skins explants labeled with antibodies against β-gal (red) and Sox2 (white). (A) E13.5 skin explants were halved and cultured for 24 hr in the presence of DMSO vehicle control (left) or 20 µM SU5402 (right) (n = 7 skins). In the DMSO-treated samples, dermal condensates are readily observed (Sox2+ cells), whereas SU5402-treated samples are devoid of Sox2+ cells and display altered epithelial Fgf20 expression. (B) E14.25 Fgf20+/- skins explants were divided into two halves: one was cultured in the presence of DMSO (vehicle control, left) for 12 hr and the other in the presence of 20 µM SU5402 (right) (n = 8 skins). (C) E14.25 Fgf20+/- skins explants were divided into two halves: one was fixed immediately (T0, left) while the other was cultured for 12 hr with 20 µM SU5402 (right) (n = 5 skins). Scale bar = 50 µm. See also Figure 7.
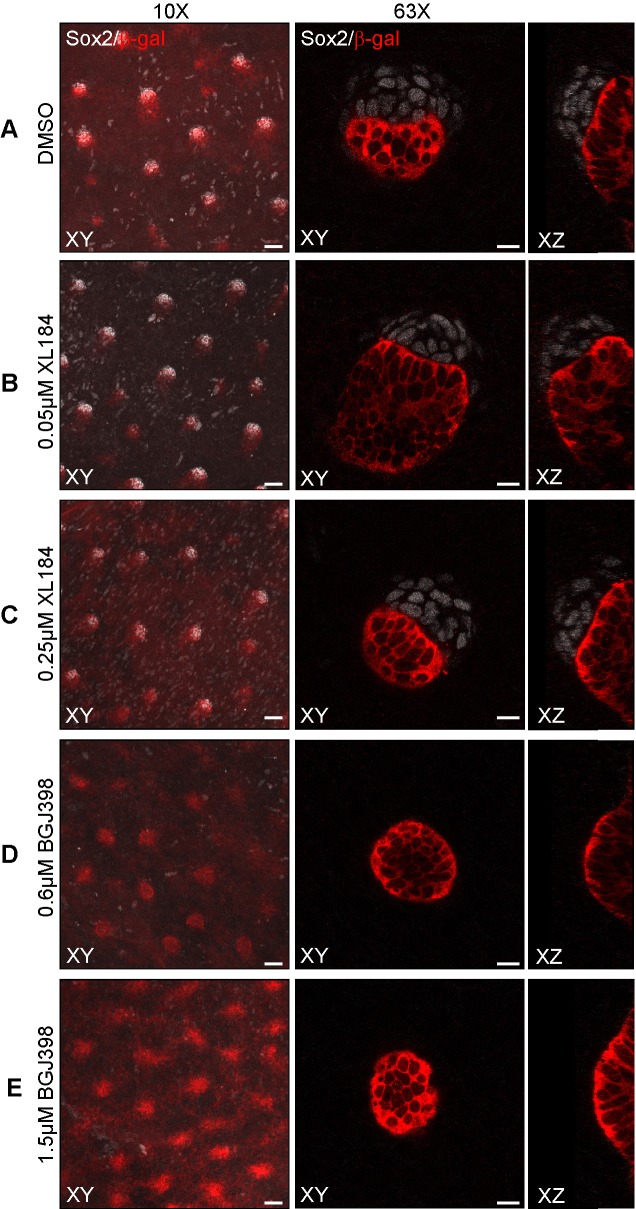
Figure 7—figure supplement 2. Inhibition of VEGFR signaling with XL184 and FGFR signaling with BGJ398 in skin explants.

Figure 7—figure supplement 2.

E13.5 Fgf20+/- skins was cultured for 24 hr in the presence of DMSO vehicle control (A) (n = 14 skins), 50 nM and 250 nM XL184 to inhibit VEGFR signaling (B,C) (n = 7 and 13 skins, respectively), as well as 0.6 µM and 1.5 µM BGJ398 (D,E) (n = 11 and 12 skins, respectively). First image column shows representative maximum intensity projections of 10x confocal stacks (scale bar = 50 µM) and the second and third columns show representative 63x confocal optical sections of single DCs as top and side views (scale bar = 10 µM). See also Figure 7—figure supplement 2—source data 1..
Figure 7—figure supplement 2—source data 1. Inhibitors used to test FGFR signaling in DC induction.
Table of reported IC50 values for SU5402, BGJ398, and XL154 for the FGFR1 and VEGFR2 receptors. Equivalent dose represents the concentration required to inhibit either FGFR1 or VEGFR2 to the same degree as SU5402.
DOI: 10.7554/eLife.36468.034