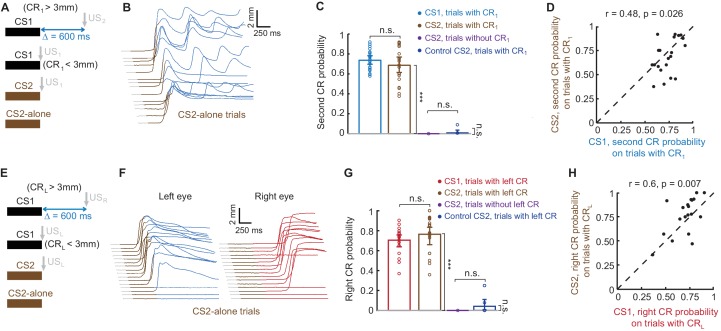
Figure 5. Sequence of CRs is present regardless of CS type that drives the first CR.
(A) Schematic representation of stimuli during all types of trials in the session. (B) Example session showing eyelid responses on CS2-alone trials of subject trained in ipsilateral sequence with CS1. Brown color indicates CS2 duration. (C) Second CR is present on either CS1 or CS2 trials only if first CR is present. Each dot represents average second CR probability over corresponding trial type during one session, bars show a global average across all CS2 test sessions. Error-bars indicate 95% confidence intervals (bootstrap with 2000 repetitions). (D) Second CR probability on trials with first CRs, elicited either by CS1 or CS2, co-varies between sessions. The data are the same as in blue and brown bars in panel (C). Each dot represents a single session, showing second CR probability on trials with first CRs elicited by either CS1 (X axis) or CS2 (Y axis). (E–H) Similar analysis for subjects trained in contralateral sequence protocol.

