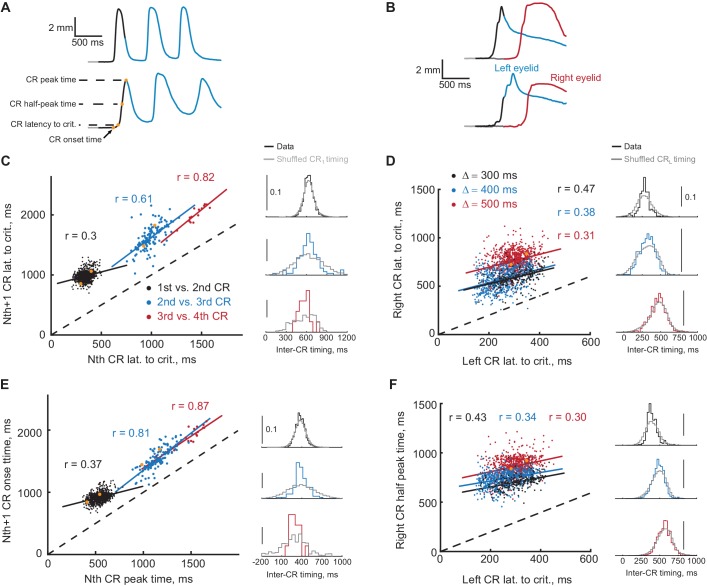
Figure 7. Timing of first and second CRs in sequence co-varies from trial-to-trial.
(A) Two example trials showing eyelid CRs from subjects trained in ipsilateral sequence. Orange dots indicate times of different CR timing measures, specified on the left. (B) Similarly, responses on two example trials from subjects trained in contralateral sequence. (C) Latency to criterion of following versus previous CR in ipsilateral sequence training. Each dot represents a single trial, dotted black line shows the diagonal. Colored lines show a linear regression fit for corresponding pairs of CRs as in the legend. Colored distributions on the right show distribution of time-intervals between timing measures (CR lat. to crit. versus CR lat. to crit. for C) of corresponding CRs pairs on different trials. Distributions in grey show the same data with timing of first CR shuffled across trials (2000 repetitions). (D) Similar plot for latency to criterion of CRs in contralateral sequence. Here colors indicate different gap intervals, as in the legend. Panels on the right show distributions of timing between left and right CRs data on the left. (E) Same for CR onset time versus peak time of the previous CR in ipsilateral sequence. (F) Same for the time to half peak amplitude of right CR versus latency to criterion of the left CR in contralateral sequence. For panels (C–F) dots corresponding to example trials from panels (A–B) are shown in orange.


