

Abstract
Background
Known coronary artery disease (CAD) risk scores (e.g., Framingham) estimate the CAD-related event risk rather than presence/absence of CAD. Artificial intelligence (AI) is rarely used in this context.
Aims
This study aims to evaluate the diagnostic power of AI (memetic pattern-based algorithm (MPA)) in CAD and to expand its applicability to a broader patient population.
Methods and results
Nine hundred eighty-seven patients of the Ludwigshafen Risk and Cardiovascular Health Study (LURIC) were divided into a training (n = 493) and a test population (n = 494). They were evaluated by the Basel MPA. The “training population” was further used to expand and optimize the Basel MPA, and after modifications, a final validation was carried out on the “test population.” The results were compared with the Framingham Risk Score (FRS) using receiver operating curves (ROC; area-under-the-curve (AUC)). Of the 987 LURIC patients, 71% were male, age 62 ± 11 years and 68% had documented CAD. AUC of Framingham and BASEL MPA to diagnose CAD in “LURIC training” were 0.69 and 0.80, respectively. AUC of the optimized MPA in the training and test cohort were 0.88 and 0.87, respectively. The positive predictive values (PPV) of the optimized MPA for exclusion of CAD in “training” and “test” were 98 and 95%, respectively. The PPV of MPA for identification of CAD was 93 and 94%, respectively.
Conclusions
The successful use of the MPA approach has been demonstrated in a broad-risk spectrum of patients undergoing CAD evaluation, as an element of predictive, preventive, personalized medicine, and may be used instead of further non-invasive diagnostic procedures.
Keywords: Coronary artery disease, Memetic pattern-based algorithm, Diagnosis, PPPM, Non-invasive evaluation, Risk scores, Artificial intelligence-based prediction and decision-making
Introduction
Risk scores, incorporating risk factors of coronary artery disease (CAD) are widely used for risk stratification in cardiology [1–4].
The Framingham Risk Score (FRS) [2] or the Prospective Cardiovascular Münster study (PROCAM) [3, 4] score provide risk stratification regarding the occurrence of cardiovascular events within a time period of up to 10 years.
Other risk scores have incorporated additional variables (e.g., high-sensitive troponin, C-reactive protein) to improve CAD risk prediction [5, 6].
However, little is known and available to predict the presence or absence of CAD in a particular individual, even though a patient-tailored approach in the context of predictive, preventive, personalized medicine (PPPM) should be the focus [7–10], especially using easily available patient data.
Using combined statistical methods and artificial intelligence strategies (memetic pattern-based algorithms (MPA)), it becomes feasible that CAD can be either diagnosed or excluded with an accuracy as high as 98% [11].
This is possible thanks to readily available clinical parameters and routine laboratory testing combined with latest artificial intelligence (AI) modeling. Risk scores currently used were developed mainly on the basis of logistic regression [12], Cox proportional hazards regression [13], and accelerated failure time analysis [1, 14, 15]. Today’s newer “intelligent statistical modeling processes” carry the potential to improve the prediction of presence or absence of CAD [16–19]. Such processes do not rely on a single statistical method but rather on combining a multitude of statistical learning methods and utilizing an evolutionary learning optimization process to develop an optimal combination and parameterization of these methods and to choose the patterns (“memetic profiles”) relevant for the diagnosis or exclusion of CAD.
In a high-risk patient population undergoing coronary angiography, it has been demonstrated that the MPA provided a high diagnostic accuracy for CAD (AUC = 0.824) [11].
Since it is unclear whether the MPA provides similar results in other patient populations (e.g., with lower risk of CAD or known CAD), the aims of our study were as follows:
To apply and validate the original Basel MPA model [11] on a different patient population (Ludwigshafen Risk and Cardiovascular Health Study (LURIC) training population) [20] and to compare the results with the results of the Basel MPA study [11];
To optimize the Basel MPA model using the LURIC training population with the goal of coping with differences in the distribution of the baseline variables used, caused by the method of how these factors were measured;
To test the modified and optimized model on the LURIC validation population for predicting the presence or absence of angiographically documented coronary artery stenosis;
To assess the optimized model’s accuracy in two independent low-risk population simulations.
Methods
Patient populations
The study complies with the Declaration of Helsinki, the research protocol has been approved by the locally appointed ethics committees, and informed consent has been obtained from the subjects.
BASEL MPA population [11]
Data of 245 patients were used to build the MPA, and data of 128 further patients were used for its validation. No patient had prior or acute CAD. All patients had been referred to the hospital for CAD evaluation and underwent coronary angiography.
Ludwigshafen Risk and Cardiovascular Health Study population [20]
Of the 987 patients, data of 493 patients (training population) were used to test the BASEL MPA in this LURIC cohort (without knowing the CAD status of the LURIC training population) and then to optimize the MPA. Data of 494 LURIC patients (test population) were used to test and validate the modified BASEL MPA.
Simulated patients.
The virtual low-risk sample of more than 30,000 patient records was generated by combining 20,000 virtual normal patients (normality defined on the basis of characteristics of low-risk healthy individuals in the BASEL MPA and LURIC studies and reconciled with expert information about the normal ranges of each input factor) with patients generated on the basis of the LURIC study sample in a proportion which delivers 23% CAD prevalence in the generated sample. The generated sample was used to further test the reliability of the MPA in a low-risk population.
Procedures
Patient evaluation
All BASEL and LURIC patients underwent a standardized evaluation including patient history, physical examination, 12-lead electrocardiogram (ECG), blood tests, and coronary angiography. Patient history focused on patient symptoms (chest pain, shortness of breath, and their character and severity if present), CAD risk factors, and medication. Patient height, weight, and blood pressure were determined. Laboratory variables included hematology (white blood cells, MCV, MCHC, INR), electrolytes (chloride, potassium, sodium, phosphate), enzymes (pancreatic amylase, alkaline phosphatase, creatinine kinase, GGT, ALAT, ASAT), metabolites (bilirubin, urea, uric acid, creatinine), lipids (cholesterol, HDL, LDL), as well as glucose, proteins, high sensitive troponin T, and coagulation variables (INR).
Importantly, no stress test data (e.g., no ergometry, treadmill, or cardiac imaging data) was used.
Based on these data, the risk scores were calculated. The outcome measure for this evaluation was presence or absence of CAD (stenosis) defined by standard diagnostic coronary angiography. Coronary angiography was performed by standard Judkins technique.
Presence of at least one coronary artery stenosis > 50% by visual interpretation was considered a significant stenosis. Coronary angiographies were analyzed independently, and invasive cardiologists were blinded to MPA results.
Application of the MPA
Since in the BASEL MPA patients had no prior CAD, the algorithm was applied to the LURIC training population (n = 493), in which there were patients with prior CAD (the CAD status of the LURIC training population, however, was not provided to the modelers at this first step). In the second step, data of the LURIC and BASEL populations were used to focus the algorithm on different patient populations to be tested.
In the third step, the algorithm was applied to the “test”-LURIC population (n = 494).
And in the last step, the algorithm was applied to the virtually created low-risk-patient sample (n = 30,303) and the validity of results was confirmed analytically by using a modified Monte-Carlo simulation [21].
Statistical methods
For standard statistical analyses, continuous variables are described as the mean (± standard deviation) or median as appropriate, and for binary categorical variables, the count and the percentage value is shown.
The chi-square test was used to compare proportions for dichotomous variables. The Student’s t test was used to compare means ± standard deviation for continuous variables. The Wilcoxon-Mann-Whitney test was used for the troponin and ALAT, since this test was more suitable for the variables’ distribution.
The modeling and optimization method description
The MPA modeling process is a multilayer, multiple method process including the following methods from the field of pattern recognition and machine learning [22–32]:
Ensemble tree methods based on classification and regression tree
Logistic regression and ensemble logistic regression methods
Voting Algorithms for ensembles of classifiers
Automated search for non-linear functional combinations of attributes relevant for the CAD question
Univariate scaling, categorization and risk mapping methods
Self-organizing maps for clustering and classification
Evolutionary optimization method
The approach was implemented as an autonomous modeling process and was able to detect complex patterns and inherent relationships in the data. An evolutionary optimization process iteratively combined variables of the input data, their univariate or multivariate functional transformations, and weak classifiers, which were built with methods like decision trees, logistic regressions, clustering, categorization, or risk mapping. Thousands of unique models were evaluated in the course of optimization. Evaluated models were built from multiple layers where the output of one method or transformation could be the input for another. The capability to combine various pattern detection methods leads to a higher pattern detection quality and ability to find complex, non-linear dependencies in the data.
The unique ability of this approach is to fix the desired sensitivity/specificity prior to modeling and therefore to steer the modeling process in the desired direction allowing to build models with very low false-positive or false-negative rates.
Simulated low-risk patients
The results of the BASEL/LURIC model validation were projected to a low-risk patient population.
The primary difference between the high-risk and the generated low-risk-patient population was that a much larger number of patients without CAD was included in the sample. The difference between the samples was on the healthy patients’ side while the CAD-positive patients’ scoring results were expected to be the same. This led to changes in expected values of the true-positive (TP) rate of the H+ (CAD excluded) diagnostic decision (the percent of healthy individuals the H+ model will identify as healthy) and the false-positive (FP) rate of the CAD+ (CAD is present) diagnostic decision (the percent of healthy patients the CAD+ model will identify as sick). Other parameters as the FP rate of the H+ diagnostic decision (the % of sick patients the H+ model will identify as healthy) and the TP rate of the CAD+ diagnostic decision (the % of sick patients the CAD+ model will identify as sick) are left unchanged from the prospective validation results performed in the second step.
For the analysis of the low-risk population results, in the first step, the score distribution of MPA for LURIC on healthy individuals’ sample was modeled with the logit function of the sum of two normal distributions, and additionally, the simulation of distribution parameters on the basis of characteristics known about the low-risk patient population. p value for K-S test of uniformity distributions was 0.996 when comparing the observed and modeled distributions. By assuming CAD prevalence in the general population to be 23%, the share of high-risk patients sent to a cardiologist to be 20%, and the score provided by the MPA for healthy patients decreasing proportionally to the prevalence of CAD in the low-risk population sample, we were able to define a number of constraints and perform the simulation which has constructed more than 3,000,000 of possible distributions and estimated the worst case of model error for the given cut-off point. (modified Monte-Carlo simulation).
In addition to the analytic simulation, a simulation based on generating random multivariate patient data was performed. The patient sample, based on randomly generated healthy individuals combined with actual LURIC data was used for analyzing the score distribution and estimating the number of true positives and false positives in each cut-off point.
Results
The following variables were most predictive in the population used to develop the CAD-MPA (BASEL MPA): age, sex, weight, height, chest pain, and shortness of breath. CAD risk factors include diabetes, smoking, systolic blood pressure, and diastolic blood pressure. Laboratory values include glucose, total cholesterol, LDL cholesterol, HDL cholesterol, ASAT, ALAT, alkaline phosphatase, bilirubin, GGT, globulins, sodium, chloride, phosphate, creatine kinase, troponin, international normalized ratio (INR), urea, creatinine, white blood cells, and mean corpuscular hemoglobin (MCH). ECG parameters are pathologic Q-wave, repolarization anomalies, and current medications used: intake of betablocker, oral anticoagulation, a cholesterol-lowering drug, or of a platelet inhibitor.
In the optimized MPA, a few variables could even be eliminated from the model without a loss of diagnostic accuracy (ASAT, GGT, sodium, chloride, phosphate, creatine kinase, international normalized ratio (INR)).
Table 1 summarizes and compares the BASEL and LURIC baseline patient data. The BASEL population was older than the LURIC population. As per definition, the LURIC patients more frequently had known prior CAD (prior myocardial infarction or another CAD event) and a higher cardiovascular risk profile than the BASEL population (in the BASEL population patients with known or acute CAD were excluded from the study). With respect to the laboratory test results, the significantly higher troponin level in the LURIC population has to be mentioned.
Table 1.
Comparison of baseline characteristics between the BASEL and the entire LURIC populations
| Basel (n = 378) | LURIC (n = 987) | p value | |
|---|---|---|---|
| Female sex | 129 (34%) | 291 (29%) | 0.11 |
| Age (years) | 66 ± 10 | 62 ± 4 | < 0.001 |
| Patient with prior MI event | 0 (0%) | 283 (29) | < 0.001 |
| Patients with prior CAD event | 0 (0%) | 445 (45) | < 0.001 |
| Height (cm) | 170 ± 9 | 170 ± 9 | 0.426 |
| BMI (kg/m2) | 27.8 ± 4.9 | 27.5 ± 4.0 | 0.249 |
| Systolic blood pressure (mmHg) | 142 ± 22 | 141 ± 24 | 0.543 |
| Diastolic blood pressure (mmHg) | 82 ± 12 | 81 ± 12 | 0.234 |
| Typical angina | 197 (52%) | 358 (36%) | < 0.001 |
| Atypical angina | 3 (1%) | 90 (9%) | < 0.001 |
| Asymptomatic | 104 (28%) | 314 (32%) | 0.14 |
| Shortness of breath | 177 (47%) | 374 (38%) | 0.003 |
| Non-smoker | 175 (46%) | 349 (35%) | < 0.001 |
| Prior smoker | 151 (40%) | 424 (43%) | 0.344 |
| Current smoker | 51 (13%) | 214 (22%) | 0.001 |
| Diabetes | 92 (24%) | 399 (40%) | < 0.001 |
| Statin | 206 (55%) | 461 (47%) | 0.012 |
| Oral anticoagulant | 43 (11%) | 69 (7%) | 0.011 |
| Platelet inhibitors | 308 (81%) | 706 (72%) | < 0.001 |
| ACE or ATII inhibitors | 201 (53%) | 540 (55%) | 0.653 |
| Calcium antagonist | 81 (21%) | 155 (16%) | 0.015 |
| Betablockers | 246 (65%) | 626 (63%) | 0.612 |
| Diuretics | 134 (35%) | 288 (29%) | 0.029 |
| Nitrates | 44 (12%) | 317 (32%) | < 0.001 |
| Troponin (pg/ml; median (interquartiles)) | 4 (0–10) | 11 (5–26) | < 0.001 |
| Pancreas amylase (μkat/l) | 0.48 ± 0.28 | 0.33 ± 0.15 | < 0.001 |
| Alkaline phosphatase (μkat/l) | 1.12 ± 0.32 | 1.12 ± 0.42 | 0.926 |
| ALAT (μkat/l median (interquartiles)) | 0.38 (0.30–0.55) | 0.37 (0.28–0.59) | 0.604 |
| Bilirubin (μmol/l) | 10 ± 5 | 11 ± 7 | < 0.001 |
| Urea (mmol/l) | 6.9 ± 2.9 | 6.6 ± 2.7 | 0.113 |
| Uric acid (μmol/l) | 350 ± 98 | 303 ± 106 | < 0.001 |
| Cholesterol (total) (mmol/l) | 4.7 ± 1.2 | 5.0 ± 1.0 | < 0.001 |
| LDL (mmol/l) | 2.6 ± 1.0 | 2.7 ± 0.8 | 0.109 |
| HDL (mmol/l) | 1.3 ± 0.4 | 1.3 ± 0.4 | 0.164 |
| Protein (total) (g/l) | 73 ± 6 | 69 ± 5 | < 0.001 |
| Albumin (g/l) | 39 ± 3 | 44 ± 6 | < 0.001 |
| Glucose (mmol/l) | 7.0 ± 3.3 | 6.3 ± 2.0 | < 0.001 |
| White blood cells (× 1012/l) | 7.29 ± 1.87 | 7.17 ± 2.08 | 0.306 |
| MCHC (g/l) | 350 ± 11 | 341 ± 11 | < 0.001 |
| ECG, evidence of q-waves | 36 (9.52%) | 186 (18.84%) | < 0.001 |
The Chi-square test was used to compare proportions for dichotomous variables. The Student’s t test was used to compare means ± standard deviation for continuous variables. The Wilcoxon-Mann-Whitney test was used for the troponin and ALAT, since this test was more suitable for the variables’ distribution. A p value < 0.05 means that the Basel and LURIC population are significantly different with respect to the particular baseline variable
Table 2 depicts the baseline data comparison of LURIC training and test patients. These two populations were almost identical, except that there were more male patients in the training than in the test population.
Table 2.
Baseline characteristics of the LURIC patients (comparison of the training and validation population)
| Training LURIC (n = 493) | Test LURIC (n = 494) | p value | |
|---|---|---|---|
| Female sex | 130 (26%) | 161 (33%) | 0.038 |
| Age (years) | 62 ± 11 | 63 ± 11 | 0.211 |
| Patients with prior MI | 131 (27%) | 152 (31%) | 0.165 |
| Patients with prior CAD event | 211 (43%) | 234 (47%) | 0.168 |
| Height (cm) | 170 ± 8 | 170 ± 9 | 0.103 |
| BMI (kg/m2) | 27 ± 4 | 28 ± 4 | 0.495 |
| Systolic blood pressure (mmHg) | 140 ± 25 | 142 ± 24 | 0.066 |
| Diastolic blood pressure (mmHg) | 81 ± 12 | 82 ± 11 | 0.458 |
| Typical angina | 166 (34%) | 192 (39%) | 0.103 |
| Atypical angina | 43 (9%) | 47 (10%) | 0.748 |
| Asymptomatic | 173 (35%) | 141 (29%) | 0.032 |
| Shortness of breath | 182 (37%) | 192 (39%) | 0.572 |
| Non-smoker | 177 (36%) | 172 (35%) | 0.772 |
| Prior smoker | 211 (43%) | 213 (43%) | 0.971 |
| Current smoker | 105 (21%) | 109 (22%) | 0.83 |
| Diabetes | 199 (40%) | 200 (40%) | 1 |
| Statin | 227 (46%) | 234 (47%) | 0.724 |
| Oral anticoagulant | 36 (7%) | 33 (7%) | 0.796 |
| Platelet inhibitors | 340 (70%) | 366 (74%) | 0.087 |
| ACE or ATII inhibitors | 265 (54%) | 275 (56%) | 0.589 |
| Calcium antagonist | 78 (16%) | 77 (16%) | 0.989 |
| Betablockers | 303 (61%) | 323 (65%) | 0.225 |
| Diuretics | 146 (30%) | 142 (29%) | 0.818 |
| Nitrates | 163 (33%) | 154 (31%) | 0.571 |
| Troponin (pg/ml; median (interquartiles)) | 12 (5–27) | 10 (6–25) | 0.426 |
| Pancreas amylase (μkat/l) | 0.33 ± 0.17 | 0.33 ± 0.13 | 0.331 |
| Alkaline phosphatase (μkat/l) | 1.14 ± 0.47 | 1.12 ± 0.37 | 0.758 |
| ALAT (μkat/l median (interquartiles)) | 0.40 (0.28–0.59) | 0.37 (0.25–0.56) | 0.076 |
| Bilirubin (μmol/l) | 11 ± 6 | 11 ± 7.5 | 0.462 |
| Urea (mmol/l) | 6.6 ± 2.4 | 6.6 ± 2.9 | 0.988 |
| Uric acid (μmol/l) | 301 ± 102 | 304 ± 108 | 0.652 |
| Cholesterol (total) (mmol/l) | 4.8 ± 1.1 | 5.1 ± 1.0 | 0.047 |
| LDL (mmol/l) | 2.7 ± 0.8 | 2.7 ± 0.8 | 0.108 |
| HDL (mmol/l) | 1.3 ± 0.4 | 1.3 ± 0.4 | 0.870 |
| Protein (total) (g/l) | 68 ± 5 | 69 ± 6 | 0.414 |
| Albumin (g/l) | 44 ± 6 | 44 ± 6 | 0.409 |
| Glucose (mmol/l) | 6.1 ± 1.8 | 6.4 ± 2.1 | 0.026 |
| White blood cells (× 1012/l) | 7.22 ± 2.18 | 7.13 ± 1.98 | 0.487 |
| MCHC (g/l) | 341 ± 12 | 341 ± 11 | 0.735 |
| ECG, evidence of q-waves | 94 (19%) | 92 (19%) | 0.923 |
The Chi-square test was used to compare proportions for dichotomous variables. The Student’s t test was used to compare means ± standard deviation for continuous variables. The Wilcoxon-Mann-Whitney test was used for the troponin and ALAT, since this test was more suitable for the variables’ distribution. A p value < 0.05 means that the LURIC training and test population are significantly different with respect to the particular baseline variable
Of the 987 LURIC patients, 71% were male, and the mean age was 62 ± 11 years. Coronary angiography revealed significant coronary stenosis in 68% of the patients.
The results of the comparison between LURIC and the simulated low-risk patients is depicted in Table 3.
Table 3.
Baseline characteristics of the randomly generated low-risk patients compared with the LURIC population
| Simulated low-risk population (n = 30,303) | LURIC (n = 987) | p value | |
|---|---|---|---|
| Female sex | 13,052 (43%) | 291 (29%) | < 0.001 |
| Age (years) | 57 ± 12 | 62 ± 11 | < 0.001 |
| Patients with prior MI | 2924 (10%) | 283 (29%) | < 0.001 |
| Patients with prior CAD event | 4626 (15%) | 445 (45%) | < 0.001 |
| Height (cm) | 172 ± 9 | 170 ± 9 | < 0.001 |
| Systolic blood pressure (mmHg) | 134 ± 20 | 141 ± 24 | < 0.001 |
| Diastolic blood pressure (mmHg) | 77 ± 8 | 81 ± 12 | < 0.001 |
| Typical angina | 6534 (22%) | 358 (36%) | < 0.001 |
| Atypical angina | 2927 (10%) | 90 (9%) | 0.609 |
| Asymptomatic | 11,282 (37%) | 314 (32%) | 0.001 |
| Shortness of breath | 6055 (20%) | 374 (38%) | < 0.001 |
| Non-smoker | 14,342 (47%) | 349 (35%) | < 0.001 |
| Prior smoker | 8668 (30%) | 424 (43%) | < 0.001 |
| Current smoker | 7293 (24%) | 214 (22%) | 0.091 |
| Diabetes | 6329 (21%) | 399 (40%) | < 0.001 |
| Statin | 4804 (16%) | 461 (47%) | < 0.001 |
| Oral anticoagulant | 905 (3%) | 69 (7%) | < 0.001 |
| Platelet inhibitors | 7366 (24%) | 706 (72%) | < 0.001 |
| ACE_od_ATII inhibitors | 5718 (19%) | 540 (55%) | < 0.001 |
| Calcium antagonist | 1648 (5%) | 155 (16%) | < 0.001 |
| Betablockers | 6468 (20%) | 626 (63%) | < 0.001 |
| Diuretics | 3001 (10%) | 288 (29%) | < 0.001 |
| Nitrates | 3325 (11%) | 317 (32%) | < 0.001 |
| Troponin (pg/ml; median (interquartiles)) | 1 (0–5) | 11 (5–26) | < 0.001 |
| Pancreas amylase (μkat/l) | 0.33 ± 0.13 | 0.33 ± 0.15 | 0.950 |
| Alkaline phosphatase (μkat/l) | 1.12 ± 0.32 | 1.12 ± 0.42 | 0.936 |
| ALAT (μkat/l median (interquartiles)) | 0.37 (0.30–0.45) | 0.37 (0.28–0.59) | < 0.001 |
| Bilirubin (μmol/l) | 9 ± 4 | 11 ± 7 | < 0.001 |
| Urea (mmol/l) | 5.7 ± 1.8 | 6.6 ± 2.7 | < 0.001 |
| Uric acid (μmol/l) | 289 ± 74 | 303 ± 106 | < 0.001 |
| Cholesterol (total) (mmol/l) | 5.0 ± 1.0 | 5.0 ± 1.0 | 0.320 |
| LDL (mmol/l) | 2.9 ± 0.9 | 2.7 ± 0.8 | < 0.001 |
| HDL (mmol/l) | 1.4 ± 0.3 | 1.3 ± 0.4 | < 0.001 |
| Protein (total) (g/l) | 73 ± 5 | 69 ± 5 | < 0.001 |
| Albumin (g/l) | 43 ± 4 | 44 ± 6 | < 0.001 |
| Glucose (mmol/l) | 5.6 ± 1.4 | 6.3 ± 2.0 | < 0.001 |
| White blood cells (× 1012/l) | 6.8 ± 1.45 | 7.17 ± 2.08 | < 0.001 |
| MCHC (g/l) | 344 ± 8 | 341 ± 11 | < 0.001 |
| ECG, evidence of q-waves | 2062 (7%) | 186 (19%) | < 0.001 |
| Prevalence of coronary artery disease (coronary angiography results) | 6970 (23%) | 668 (68%) | < 0.001 |
As the compared sample sizes are very different, the one-sample tests were used for calculating p values, taking the mean and the median of the simulated low-risk population as a given value. The one sample Chi-square test was used to compare proportions for dichotomous variables. The one-sample Student’s t test was used to compare means for continuous variables. The one-sample Wilcoxon-Mann-Whitney test was used for the troponin and ASAT variable, being more suitable for the variable’s distribution. A p value < 0.05 means that the simulated low-risk population and LURIC population are significantly different with respect to the particular baseline variable
It is evident that patients created by simulation had a much lower-risk profile than the LURIC population. The simulated low-risk population was younger, had less severe chest pain, less medication, and was closer to a “normal” population.
Predictive value of the MPA
In Fig. 1a–c, the predictive values of the algorithms to diagnose coronary artery disease are summarized for the two LURIC populations and the simulated low-risk patients. By combining the data of Basel and LURIC and modifying the algorithm, the predictive results improved. (Increase of AUC from 0.8 to 0.88 as shown by the receiver operating curves, p value < 0.001). For the simulated low-risk patients, the predictive value was excellent with an AUC > 0.9. Table 4 provides the results in further detail.
Fig. 1.
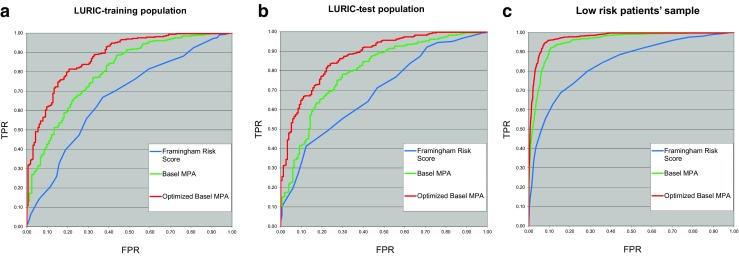
a–c Comparison of the higher diagnostic accuracy of an MPA-based approach with the accuracy reached by the FRS. In addition, the BASEL MPA could be optimized by incorporating LURIC data, resulting in an even higher predictive value. a Comparison of three models in the LURIC-training population: the blue line is the ROC of the Framingham Risk Score (AUC = 0.666), the green line is the ROC of the Basel MPA (AUC = 0.8), and the red line is the ROC of the optimized Basel MPA (AUC = 0.879). b Comparison of three models in the LURIC test population: the blue line is the ROC of the Framingham Risk Score (AUC = 0.690), the green line is the ROC of the original Basel MPA (AUC = 0.798), and the red line is the ROC of the optimized Basel MPA (AUC = 0.874). c Comparison of three models in the low-risk patients’ sample: the blue line is the ROC of Framingham (AUC = 0.838), the green line is the ROC of the original Basel model (AUC = 0.952), and the red line is the ROC of the optimized MPA model (AUC = 0.972)
Table 4.
Diagnostic value of the BASEL MPA, optimized BASEL MPA on LURIC data, and compared with the Framingham Risk Score (FRS)
| Basel MPA (Basel CAD study) | Basel MPA applied to LURIC sample | Optimized Basel MPA results on LURIC sample | FRS 2 year-risk [2] | ||
|---|---|---|---|---|---|
| Patient population | Test data Basel | LURIC training | LURIC training | LURIC test | LURIC test |
| Number of patients | 128 | 493 | 493 | 494 | 494 |
| CAD+ patients | 88 | 328 | 328 | 340 | 340 |
| H+ patients | 40 | 165 | 165 | 154 | 154 |
| Results | |||||
| CAD+ identifications | 51 | 137 | 204 | 219 | 159 |
| H+ identifications | 5 | 20 | 46 | 43 | 56 |
| Undetermined records counta | 72 | 336 | 243 | 232 | 279 |
| CAD+ true positivesb | 46 | 123 | 189 | 206 | 140 |
| CAD+ false positivesc | 5 | 14 | 15 | 13 | 19 |
| H+ true positivesd | 5 | 18 | 45 | 41 | 37 |
| H+ false positivese | 0 | 2 | 1 | 2 | 19 |
| CAD+ sensitivityf | 52.3% | 37.5% | 57.6% | 60.6% | 41.2% |
| CAD+ FP ratiog | 12.5% | 8.5% | 9.1% | 8.4% | 12.3% |
| CAD+ specificity | 87.5% | 91.5% | 90.9% | 91.6% | 87.7% |
| H+ sensitivityh | 12.5% | 10.9% | 27.3% | 26.6% | 24% |
| H+ FP ratioi | 0% | 0.6% | 0.3% | 0.6% | 5.6% |
| H+ specificity | 100% | 99.3% | 99.7% | 99.4% | 94.4% |
| PPV CAD+j | 90.2% | 89.8% | 92.7% | 94.1% | 88.1% |
| PPV H+k | 100% | 90% | 97.8% | 95.4% | 66.1% |
| LR CAD+l | 4.2 | 4.4 | 6.3 | 7.2 | 3.3 |
| LR H+m | > 100 | 17.9 | 89.5 | 45.3 | 4.3 |
| AUC ± 95% CI | 0.824 ± 0.076 | 0.8 ± 0.04 | 0.88 ± 0.03 | 0.87 ± 0.03 | 0.69 ± 0.05 |
Abbreviations: CAD, coronary artery disease; CAD+, patients with CAD; H+, healthy subjects; FP, false positive; PPV, positive predictive value; LR, likelihood ratio
aNeither CAD+ nor H+ models produce definitive identification—only the risk score is returned for these records. In these patients, “conventional” strategies would have to be applied (e.g., cardiac imaging or stress testing)
bFor example, CAD+ patients identified as CAD+
cFor example, H+ patients identified as CAD+
dFor example, H+ patients identified as H+
eFor example, CAD+ patients identified as H+
fCAD+ TP ratio
g1-Specificity
hH+ TP ratio
i1-Specificity
jPercent of real CAD+ patients among those marked by the model as CAD+
kPercent of real H+ patients among those marked by the model as CAD+
lCharacterizes the quality of the binary classification, 1-random model, the higher the better; LR is the TP ratio/FP ratio
mCharacterizes the quality of the binary classification, 1-random model, the higher the better; LR is the TP ratio/FP ratio
Importantly, the risk score of the model discriminates two diagnostic decisions (H+: CAD is excluded and CAD+: CAD is present). Each of these decisions was evaluated as an independent diagnostic test, and in every validation, all the accuracy indicators (like sensitivity, specificity, PPV, NPV) are shown for these two decisions.
By analyzing possible cut-off values and the corresponding sensitivities and specificities, low- and high-risk classifications could be defined for patients, reflecting a broad patient-risk spectrum from screening to symptomatic level, from outpatient to inpatient level. Five risk classes were built taking into account these low- and high-risk populations. In the low-risk patient population, the prevalence of CAD was 0.2, 2.7, 31.5, 79, and 93.4% for the very low-, low-, medium-, high-, and very high-risk groups, respectively. The percentage of patients in these risk groups was 47.6, 16.8, 16.5, 4.6, and 14.6% for the very low-, low-, medium-, high-, and very high-risk groups, respectively.
In the high-risk patient population, the prevalence of CAD was 3.4, 22.4, 53.2, 79.7, and 93.4% for the very low-, low-, medium-, high-, and very high-risk group, respectively. The percentage of patients in these risk groups was 9, 5.9, 28.8, 13.5, and 42.9% for the very low-, low-, medium-, high-, and very high-risk groups, respectively.
For the low-risk population, the cut-off point selection differed from the high-risk population. The reason is that in the low-risk population, the diagnostic test should select patients with elevated CAD risk with very high sensitivity, even at the cost of having lower specificity, so that these patients could be further evaluated and are not missed in the diagnostic process.
On the basis of these results, this approach could be used as a very useful tool to evaluate pretest probability of CAD and to decide how to further proceed in the diagnostic and therapeutic process. A suggested decision-making process is depicted in Fig. 2.
Fig. 2.

A patient-tailored approach as an element of PPPM: example on how the MPA can be used in daily practice for patient care and decision making. The patient needs CAD evaluation. The doctor takes the patient history and summarizes patient baseline data, laboratory variables, and resting ECG findings. These findings are evaluated by the artificial intelligence approach (memetic profile-based algorithm). The doctor will get the results within one working day and can discuss the results with his patients. If the patient is “very low risk,” no further evaluation would be needed; in patients with intermediate risk (low, medium, and high risk), patients may undergo conventional non-invasive testing, and “very high-risk” patients should be referred for invasive coronary angiography (based on risk thresholds in the guidelines [33]). In summary, this approach could be used as a very useful tool to evaluate pretest probability of CAD and to decide how to further proceed in the diagnostic and therapeutic process. At this point in time, (**) depending on the patient’s baseline risk, 9–48, 37–48, and 15–43% of the evaluated patients would be in the very low-, intermediate-, and high-risk groups, respectively. Up to 52–63% (9 + 43%/48 + 15) of patients would not need any further evaluation or could be directly referred to coronary angiography after using the MPA approach. AI, artificial intelligence; MPA, memetic profile-based algorithm; CAD prev, CAD prevalence in the particular risk group
If an individual patient has been defined as “very low risk of having a coronary artery stenosis,” the prevalence of CAD was very low, between 0.22 and 3.4%, and no further evaluation regarding CAD would be necessary.
If an individual patient has been defined to be “very high risk,” the prevalence of CAD was 93.4%. A patient in this category may be referred directly to invasive coronary angiography.
Discussion
Artificial intelligence algorithms provide the possibility for our patients to accurately diagnose or exclude CAD (stenosis) based on readily available clinical and laboratory variables. A memetic pattern-based algorithm (MPA) was first developed enrolling a patient population without prior CAD in Basel. The MPA was optimized with an evolutionary learning process which was then validated in the Basel CAD study [11]. The Basel MPA has been further expanded, optimized, and validated in the current study by incorporating data from the LURIC study.
The refined MPA proved to better discriminate between patients with versus patients without angiographically documented CAD than the FRS. The diagnostic accuracy of the refined Basel algorithm provided even better results after incorporation of the LURIC data, resulting in comparable or even better predictive results than those provided by other non-invasive diagnostic tests with respect to CAD diagnosis (Table 5).
Table 5.
Comparison of the MPA model results, the Framingham risk score, and widely used non-invasive diagnostic procedures (adapted from [33]), which indicates that the MPA model provides better prediction than the FRS and may be compared as for sensitivity and specificity, to the coronary CT angiography
| Method | Sensitivity (%) | Specificity (%) |
|---|---|---|
| MPA model applied to low-risk population for screening purposes | 98 | 83 |
| MPA model applied to high-risk population | 75 | 83 |
| Framingham risk score | 71 | 63 |
| Stress ECG | 45–50 | 85–90 |
| Stress-echocardiography | 80–85 | 80–88 |
| Myocardial perfusion scintigraphy (MPS) | 73–92 | 63–86 |
| Stress magnetic resonance (CMR) | 67–94 | 61–91 |
| PET | 81–97 | 74–91 |
| Coronary CT angiography | 95–99 | 74–83 |
The gold standard to diagnose or exclude CAD still remains invasive coronary angiography. A large number of non-invasive tests including stress ECG, stress echocardiography, myocardial perfusion scintigraphy, positron emission tomography (PET), as well as computed tomography and magnetic resonance imaging-based techniques are available to evaluate individual patients with respect to the presence or absence of CAD.
Understanding the multifactorial nature of cardiovascular disease and the interrelation of risk factors as reflected by recent CAD scores and new statistical methods, as used in the MPA, should lead to accurate diagnoses and avoiding unnecessary and expensive invasive and non-invasive procedures, particularly in patients at low CAD probability. The model developed in the BASEL CAD study [11] and expanded and optimized in the current study was designed specifically for this task on the basis of the unique characteristics of the MPA modeling processes and artificial intelligence. It demonstrates how artificial intelligence can be incorporated in the CAD evaluation process. The evaluation of readily available patient data by the MPA results in a patient-tailored approach providing an accurate result for the individual patient. Based on this result that delivers the patient’s pretest probability of CAD, further individual patient evaluation and therapy can be planned. The MPA therefore could be broadly used in daily clinical practice (e.g., by family doctors, general practitioners, and cardiologists; in the out- and in-patient setting) and decision making as an accurate tool of predictive, preventive, personalized medicine.
There are several advantages of the MPA modeling process [18, 19]: the process is able to find and describe small multivariate patterns in the data and to combine them together into a high-quality predictive model. The process is highly automated [30, 31]. A directed search for the best possible methods and attributes combined is performed automatically by the system [32]. As a result, a much larger number of possibilities and approaches are explored by an automatic system than by what is possible in a manual modeling process [28] .
The modeling process was designed for working with data of large dimensionality, based on a multi-level modeling architecture. Feature selection and dimensionality reduction tasks are performed automatically on the basis of evolutionary learning [26]. The process allows optimizing the models specifically for making low alpha and low beta error classification decisions. The criteria of optimization were based on the risk preference and error constraints chosen by a modeler in order to build models with the lowest possible number of false positives, when modeling “diagnosis of CAD,” or to build models with the lowest possible number of false negatives when generating models for “exclusion of CAD.”
Of note, other risk scores as the Framingham risk score focus on risk prediction; whereas, our MPA focuses on the diagnosis of CAD. Since, the individual patient is not only interested to know the probability of suffering from a cardiovascular event in the future but also to know whether there is evidence that he or she suffers of relevant CAD or not. In a patient with chest pain, it is crucial to confirm or exclude the presence of hemodynamically relevant coronary disease (and possibly treat it) and not only to evaluate the risk for the occurrence of a cardiovascular event, sometime in the future.
The current study has confirmed that the BASEL CAD algorithm provides the expected level of diagnostic accuracy in varying patient populations (in the current study the LURIC population).
The algorithm could also be optimized by including patients with other baseline characteristics (lower-risk patients and patients with known CAD).
Therefore, it seems reasonable to apply the algorithm to high- and low-risk patient populations.
The current study provides a robust estimate what the user can expect by using the expanded and optimized BASEL MPA in “daily practice”—in a screening process and in a patient with expected CAD:
Patient populations classified as “very low risk” of having CAD would have a prevalence of CAD up to only 3.4%.
Based on these risk classifications, a decision-making process might be defined (Fig. 2). The evaluation process using the MPA, as depicted in Fig. 2, could lead to a completely new, and very accurate assessment of the pretest probability of CAD.
Importantly, the thresholds of accepted false-positive and false-negative rates can be chosen in the MPA models, resulting in changes with respect to the expected accuracy.
There are several possibilities to compare the accuracy of a diagnostic test as done in the present study, either based on a “population” or an “individual” level. It is important to take into account that since “diagnosis” and “exclusion” of CAD are two different questions of binary classification, the calculation and the comparison of statistical quality indicators of the binary classification should be performed separately for both classifications.
The results of the current study demonstrate that evaluation by the MPA provides better results when compared with the FRS with respect to AUC values (AUC = 0.87 vs 0.69, p value < 0.001). The most striking point is the high diagnostic certainty of ruling out CAD by MPA. If a patient is evaluated by the MPA and found to have “no CAD,” then this result is accurate in 95% of the cases even in a high-risk (e.g., hospital) population with CAD prevalence > 60%, and in a low-risk population, this figure is estimated to be > 99%.
The comparison of the MPA results in the present study to the reported results of performances of logistic regression, classification and regression tree, and neural networks for predicting CAD by Kurt et al. showed that AUC values of the MPA described here, are just above the highest of all statistical modeling methods considered in that article [34]. The main advantage of the MPA is that the approach and the applied methods seem to be better suited for diagnostic classifications by providing a way of optimizing the model, specifically for diagnostic decisions with a low rate of false positives (optimizing on the left and right ends of the ROC curve). The latter is consistent with higher rates of patients who can be safely diagnosed as either healthy or as suffering from CAD.
The strength of the current study is that the MPA was developed, expanded, optimized, and validated in two separate independent patient populations (BASEL and LURIC) and that risk score evaluations were confirmed by invasive coronary angiography in all patients. In addition, sensitivity analyses showed that the stability of the MPA is given (results not shown), particularly also for patients in whom CAD could be excluded, indicating that similarly reliable results can be anticipated also for larger populations of the same risk category.
Since studied patients were referred to coronary angiography in the BASEL MPA, and LURIC study, they had a relatively high pretest probability of CAD. In fact, 68% of them had angiographic evidence of CAD. However, the simulation performed as a part of this study allowed to estimate model accuracy also in a low-risk patient population and thus improving the results of various diagnostic tests, especially in low-risk patient populations.
It is a limitation of this study that the results of the low-risk patient population are based in part on statistical simulation and not on a sole study in a low-risk population. A clearly defined endpoint is just achievable with coronary angiography or another validated diagnostic test as the gold standard.
But due to ethical reasons, coronary angiography is not applicable for a sole low-risk patient population. Therefore, the statistical simulation approach is the best practical approach to estimate the model accuracy in a low-risk population.
The predictive power of MPA might even be increased by incorporating further data into the models (e.g., stress testing, non-invasive cardiac imaging). However, for the time being, we decided to only use readily available clinical variables, which makes this approach broadly available and applicable also in primary care and daily clinical practice.
Conclusions
The diagnostic accuracy of the clinical diagnosis of CAD may be improved with the use of an artificial intelligence approach (MPA). The MPA provided an overall higher diagnostic accuracy than the FRS tested with respect to angiographically relevant CAD and is comparable in its predictive value with non-invasive diagnostic tests. This also holds true on an individual patient level. In contrast with other methods and scores, the MPA allows for diagnosing or excluding coronary artery stenosis instead of just predicting the probability for future CAD events.
The current study allows expanding the MPA approach to a broad-risk-spectrum of patients, as an element of decision making and of a patient-tailored approach in the setting of predictive, preventive, personalized medicine. Using the MPA approach may help to prevent further unnecessary diagnostic procedures, including non-invasive CAD testing.
Patients undergoing CAD evaluation may benefit from this AI-facilitated approach, since the diagnostic yield of readily available patient variables used in the MPA may be as high as by non-invasive testing.
In summary, AI-based decision-making algorithms may help doctors and health-care professionals in the decision-making process of suspected coronary artery disease patients. Using artificial intelligence might improve diagnosis of coronary artery disease and decision making and reduce the costs in this field.
Thus, AI may represent an essential tool for complex analysis of the health-related data sooner than expected just a few years ago. Therefore, any practical application, such as the use of MPA presented in this paper, may substantially catalyze further development of PPPM.
Acknowledgments
The MPA modeling process, used in this study has received the 2018 Swiss Biolabs Award for its implementation in a prototype “Cardioexplorer.” The jury consisted of Universities (University Hospital Basel, School of Life sciences Biotechnet Switzerland), industry partners (Sensile Medical, Roche Diagnostics, Omya International AG, Ava Science, Bühlmann Laboratories), and Associations (Swiss Biolabs Association, Economic Development Agency Olten, Basel Area).
Abbreviations
- AI
Artificial intelligence
- CAD
Coronary artery disease
- FRS
Framingham Risk Score
- PROCAM
Prospective Cardiovascular Münster Study
- LURIC
Ludwigshafen Risk and Cardiovascular Health Study
- MPA
Memetic pattern-based algorithm
- PPPM
Predictive, preventive, and personalized medicine
- MCV
Mean corpuscular volume of red blood cells
- MCHC
Mean corpuscular hemoglobin concentration of red blood cells
- INR
International normalized ratio (anticoagulation)
- GGT
Gamma-glutamyl transferase
- ALAT
Alanine aminotransferase
- ASAT
Aspartate aminotransferase
- LDL
Low-density lipoprotein
- HDL
High-density lipoprotein
- H+
Healthy patients/individuals (coronary artery disease excluded)
- CAD+
Patients with coronary artery disease
- TP
True-positive result
- FP
False-positive result
- AUC
Area under the curve
Funding
The study was in part funded by the Swiss Heart Foundation.
Conflict of interest
Michael J. Zellweger is an advisory board member of Exploris AG. Peter Ruff is part owner, board member, and head of Exploris AG, which is a privately owned Swiss research company focusing on development of novel diagnostic solutions. Andrew Tsirkin is head in the modeling and development team of Exploris AG. Vasily Vasilchenko is a data analyst of Exploris AG. Michael Failer is head for regulatory affairs of Exploris AG. Alexander Dressel and Marcus E. Kleber declare that they have no conflict of interest. Winfried März is an advisory board member of Exploris AG.
Ethical approval
All procedures performed in this study involving human participants were in accordance with the ethical standards of the locally appointed ethics committees (Basel: Ethikkommission beider Basel; reference number: 67/08; LURIC: Ethics Committee at the “Ärztekammer Rheinland-Pfalz”; reference number: 837.255.97 (1394)). The study is also in accordance with the 1964 Helsinki declaration and its later amendments or comparable ethical standards.
Consent
Informed consent has been obtained from all of the patients.
References
- 1.Executive Summary of the Third Report of the National Cholesterol Education Program (NCEP) Expert Panel on Detection, Evaluation, and Treatment of High Blood Cholesterol in Adults (Adult Treatment Panel III). JAMA. 2001;285(19):2486–97. [DOI] [PubMed]
- 2.D'Agostino RB, Russell MW, Huse DM, Ellison RC, Silbershatz H, Wilson PW, et al. Primary and subsequent coronary risk appraisal: new results from the Framingham study. Am Heart J. 2000;139(2 Pt 1):272–281. doi: 10.1016/S0002-8703(00)90236-9. [DOI] [PubMed] [Google Scholar]
- 3.Assmann G, Cullen P, Schulte H. The Munster Heart Study (PROCAM). Results of follow-up at 8 years. Eur Heart J. 1998;19(Suppl A):A2–11. [PubMed] [Google Scholar]
- 4.Assmann GCP, Schulte H. The Münster Heart Study. Results of follow-up at 8 years. (PROCAM) Eur Heart J. 1998;19(Suppl A):A2–11. [PubMed] [Google Scholar]
- 5.Ridker PM, Buring JE, Rifai N, Cook NR. Development and validation of improved algorithms for the assessment of global cardiovascular risk in women: the Reynolds risk score. JAMA. 2007;297(6):611–619. doi: 10.1001/jama.297.6.611. [DOI] [PubMed] [Google Scholar]
- 6.Ridker PM, Paynter NP, Rifai N, Gaziano JM, Cook NR. C-reactive protein and parental history improve global cardiovascular risk prediction: the Reynolds Risk Score for men. Circulation. 2008;118(22):2243–2251. doi: 10.1161/CIRCULATIONAHA.108.814251. [DOI] [PMC free article] [PubMed] [Google Scholar]
- 7.Brunner-La Rocca HP, Fleischhacker L, Golubnitschaja O, Heemskerk F, Helms T, Hoedemakers T, et al. Challenges in personalised management of chronic diseases-heart failure as prominent example to advance the care process. EPMA J. 2015;7:2. doi: 10.1186/s13167-016-0051-9. [DOI] [PMC free article] [PubMed] [Google Scholar]
- 8.Golubnitschaja O, Baban B, Boniolo G, Wang W, Bubnov R, Kapalla M, et al. Medicine in the early twenty-first century: paradigm and anticipation-EPMA position paper 2016. The EPMA Journal. 2016;7:–23. 10.1186/s13167-016-0072-4. [DOI] [PMC free article] [PubMed]
- 9.Golubnitschaja O, Costigliola V. EPMA summit 2014 under the auspices of the presidency of Italy in the EU: professional statements. EPMA J. 2015;6(1):4. doi: 10.1186/s13167-015-0026-2. [DOI] [PMC free article] [PubMed] [Google Scholar]
- 10.Polivka J, Jr, Altun I, Golubnitschaja O. Pregnancy-associated breast cancer: the risky status quo and new concepts of predictive medicine. EPMA J. 2018;9(1):1–13. doi: 10.1007/s13167-018-0129-7. [DOI] [PMC free article] [PubMed] [Google Scholar]
- 11.Zellweger MJ, Brinkert M, Bucher U, Tsirkin A, Ruff P, Pfisterer ME. A new memetic pattern based algorithm to diagnose/exclude coronary artery disease. Int J Cardiol. 2014;174(1):184–186. doi: 10.1016/j.ijcard.2014.03.184. [DOI] [PubMed] [Google Scholar]
- 12.Ngwa JS, Cabral HJ, Cheng DM, Pencina MJ, Gagnon DR, LaValley MP, et al. A comparison of time dependent cox regression, pooled logistic regression and cross sectional pooling with simulations and an application to the Framingham heart study. BMC Med Res Methodol. 2016;16(1):148. doi: 10.1186/s12874-016-0248-6. [DOI] [PMC free article] [PubMed] [Google Scholar]
- 13.D'Agostino RB, Lee ML, Belanger AJ, Cupples LA, Anderson K, Kannel WB. Relation of pooled logistic regression to time dependent Cox regression analysis: the Framingham heart study. Stat Med. 1990;9(12):1501–1515. doi: 10.1002/sim.4780091214. [DOI] [PubMed] [Google Scholar]
- 14.Siontis GC, Tzoulaki I, Siontis KC, Ioannidis JP. Comparisons of established risk prediction models for cardiovascular disease: systematic review. BMJ. 2012;344:e3318. doi: 10.1136/bmj.e3318. [DOI] [PubMed] [Google Scholar]
- 15.Shaw LJ, Polk DM, Kahute TA, Wong ND, Moon J, Miranda-Peats R, Rozanski A, Friedman JD, Hayes S, Thomson L, Berman DS. Prognostic accuracy of B-natriuretic peptide measurements and coronary artery calcium in asymptomatic subjects (from the early identification of subclinical atherosclerosis by noninvasive imaging research [EISNER] study) Am J Cardiol. 2009;104(9):1245–1250. doi: 10.1016/j.amjcard.2009.06.041. [DOI] [PubMed] [Google Scholar]
- 16.Grossi E. How artificial intelligence tools can be used to assess individual patient risk in cardiovascular disease: problems with the current methods. BMC Cardiovasc Disord. 2006;6:20. doi: 10.1186/1471-2261-6-20. [DOI] [PMC free article] [PubMed] [Google Scholar]
- 17.Ioannidis JP. Personalized genetic prediction: too limited, too expensive, or too soon? Ann Intern Med. 2009;150(2):139–141. doi: 10.7326/0003-4819-150-2-200901200-00012. [DOI] [PubMed] [Google Scholar]
- 18.Itchhaporia D, Snow PB, Almassy RJ, Oetgen WJ. Artificial neural networks: current status in cardiovascular medicine. J Am Coll Cardiol. 1996;28(2):515–521. doi: 10.1016/0735-1097(96)00174-X. [DOI] [PubMed] [Google Scholar]
- 19.Tzoulaki I, Liberopoulos G, Ioannidis JP. Assessment of claims of improved prediction beyond the Framingham risk score. JAMA. 2009;302(21):2345–2352. doi: 10.1001/jama.2009.1757. [DOI] [PubMed] [Google Scholar]
- 20.Winkelmann BR, Marz W, Boehm BO, Zotz R, Hager J, Hellstern P, et al. Rationale and design of the LURIC study—a resource for functional genomics, pharmacogenomics and long-term prognosis of cardiovascular disease. Pharmacogenomics. 2001;2(1 Suppl 1):S1–73. doi: 10.1517/14622416.2.1.S1. [DOI] [PubMed] [Google Scholar]
- 21.Reibnegger G, Schrabmair W. Optimum binary cut-off threshold of a diagnostic test: comparison of different methods using Monte Carlo technique. BMC Med Inform Decis Making. 2014;14:99. doi: 10.1186/s12911-014-0099-1. [DOI] [PMC free article] [PubMed] [Google Scholar]
- 22.Carpenter GA, Grossberg S, Markuzon N, Reynolds JH, Rosen DB. Fuzzy ARTMAP: a neural network architecture for incremental supervised learning of analog multidimensional maps. IEEE Trans Neural Netw. 1992;3(5):698–713. doi: 10.1109/72.159059. [DOI] [PubMed] [Google Scholar]
- 23.Catto JW, Linkens DA, Abbod MF, Chen M, Burton JL, Feeley KM, Hamdy FC. Artificial intelligence in predicting bladder cancer outcome: a comparison of neuro-fuzzy modeling and artificial neural networks. Clin Cancer Res. 2003;9(11):4172–4177. [PubMed] [Google Scholar]
- 24.Hammer B, Micheli A, Sperduti A, Strickert M. Recursive self-organizing network models. Neural Netw. 2004;17(8–9):1061–1085. doi: 10.1016/j.neunet.2004.06.009. [DOI] [PubMed] [Google Scholar]
- 25.Johnson DS, Hoeting JA. Autoregressive models for capture-recapture data: a Bayesian approach. Biometrics. 2003;59(2):341–350. doi: 10.1111/1541-0420.00041. [DOI] [PubMed] [Google Scholar]
- 26.Knowles JD, Corne DW. Approximating the nondominated front using the Pareto archived evolution strategy. Evol Comput. 2000;8(2):149–172. doi: 10.1162/106365600568167. [DOI] [PubMed] [Google Scholar]
- 27.Kohonen T. Self-organizing neural projections. Neural Netw. 2006;19(6–7):723–733. doi: 10.1016/j.neunet.2006.05.001. [DOI] [PubMed] [Google Scholar]
- 28.Kuncheva LI. Evaluation of computerized medical diagnostic decisions via fuzzy sets. Int J Biomed Comput. 1991;28(1–2):91–100. doi: 10.1016/0020-7101(91)90029-E. [DOI] [PubMed] [Google Scholar]
- 29.Mobley BA, Schechter E, Moore WE, McKee PA, Eichner JE. Predictions of coronary artery stenosis by artificial neural network. Artif Intell Med. 2000;18(3):187–203. doi: 10.1016/S0933-3657(99)00040-8. [DOI] [PubMed] [Google Scholar]
- 30.Mobley BA, Schechter E, Moore WE, McKee PA, Eichner JE. Neural network predictions of significant coronary artery stenosis in men. Artif Intell Med. 2005;34(2):151–161. doi: 10.1016/j.artmed.2004.08.003. [DOI] [PubMed] [Google Scholar]
- 31.Moon H, Ahn H, Kodell RL, Baek S, Lin CJ, Chen JJ. Ensemble methods for classification of patients for personalized medicine with high-dimensional data. Artif Intell Med. 2007;41(3):197–207. doi: 10.1016/j.artmed.2007.07.003. [DOI] [PubMed] [Google Scholar]
- 32.Ontrup J, Ritter H. Large-scale data exploration with the hierarchically growing hyperbolic SOM. Neural Netw. 2006;19(6–7):751–761. doi: 10.1016/j.neunet.2006.05.015. [DOI] [PubMed] [Google Scholar]
- 33.Montalescot G, Sechtem U, Achenbach S, Andreotti F, Arden C, Budaj A, et al. 2013 ESC guidelines on the management of stable coronary artery disease: the task force on the management of stable coronary artery disease of the European Society of Cardiology. Eur Heart J. 2013;34(38):2949–3003. doi: 10.1093/eurheartj/eht296. [DOI] [PubMed] [Google Scholar]
- 34.Kurt I, Ture M, Kurum AT. Comparing performances of logistic regression, classification and regression tree, and neural networks for predicting coronary artery disease. Expert Syst Appl. 2008;34(34):366–374. doi: 10.1016/j.eswa.2006.09.004. [DOI] [Google Scholar]