

Abstract
Reversible tyrosine phosphorylation plays a crucial role in signal transduction, regulating many biological functions including proliferation, differentiation, and motility. The comprehensive characterization of the tyrosine phosphorylation state of a cell is of great interest for understanding the mechanisms that underlie signaling; however, current methods for analyzing tyrosine-phosphorylated proteins in crude protein extracts provide limited information, or are laborious and require relatively large amounts of protein. We have developed a simple, rapid, and flexible competitive binding assay based on the far-Western blot technique, in which a battery of Src homology 2 domain probes is used to detect patterns of specific tyrosine-phosphorylated sites. We demonstrate that distinct profiles of tyrosine phosphorylation can be detected with high sensitivity and specificity and low background. This proteomic approach can be used to rapidly profile the global tyrosine phosphorylation state of any cell of interest and has obvious applications as a molecular diagnostic tool, for example in the classification of tumors. The general strategy we describe here is not limited to Src homology 2 domains and could be used to profile the binding sites for any class of protein interaction domain.
The process of signal transduction is essential for cellular functions such as proliferation, differentiation, cytoskeletal organization, and cell survival, and aberrant signaling is a hallmark of many diseases (1–3). Specific protein–protein interactions play a key role in this process by mediating the assembly of complexes or relocalization of proteins in response to signals (4). Reversible tyrosine phosphorylation is an early step in the transduction of many types of signals in multicellular organisms. Signaling proteins phosphorylated on tyrosine residues are specifically recognized by Src Homology 2 (SH2) modular protein interaction domains; thus, creation of SH2 binding sites serves to transmit a signal by altering the local concentrations of proteins containing SH2 domains and bringing them into contact with new partners or substrates (5, 6). One way in which we can define the signaling state of the cell, therefore, is by the presence or absence of binding sites for various SH2 domains, the subcellular localization of those sites, and the ensemble of proteins that are available to bind to those sites.
SH2 domains, which are found in a wide variety of signaling proteins, consist of ≈100 aa and can be separated from the original protein without loss of function (7). Their ligand binding surfaces specifically interact with phosphotyrosine (PTyr) in the context of short linear sequence motifs. The specificity of the interaction is determined by the amino acid composition of the core binding site, with the general motif pYxxΨ (where pY stands for PTyr, Ψ for hydrophobic amino acids, and x for selected amino acids important for specific interaction) (8, 9). The affinities for SH2 domain–ligand interactions are moderate, in the range of 10−8 M to 10−5 M (10).
Although the global characterization of the tyrosine phosphorylation status of the cell is of great interest, both as a first step in defining the signaling state of the cell and also as a molecular diagnostic tool, current methods for the analysis of PTyr profiles are limited. A broad picture of tyrosine phosphorylation can be obtained by immunoblotting with PTyr-specific antibodies (11, 12). However, this approach cannot discriminate between different classes of phosphorylation sites and is relatively insensitive. Recent progress in two-dimensional gel electrophoresis followed by mass spectrometry allows the comprehensive analysis of the tyrosine phosphorylation state in complex mixtures of proteins (13–15). However, this approach has the major disadvantage that relatively large amounts of protein are needed. Furthermore, it is technically demanding and therefore not practical for routine analysis in most research and clinical laboratories.
We have previously shown that far-Western blot analysis with labeled SH2 domain probes can be used to detect tyrosine phosphorylation in signaling proteins (16, 17). Relatively high background is a major drawback of the technique, however, making detection of tyrosine-phosphorylated proteins problematic in cases where the levels of phosphorylation are low, as in most normal cells and tissues. In addition, SH2 domains tend to bind to a broad spectrum of phosphorylated partners in such assays, not only those for which they have the highest affinity. We report here the development of a competitive far-Western blot method with dramatically improved specificity and sensitivity. We demonstrate that this approach can detect distinctive profiles of tyrosine-phosphorylated proteins in complex mixtures of cellular proteins.
Materials and Methods
Expression and Purification of Glutathione S-Transferase (GST)-SH2 Domains.
SH2 domains were of human origin except Abl (mouse) and Crk and Src (chicken). The Ras-GAP probe contained the two SH2 domains connected by its SH3 domain (SH2-SH3-SH2), probes for phosphatidylinositol 3-kinase (PI3-kinase) and phospholipase C-γ (PLC-γ) were composed of tandem SH2 domains, and the SHP-2 probe consisted of the N-terminal SH2 domain. SH2 domains were cloned into pGEX fusion vectors (Amersham Pharmacia), and GST fusion proteins were expressed in Escherichia coli and affinity-purified on glutathione-Sepharose beads according to established protocols (16). Protein concentration was determined by Bradford assay (Bio-Rad), and purity and lack of degradation products were confirmed by SDS/PAGE and protein staining.
Binding Assay and Immunoblot Analysis.
Eighty micrograms of crude cellular lysate was separated by SDS/PAGE and transferred to PVDF membranes; filters were blocked in 10% nonfat dry milk in TBST (Tris-buffered saline with Tween: 150 mM NaCl/10 mM Tris, pH 8.0/0.05% Tween 20) plus orthovanadate (1 mM) and EDTA (5 mM) at 4°C overnight. GST-fused SH2 domains (1 μg) were preincubated for 30 min at room temperature with 0.2 μg of glutathione-conjugated horseradish peroxidase (GSH-HRP) (G-6400, Sigma). For the binding reaction, labeled probes were incubated with the blocked membranes in TBST at a final concentration of 1 μg/ml for 30 min at room temperature. When present, competitors were simultaneously added to the binding reaction at equimolar concentrations. Subsequently, filters were washed three times for 10 min in TBST, and bound probe was detected by chemiluminescence using the ECL kit (Amersham Pharmacia).
For phosphatase treatment, filters were preblocked for 1 h at 4°C in 20 mM Tris, pH 7.4/150 mM NaCl/10% glycerol/2 mM EDTA, pH 8.8/2 mM DTT/0.1% Triton X-100/1% BSA and then incubated for 1 h at room temperature in the same buffer containing 1.5 μg/ml purified GST-PTP1B. Filters were then washed twice in TBST and blocked and probed as described above.
For immunoblotting, tyrosine-phosphorylated proteins were detected with mAb 4G10 (Upstate Biotechnology, Lake Placid, NY); platelet-derived growth factor β (PDGFRβ receptor) was detected with mAb A-3 (Santa Cruz Biotechnology); Abl was detected with mAb Ab-3 (Calbiochem). Abl was immunoprecipitated with polyclonal rabbit antiserum raised against the Abl N terminus.
Generation of Competitive Probes.
To generate covalent complexes, equal volumes of 100 mM ethacrynic acid (Sigma; dissolved in a 1:1 mixture of absolute ethanol and TBST) and 100 mM reduced glutathione in TBST were mixed and adjusted with TBST to a final concentration of 10 mM each; pH was adjusted to 8.0 by the addition of Tris (pH 9.5), and the mixture was incubated at 4°C overnight. Subsequently, 500 μg of GST fusion protein was added per ml of ethacrynic acid/glutathione solution and incubated for 2 h at room temperature. Conjugated GST fusion proteins were purified by gel filtration (PD10 column, Amersham Pharmacia, equilibrated with 1 × PBS, 10% glycerol), unreacted GST fusion was removed by incubation with glutathione-Sepharose beads, and competitor was stored in aliquots at −80°C.
Tissue Culture and Protein Extraction.
Cell lines were grown in DMEM or RPMI 1640 supplemented with 10% FCS and antibiotics. Mono-Mac-I cell line was from N. Ramesh (Children's Hospital, Boston, MA); BaF3 cells expressing the 210-kDa Bcr-Abl gene product under the control of a tetracycline-inducible promoter were from F. Gesbert (Dana–Farber Cancer Institute); and human multiple myeloma cell lines were from B. Lin and K. Anderson (Dana–Farber Cancer Institute). Stably transfected HepG2 cells expressing wild-type or mutant human PDGFβ receptor (and lacking endogenous PDGFα and PDGFβ receptor) were from A. Kazlauskas (Schepens Eye Institute, Boston MA). Following serum starvation for 24 h in 0.1% FCS, cells were stimulated with recombinant human PDGF-BB (5 ng/ml, GIBCO) for 5 min before lysis. Cells were lysed in Triton extraction buffer on ice in the presence of protease inhibitors and orthovanadate/pervanadate as previously described (16).
Results
Establishment of the Binding Assay.
We used far-Western blotting as a starting point for the analysis of tyrosine-phosphorylated proteins. In this approach, whole cellular protein extracts are separated by electrophoresis, immobilized on membranes, and probed with purified SH2 domains expressed as recombinant GST fusion proteins. Several nonradioactive techniques are currently used to detect bound GST fusion proteins, most frequently involving biotinylation of the fusion proteins or detection with GST-specific antibodies (16, 18). In our hands, however, these techniques result in unacceptably high levels of background. This was a serious problem because we wish to profile tyrosine-phosphorylated proteins in lysates of normal cells, where the levels of those proteins are very low. To overcome this, we developed a novel approach for the labeling and detection of GST fusion proteins on membranes based on the specific and rapid binding of glutathione to GST. Oligomerized GSH-HRP was preincubated with GST-SH2 fusion proteins, and the preformed complex was used directly to probe blots without further purification (Fig. 1). After brief incubation, membranes were washed to remove unbound probe, and binding of labeled SH2 domains to tyrosine-phosphorylated proteins was detected by chemiluminescence.
Figure 1.

Anti-PTyr immunoblot (Left) and far-Western blots of whole cellular protein extracts of v-Abl-transformed 3T3 cells (N54) and parental NIH 3T3 cells. Whole cell lysates were transferred to membranes and probed with anti-PTyr antibody, or GST-Abl SH2 (Abl) or GST alone. Unlabeled probe was detected with GST-specific polyclonal antibody (anti-GST). Biotin-labeled probe was detected with streptavidin-HRP (biotinylated). Improved signal and decreased background with GSH-HRP-labeled probe (GSH-HRP). The positions and apparent molecular mass of prestained markers are given on the left (in kDa).
We first tested this system with protein extracts of murine 3T3 fibroblasts and v-Abl-transformed 3T3 cells. The uncontrolled kinase activity of v-Abl results in a dramatic elevation in tyrosine phosphorylation compared with untransformed cells, as demonstrated by immunoblotting with a PTyr-specific monoclonal antibody (Fig. 1). As expected, strong signals were seen in Abl-transformed cells when membranes were probed with the Abl SH2 domain and detected by GST-specific antibodies, or with biotin-labeled Abl SH2 domain detected with a streptavidin conjugate (Fig. 1). However, in both cases high levels of background were seen when GST alone was used as a probe, partially obscuring the SH2-specific signal. In contrast, direct labeling of the probe with GSH-HRP resulted in the strong and specific detection of tyrosine-phosphorylated proteins and a dramatic decrease in nonspecific background (Fig. 1). Signals with GSH-HRP-labeled probes were linearly dependent on the amount of immobilized protein, allowing the detection of tyrosine-phosphorylated proteins in less than 20 μg of whole cellular protein extracts. We also found that binding was very rapid, with near-maximal binding after 10 min of incubation (data not shown). The substantial improvement in signal-to-noise ratio afforded by this labeling approach makes feasible the analysis of samples with relatively low levels of tyrosine phosphorylation.
We next compared the binding characteristics of 12 different SH2 domains by using the same lysates (Fig. 2A). As expected from binding studies with phosphopeptide libraries (8, 9), there were marked differences in the binding profiles, demonstrating that different tyrosine-phosphorylated proteins are specifically recognized by different SH2 domains. However, for many SH2 domains, substantially overlapping patterns of binding were observed, approximating the overall pattern of tyrosine phosphorylation seen with anti-PTyr antibodies. Because the labeled domains are applied in large molar excess over the immobilized phosphoproteins on the filter, some of the overlapping signal is likely the result of binding of the probes to relatively low affinity sites. Indeed, SH2 domains can bind to PTyr alone, albeit with low affinity (17). Such a loss of specificity would make it difficult to use this method to profile the tyrosine-phosphorylated sites that preferentially bind to a particular SH2 domain.
Figure 2.

Far-Western blot analysis of whole cellular extracts of v-Abl-transformed (N54) and normal 3T3 fibroblasts probed with 12 different GSH-HRP-labeled SH2 domains. (A) Binding was performed under noncompetitive conditions with individual SH2 domains. (B) Competitive binding reaction. Each filter strip was probed with one GSH-HRP-labeled SH2 domain in the presence of 11 ethacrynic acid-blocked competitor probes at equimolar concentration. GST alone served as control.
In the process of normal signal transduction, many different SH2 domains in the cytosol compete for binding to limited tyrosine-phosphorylated sites, with the result that each SH2 binds only to its highest affinity partners. We reasoned that, in a similar fashion, competition among SH2 domains might also sharpen the apparent specificity of binding in the far-Western assay. We therefore tested the effect of performing binding reactions under competitive conditions, in which one labeled SH2 domain was simultaneously incubated with an excess of unlabeled heterologous SH2 domains. However, we first needed to devise a method to prevent the GSH-HRP label, which is noncovalently bound to the GST fusion protein probe, from labeling the competitors if it were to dissociate from the probe during incubation. To circumvent this problem, ethacrynic acid was used to irreversibly couple glutathione to the competitors before the binding reaction. Ethacrynic acid has been described as a GST inhibitor; although the mechanism is not precisely known, ethacrynic acid–glutathione conjugates are thought to covalently bind to GST, thereby preventing the subsequent binding of free glutathione (19). We prepared a series of ethacrynic acid-blocked competitors and performed binding studies with one labeled probe in the presence of a mixture of competitors.
As shown in Fig. 2B, binding of the various SH2 domains to tyrosine-phosphorylated proteins was in some cases almost completely abolished under competitive binding conditions, whereas for other SH2 domains enhanced specificity and decreased background were observed. This suggests that among these 12 SH2 domains, some (Abl, Lck, Nck, PLC-γ, and Shc) are relatively weak binders or have relatively broad or highly overlapping specificities, leading to loss of signal under competition, whereas others (Crk, Fyn, GAP, PI-3K, Grb2, SHP-2, and Src) are more highly specific, and for these domains the major effect of competition was to eliminate binding to relatively low affinity sites. For these probes, competition has two beneficial effects: it increases the specific information that can be gleaned from a binding reaction (for example, the patterns for Crk and Fyn are very similar under noncompetitive conditions, whereas the patterns are almost entirely distinct when filters are probed competitively), and it dramatically reduces nonspecific background (for example, compare the patterns under noncompetitive and competitive conditions for PI3-kinase and SHP-2).
Binding of SH2 Domains to the Activated PDGFβ Receptor.
To gauge the sensitivity and specificity of the competitive assay, we tested the binding of different SH2 domains to well defined recognition sites in the activated PDGFβ receptor. The cytoplasmic domain of the human PDGFβ receptor contains at least 11 different autophosphorylation sites, to which association of many different SH2 domain-containing proteins has been described (20). PI3-kinase specifically binds to phosphorylated sites at positions Tyr-740 and Tyr-751, Ras-GAP to Tyr-771, and PLC-γ to Tyr-1009 and Tyr-1021, respectively (21, 22). Binding to these or other autophosphorylation sites has also been reported for Grb2, Grb7, Nck, Shc, SHP-2, Src, and Stat5 (20).
Competitive far-Western binding assays were performed with protein extracts of PDGF-stimulated HepG2 cells expressing the wild-type PDGFβ receptor or mutants lacking specific phosphorylation sites. Levels of expression in these cells were comparable to physiological levels of PDGFβ receptor expression in normal NIH 3T3 cells (data not shown). Under competitive conditions, strong binding to the activated wild-type receptor was observed for the PI3-kinase, Ras-GAP, and PLC-γ SH2 domains, whereas binding was completely abolished when tyrosines in the known binding sites for these domains were mutated to phenylalanine (Fig. 3A). Interestingly, no specific binding was observed for Grb2, Nck, SHP-2, and Src SH2s (data not shown), indicating either that the corresponding recognition sites remain unphosphorylated or below the level of detection in PDGF-stimulated HepG2 cells, or the binding of these proteins to the receptor is indirect. Compared with competitive assays, relatively nonselective binding of all SH2 domains to the mutant receptors was observed in the absence of competition (Fig. 3B). These data demonstrate that, at levels of protein expression and phosphorylation comparable to normal physiological conditions, the competitive binding assay allows detection of specific tyrosine-phosphorylated recognition sites and can discriminate between binding sites for different SH2 domains.
Figure 3.
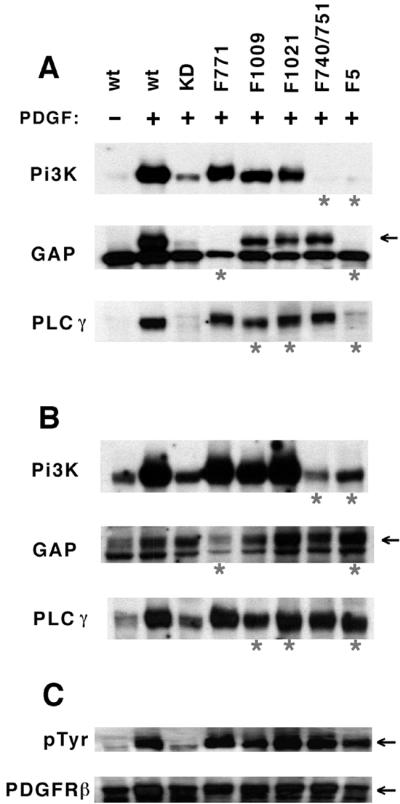
Specific detection of tyrosine-phosphorylated sites in the activated human PDGFβ receptor. (A) Competitive binding assay under conditions as described in Fig. 2 with lysates of unstimulated and PDGF-stimulated HepG2 cells expressing the wild-type or mutant PDGFβ receptor. For receptor mutants, tyrosine residues at specific binding sites for the SH2 domains of PI3-kinase, Ras-GAP, and PLC-γ were replaced by phenylalanine. All five binding sites are mutated in the F5 mutant; KD denotes kinase-inactive K634R mutant. Mutants predicted to lack binding sites for the corresponding SH2 domains are marked by asterisks. For PLC-γ SH2 domain, phosphorylation of either Tyr-1009 or Tyr-1021 was sufficient for binding, whereas no binding was seen when both residues were mutated in the F5 mutant. For Ras-GAP probe, the band corresponding to PDGFβ receptor is marked by an arrow; a protein of lower molecular weight was recognized by the SH3 domain also present in probe. (B) Identical filters probed under noncompetitive conditions, demonstrating decreased specificity. (C) Identical filters immunoblotted with antibodies for PTyr and PDGFβ receptor.
SH2 Binding Profiles in Cells Expressing Abl Mutants.
To further test the utility of the SH2 profiling method, we analyzed the tyrosine-phosphorylated proteins in cells expressing Abl variants bearing different SH2 domains. Previous work has shown that activated Abl mutants in which the Abl SH2 is swapped with other SH2 domains (with different binding specificities) phosphorylate different spectra of proteins in vivo (23). This is most likely because binding of a phosphorylated substrate to the SH2 domain on Abl both protects that site from dephosphorylation and facilitates processive phosphorylation of other sites on the substrate; thus, proteins that can bind with high affinity to the SH2 domain are preferentially phosphorylated (24, 25). We transfected 293T cells with activated Abl mutants bearing the Abl, GAP, PI3-kinase, or Crk SH2 domain and probed whole cell lysates with each of these four SH2 domains under competitive conditions (one labeled probe and three unlabeled competitors). As expected from the model, in each case the SH2 probe bound preferentially to phosphoproteins in cells expressing the Abl variant bearing the corresponding SH2 domain (Fig. 4A). This is most obvious in the case of the PI3-kinase SH2; the Abl, GAP, and Crk SH2 probes bound few if any proteins phosphorylated by the Abl mutant bearing the PI3-kinase SH2, whereas the PI3-kinase SH2 probe specifically bound only to proteins phosphorylated by this mutant.
Figure 4.

SH2 probes specifically recognize a subset of proteins in cells transformed by Abl SH2 swap mutants. 293T cells expressing activated Abl mutants lacking SH2, containing normal Abl SH2, or with Abl SH2 replaced with that of GAP, PI3-kinase, or Crk were analyzed by far-Western blotting with indicated SH2 probes under competitive conditions (A) or immunoblotted with antibodies to PTyr or Abl (B). (A and B Left) Whole cell extracts were analyzed. (B Right) Abl was first immunoprecipitated before immunoblotting. Distinctive PTyr-containing proteins recognized by the different SH2 domains are indicated by black circles to the right of the bands.
In addition to confirming the role of the SH2 domain in substrate selection by Abl, this experiment demonstrates that SH2 profiling can provide much more specific information than anti-PTyr immunoblotting, which detects only subtle differences in the patterns of proteins phosphorylated by the various Abl mutants (Fig. 4B). We were also able to test whether SH2 profiling specifically detects proteins that associate with a corresponding SH2 domain in vivo. To do this, we immunoprecipitated the Abl SH2 swap mutants and analyzed coprecipitating proteins by anti-PTyr immunoblotting (Fig. 4B). In each case, coprecipitating tyrosine-phosphorylated proteins were detected that correspond to proteins specifically identified by far-Western blotting. For example, a ≈40-kDa phosphoprotein that coprecipitated with the Abl variant bearing the Crk SH2 was also detected by the Crk SH2 probe in far-Western blots; similarly, ≈62-kDa and ≈190-kDa phosphoproteins coprecipitating with the variant bearing the GAP SH2 were detected by the GAP SH2 probe. This suggests that proteins detected by SH2 profiling are likely to reflect proteins that bind the corresponding SH2 domain in the cell.
SH2 Binding Profiles of Hematopoietic Cell Lines.
We next tested whether the competitive SH2 binding approach could be used to profile tyrosine phosphorylation in different human hematopoietic cell lines. Because one of the most promising uses for SH2 domain profiling would be as a molecular diagnostic tool to “fingerprint” or classify cells such as tumor cells, we were interested in whether we could detect strong and distinct SH2 profiles from different cell lines. Five different SH2 domains were used as probes (where 1 labeled and 11 unlabeled domains were present at equimolar concentrations in the binding reactions). The overall status of tyrosine phosphorylation was also determined by anti-PTyr immunoblot. As can be readily appreciated from Fig. 5A, each SH2 domain recognized a distinct pattern of binding proteins, and furthermore each cell line displayed a unique profile or fingerprint of SH2 binding proteins. The SH2 domain probes specifically identify tyrosine-phosphorylated proteins, as treatment of the membranes with the tyrosine-specific phosphatase PTP-1B abolished specific binding (data not shown). As expected, some similarities were apparent in lines with similar biological properties. For example, two of these cell lines express the BCR-Abl oncoprotein: the K562 CML-derived erythroleukemia cell line and a BaF3 pro-B cell line engineered to express BCR-Abl (BaF3+). In these two lines, similar strong binding to phosphoproteins in the range of 40–50 kDa was observed for the Crk, Fyn, and Ras-GAP SH2s, whereas proteins of ≈90 and ≈110 kDa were detected by the PI3-kinase SH2 domain. Most dramatically, the only strong signals detected by the Grb2 SH2 in this entire panel of cell lines were bands of ≈40 and ≈210 kDa in the two lines expressing BCR-Abl. The ≈210-kDa protein is almost certainly BCR-Abl itself, for which a Grb2 SH2 binding site has been described (26, 27). Although the overall profiles of tyrosine phosphorylation of the BaF3+ and K562 cells were quite similar, differences in binding patterns were also clearly evident with the Crk and PI3-kinase probes, as expected given the different origin of the two lines. Interestingly, the tyrosine phosphorylation profile of v-Abl-transformed 3T3 fibroblasts (N54) was completely different from those of the BCR-Abl-expressing hematopoietic lines, indicating that very different target proteins are phosphorylated in these cells, and suggesting that different proteins are involved in transformation of the two cell types by Abl.
Figure 5.

Determination of SH2 binding profiles for various hematopoietic cell lines. Identical filters were probed with five different SH2 domains [Crk, Fyn, Ras-GAP, Grb2, and PI3-kinase (Pi3K)] under competitive conditions as described above, or immunoblotted with anti-PTyr. v-Abl-transformed 3T3 cells (N54) were used as a positive control (40% of the protein amount in other lanes). BaF3− and BaF3+, BaF3 pro-B cells before and after induction of exogenous Bcr-Abl; K562, CML-derived erythroblastoid line; Daudi and BJAB, Burkitt's lymphoma-derived B cell lines; Jurkat, acute T-cell leukemia; Mono-Mac-I, acute monocytic leukemia. MM-AS, MM-SL, MM-SV, IM-9, HS-Sultan, and RPMI 8226 are cell lines derived from different multiple myeloma patients. Plasmacytoma cell lines MM-IR and MM-IS are derived from the same patient and are resistant and sensitive to dexamethasone, respectively.
For the Burkitt's lymphoma cell lines Daudi and BJAB, similarities in the patterns of tyrosine phosphorylation were observed for the Fyn and PI3-kinase SH2s, whereas the patterns for the Crk SH2 were clearly distinct. In turn, the profiles of the Burkitt's lymphoma cells were almost entirely different from those of the BCR-Abl transformed cells. Similarly, distinct patterns of phosphorylation were obtained for the Jurkat T-cell lymphoma cell line, for Mono-Mac-I acute monoblastic leukemia-derived cells, and for several multiple myeloma cell lines. Multiple myeloma lines could also be grouped by similarities in their SH2 binding patterns; for example, the PI3-kinase SH2 revealed one pattern for MM-AS, MM-SV, and HS-Sultan and a very different pattern with a prominent ≈175-kDa band for all of the others. Interestingly, MM-IR and MM-IS cells are derived from the same patient but differ in their sensitivity to dexamethasone; whereas the two lines showed virtually identical patterns of phosphorylation when probed with the various SH2 domains, the Crk probe detected a strong additional band of ≈110 kDa exclusively in the dexamethasone-resistant MM-IR cells. It is tempting to speculate that this protein might either play a functional role in resistance or serve as a molecular marker of it.
These findings demonstrate that cell type-specific profiles of tyrosine phosphorylation can be generated by the competitive binding assay. As expected, both similarities and differences can be detected when closely related cell lines are compared, suggesting this method could serve as a molecular diagnostic tool for the functional classification of cells. Compared with anti-PTyr immunoblotting, SH2 profiling displayed equal or greater sensitivity. In several cases, this method detected proteins that were not seen by anti-PTyr (for example, the Fyn probe in BJAB and Daudi cells or the PI3-kinase probe in multiple myeloma cells), indicating that this approach provides novel information that could not be easily obtained by other currently used methods.
Discussion
In this report, we describe an approach for profiling the global tyrosine phosphorylation state in protein extracts. Individual tyrosine-phosphorylated recognition sites can be specifically detected, as demonstrated by binding studies with the PDGF receptor mutants, and experiments with hematopoietic cell lines demonstrate that this approach can detect distinctive cell type-specific profiles of tyrosine phosphorylation. The assay is simple, rapid, sensitive, does not involve radioactivity, and requires relatively small amounts of crude protein extract without previous purification or enrichment. Moreover, the general approach we describe here is not limited to SH2 domains and can be applied to any type of modular binding domain. Recently, for example, we demonstrated that binding of different SH3 domains of Nck to proline-rich recognition sequences in N-WASP could easily be studied by using GST-SH3 fusion proteins labeled with GSH-HRP (28). We presume that profiles of binding sites present for any class of modular binding domain, or combination of such domains, could be generated by this approach.
Compared with existing blot overlay techniques, a significant improvement in signal-to-noise ratio was achieved by direct labeling of the binding domains with oligomerized GSH-HRP. The dramatic reduction in nonspecific background is presumably due to the selective labeling of functionally active fusion proteins (with intact glutathione binding sites). In contrast, labeling by other methods is generally insensitive to the functional state of the protein, resulting in the labeling of denatured and/or aggregated probe, which probably contributes to higher levels of background. Moreover, improved sensitivity is likely the result of use of oligomerized GSH-HRP instead of monomers, as this increases both the avidity of binding and the number of labels per binding domain.
Another important improvement in specificity was achieved by performing the binding reactions in the presence of unlabeled competitor domains. SH2 domains have overlapping binding specificities, but competitive binding conditions can enhance discrimination between high and low affinity binding sites and thus allow distinct profiles to be detected by different domains. In practice, depending on the identity of the probe and competitors, competition can either sharpen specificity or virtually eliminate binding (Fig. 2). If multiple domains with binding specificities very similar to that of the probe are included among the competitors, the effect will be akin to self-competition with unlabeled probe. Therefore, to gain the maximum information from SH2 profiling experiments, it will be important not only to include as many different binding specificities as possible among the probes and competitors but also to exclude multiple domains with very similar binding specificities.
At this time, more than 140 different SH2 domains have been described, and annotation of the human genome will undoubtedly reveal additional candidates (4). We envision that if we were to perform the binding assay with a comprehensive set of SH2 domain probes encompassing all binding specificities, we would obtain a global view of the overall tyrosine phosphorylation state of the cell. We realize that the current form of the assay, involving electrophoretic separation of proteins and separate binding reactions for each individual SH2 domain probe, will be cumbersome to scale up to the perhaps 50 or more SH2 domains in such a comprehensive screen. However, the very low background and high signals we observe under competitive binding conditions suggest that multiplexed detection of differentially labeled SH2 domains is feasible, allowing the binding of many domains to be assayed simultaneously. Indeed, the signal-to-noise is low enough that a purely quantitative binding assay, involving the simultaneous binding of tens or hundreds of uniquely labeled probes to a sample without electrophoretic separation, might serve as the basis for a high-throughput method to generate a rough profile of the overall tyrosine phosphorylation state.
One promising use of SH2 profiling is as a molecular diagnostic tool for the classification of cells based on functional differences in their signaling state (specifically, the presence of distinctive patterns of tyrosine-phosphorylated proteins). It may prove possible to use clustering algorithms to classify various samples, for example tumors, based on the relatedness of their SH2 binding profiles. This would be analogous to the way in which cDNA expression profiles are beginning to be used to classify tumors (29, 30). Patient outcome data could then be correlated with SH2 profiles to determine whether a particular pattern or specific protein band correlates with clinical parameters such as prognosis or response to therapy. Preliminary studies with human leukemia samples revealed that differential patterns of tyrosine phosphorylation are also observed in patient samples (unpublished results).
Because SH2 binding patterns are likely to reflect changes that can directly cause or contribute to disease (for example, autocrine stimulation of growth factor or cytokine receptors in tumor cells), SH2 profiles might identify novel targets for drug discovery. The potential of this approach can be illustrated by an example from the panel of hematopoietic cell lines shown in Fig. 5. Of all of the cell lines analyzed, only the two Bcr-Abl-transformed lines reacted strongly with the Grb2 SH2 probe, and one of the two proteins bound is almost certainly Bcr-Abl itself. Thus, if Bcr-Abl had not already been known, the SH2 profiling approach would have highlighted this protein and could have served as the basis for its identification. Although the SH2 profiling approach does not unambiguously identify the protein in each band, it will be relatively easy to determine the molecular identity (by affinity chromatography and mass spectrometry, for example) of any band whose phosphorylation correlates with poor clinical outcome or is of interest for any other reason. Therefore, this profiling approach becomes a rapid and simple means of highlighting proteins whose further characterization is warranted.
Acknowledgments
We thank Z. Songyang, S. Shoelson, A. Kazlauskas, S. Burakoff, F. Gesbert, N. Ramesh, B. Paw, B. Lin, K. Anderson, and B. Neel for for providing SH2 domain constructs and/or cell lines, and J.M. Smith and K. Machida for critically reading this manuscript. We gratefully acknowledge the help of T. Battle and D. Frank (Dana–Farber Cancer Institute) with leukemia samples. We are especially grateful for the support and encouragement of S.C. Harrison (Children's Hospital). P.N. was supported by Deutsche Forschungsgemeinschaft Grant NO 391/1-1. This work was also supported in part by National Institutes of Health Grant CA82258 (to B.J.M.).
Abbreviations
- SH2
Src homology 2
- PTyr
phosphotyrosine
- GST
glutathione S-transferase
- GSH-HRP
glutathione-conjugated horseradish peroxidase
- PDGFRβ
platelet-derived growth factor β receptor
- PI3-kinase
phosphatidylinositol 3-kinase
- PLC-γ
phospholipase C-γ
Footnotes
This paper was submitted directly (Track II) to the PNAS office.
References
- 1.Kolibaba K S, Druker B J. Biochim Biophys Acta. 1997;1333:F217–F248. doi: 10.1016/s0304-419x(97)00022-x. [DOI] [PubMed] [Google Scholar]
- 2.Porter A C, Vaillancourt R R. Oncogene. 1998;17:1343–1352. doi: 10.1038/sj.onc.1202171. [DOI] [PubMed] [Google Scholar]
- 3.Robertson S C, Tynan J, Donoghue D J. Trends Genet. 2000;16:368. doi: 10.1016/s0168-9525(00)02077-1. [DOI] [PubMed] [Google Scholar]
- 4.Pawson T, Nash P. Genes Dev. 2000;14:1027–1047. [PubMed] [Google Scholar]
- 5.Sudol M. Oncogene. 1998;17:1469–1474. doi: 10.1038/sj.onc.1202182. [DOI] [PubMed] [Google Scholar]
- 6.Hunter T. Cell. 2000;100:113–127. doi: 10.1016/s0092-8674(00)81688-8. [DOI] [PubMed] [Google Scholar]
- 7.Kuriyan J, Cowburn D. Annu Rev Biophys Biomol Struct. 1997;26:259–288. doi: 10.1146/annurev.biophys.26.1.259. [DOI] [PubMed] [Google Scholar]
- 8.Songyang Z, Shoelson S E, Chaudhuri M, Gish G, Pawson T, Haser W G, King F, Roberts T, Ratnofsky S, Lechleider R J, et al. Cell. 1993;72:767–778. doi: 10.1016/0092-8674(93)90404-e. [DOI] [PubMed] [Google Scholar]
- 9.Songyang Z, Shoelson S E, McGlade J, Olivier P, Pawson T, Bustelo X R, Barbacid H, Sabe H, Hanafusa H, Yi T, et al. Mol Cell Biol. 1994;14:2777–2785. doi: 10.1128/mcb.14.4.2777. [DOI] [PMC free article] [PubMed] [Google Scholar]
- 10.Ladbury J E, Lemmon M A, Zhou M, Green J, Botfield M C, Schlessinger J. Proc Natl Acad Sci USA. 1995;92:3199–3203. doi: 10.1073/pnas.92.8.3199. [DOI] [PMC free article] [PubMed] [Google Scholar]
- 11.Kuriu A, Ikeda H, Kanakura Y, Griffin J D, Druker B, Yagura H, Kitayama H, Ishikawa J, Nishiura T, Kanayama Y, et al. Blood. 1991;78:2834–2840. [PubMed] [Google Scholar]
- 12.Oda T, Heaney C, Hagopian J R, Okuda K, Griffin J D, Druker B J. J Biol Chem. 1994;269:22925–22928. [PubMed] [Google Scholar]
- 13.Godovac-Zimmermann J, Soskic V, Poznanovic S, Brianza F. Electrophoresis. 1999;20:952–961. doi: 10.1002/(SICI)1522-2683(19990101)20:4/5<952::AID-ELPS952>3.0.CO;2-A. [DOI] [PubMed] [Google Scholar]
- 14.Soskic V, Gorlach M, Poznanovic S, Boehmer F D, Godovac-Zimmermann J. Biochemistry. 1999;38:1757–1764. doi: 10.1021/bi982093r. [DOI] [PubMed] [Google Scholar]
- 15.Pandey A, Podtelejnikov A V, Blagoev B, Bustelo X R, Mann M, Lodish H F. Proc Natl Acad Sci USA. 2000;97:179–184. doi: 10.1073/pnas.97.1.179. [DOI] [PMC free article] [PubMed] [Google Scholar]
- 16.Mayer B J, Jackson P K, Baltimore D. Proc Natl Acad Sci USA. 1991;88:627–631. doi: 10.1073/pnas.88.2.627. [DOI] [PMC free article] [PubMed] [Google Scholar]
- 17.Mayer B J, Jackson P K, Van Etten R A, Baltimore D. Mol Cell Biol. 1992;12:609–618. doi: 10.1128/mcb.12.2.609. [DOI] [PMC free article] [PubMed] [Google Scholar]
- 18.Tanaka S, Morishita T, Hashimoto Y, Hattori S, Nakamura S, Shibuya M, Matuoka K, Takenawa T, Kurata T, Nagashima K, et al. Proc Natl Acad Sci USA. 1994;91:3443–3447. doi: 10.1073/pnas.91.8.3443. [DOI] [PMC free article] [PubMed] [Google Scholar]
- 19.Ploemen J H, van Ommen B, van Bladeren P J. Biochem Pharmacol. 1990;40:1631–1635. doi: 10.1016/0006-2952(90)90465-w. [DOI] [PubMed] [Google Scholar]
- 20.Heldin C H, Ostman A, Ronnstrand L. Biochim Biophys Acta. 1998;1378:F79–F113. doi: 10.1016/s0304-419x(98)00015-8. [DOI] [PubMed] [Google Scholar]
- 21.Kazlauskas A, Feng G S, Pawson T, Valius M. Proc Natl Acad Sci USA. 1993;90:6939–6943. doi: 10.1073/pnas.90.15.6939. [DOI] [PMC free article] [PubMed] [Google Scholar]
- 22.Jones S M, Klinghoffer R, Prestwich G D, Toker A, Kazlauskas A. Curr Biol. 1999;9:512–521. doi: 10.1016/s0960-9822(99)80235-8. [DOI] [PubMed] [Google Scholar]
- 23.Mayer B J, Baltimore D. Mol Cell Biol. 1994;14:2883–2894. doi: 10.1128/mcb.14.5.2883. [DOI] [PMC free article] [PubMed] [Google Scholar]
- 24.Duyster J, Baskaran R, Wang J Y J. Proc Natl Acad Sci USA. 1995;92:1555–1559. doi: 10.1073/pnas.92.5.1555. [DOI] [PMC free article] [PubMed] [Google Scholar]
- 25.Mayer B J, Hirai H, Sakai R. Curr Biol. 1995;5:296–305. doi: 10.1016/s0960-9822(95)00060-1. [DOI] [PubMed] [Google Scholar]
- 26.Pendergast A M, Quilliam L A, Cripe L D, Bassing C H, Dai Z, Li N, Batzer A, Rabun K M, Der C J, Schlessinger J, et al. Cell. 1993;75:175–185. [PubMed] [Google Scholar]
- 27.Puil L, Liu J, Gish G, Mbamalu G, Bowtell D, Pelicci P G, Arlinghaus R, Pawson T. EMBO J. 1994;13:764–773. doi: 10.1002/j.1460-2075.1994.tb06319.x. [DOI] [PMC free article] [PubMed] [Google Scholar]
- 28.Rohatgi R, Nollau P, Kirschner M W, Mayer B J. J Biol Chem. 2001;276:26448–26452. doi: 10.1074/jbc.M103856200. [DOI] [PubMed] [Google Scholar]
- 29.Golub T R, Slonim D K, Tamayo P, Huard C, Gaasenbeek M, Mesirov J P, Coller H, Loh M L, Downing J R, Caligiuri M A, et al. Science. 1999;286:531–537. doi: 10.1126/science.286.5439.531. [DOI] [PubMed] [Google Scholar]
- 30.Alizadeh A A, Eisen M B, Davis R E, Ma C, Lossos I S, Rosenwald A, Boldrick J C, Sabet H, Tran T, Yu X, et al. Nature (London) 2000;403:503–511. doi: 10.1038/35000501. [DOI] [PubMed] [Google Scholar]