

Abstract
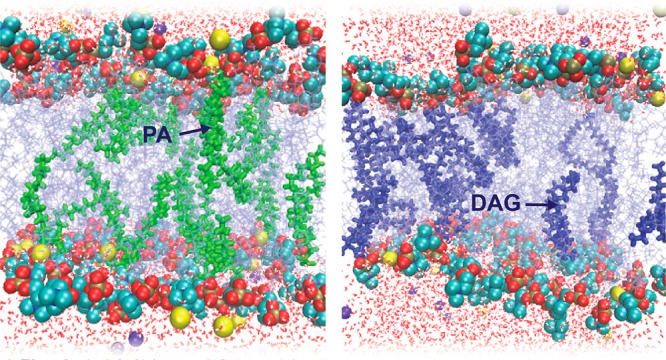
Understanding the origins of lipid membrane bilayer rearrangement in response to external stimuli is an essential component of cell biology and the bottom-up design of liposomes for biomedical applications. The enzymes phospholipase C and D (PLC and PLD) both cleave the phosphorus–oxygen bonds of phosphate esters in phosphatidylcholine (PC) lipids. The atomic position of this hydrolysis reaction has huge implications for the stability of PC-containing self-assembled structures, such as the cell wall and lipid-based vesicle drug delivery vectors. While PLC converts PC to diacylglycerol (DAG), the interaction of PC with PLD produces phosphatidic acid (PA). Here we present a combination of small-angle scattering data and all-atom molecular dynamics simulations, providing insights into the effects of atomic-scale reorganization on the supramolecular assembly of PC membrane bilayers upon enzyme-mediated incorporation of DAG or PA. We observed that PC liposomes completely disintegrate in the presence of PLC, as conversion of PC to DAG progresses. At lower concentrations, DAG molecules within fluid PC bilayers form hydrogen bonds with backbone carbonyl oxygens in neighboring PC molecules and burrow into the hydrophobic region. This leads initially to membrane thinning followed by a swelling of the lamellar phase with increased DAG. At higher DAG concentrations, localized membrane tension causes a change in lipid phase from lamellar to the hexagonal and micellar cubic phases. Molecular dynamics simulations show that this destabilization is also caused in part by the decreased ability of DAG-containing PC membranes to coordinate sodium ions. Conversely, PLD-treated PC liposomes remain stable up to extremely high conversions to PA. Here, the negatively charged PA headgroup attracts significant amounts of sodium ions from the bulk solution to the membrane surface, leading to a swelling of the coordinated water layer. These findings are a vital step toward a fundamental understanding of the degradation behavior of PC lipid membranes in the presence of these clinically relevant enzymes, and toward the rational design of diagnostic and drug delivery technologies for phospholipase-dysregulation-based diseases.
Short abstract
Phospholipase C activity destabilizes PC liposomes, ultimately leading to nonlamellar phases. Phospholipase D activity attracts cations to PC liposome membranes but does not affect their morphology.
Introduction
Liposomes are lipid-based, water-filled vesicles that have wide-ranging applications in drug delivery and health-care diagnostics, and can also be used as primitive cell models. Understanding their interactions with biologically relevant enzymes is therefore of significant interest from both a fundamental and an application-driven perspective. Here, we investigate the effect of two lipid-cleaving phospholipases (PL), phospholipase C and D (PLC and PLD), on PC-based liposomes. The PLCs and PLDs are two super families that hydrolyze the phosphorus–oxygen bonds in phospholipid head groups, producing diacylglycerol (DAG) and phosphatidic acid (PA), respectively. In the case of PLC and PLD action on 1-palmitoyl-2-oleoyl-sn-glycero-3-phosphocholine (POPC), the specific reaction products are 1-palmitoyl-2-oleoyl-sn-glycerol (POG, a member of the DAG family) and 1-palmitoyl-2-oleoyl-sn-glycero-3-phosphate (POPA, a member of the PA family) (Figure 1). While POG possesses only a neutral hydroxyl group in the headgroup, POPA contains a negatively charged phosphatidic acid headgroup at neutral pH. The physiological and pathological roles of PLC1 and PLD2,3 have been extensively studied, and both enzymes have been identified as important targets for treating several diseases including neurodegenerative disorders,2,4 cancers,2,5−7 immune disorders,7 and infectious diseases2 such as influenza.8
Figure 1.
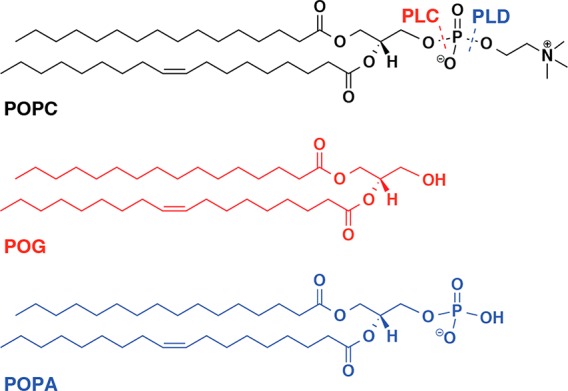
Structures of POPC and its phospholipase C and D reaction products. On reaction of a PC-based lipid with PLC, a diacylglycerol (DAG) is formed. In the specific case of POPC, this is 1-palmitoyl-2-oleoyl-sn-glycerol (POG, red). On reaction of a PC lipid with PLD, a phosphatidic acid (PA) is formed. In the specific case of POPC, this is 1-palmitoyl-2-oleoyl-sn-glycero-3-phosphate (POPA, blue).
All-atom molecular dynamics (MD) simulations have become an essential tool to gain molecular level understanding of lipid bilayer structure and dynamics. Researchers have used simulations to understand membrane defects,9,10 pore formation,10−12 ion effects,13,14 and membrane tension (curvature)15,16 on lipid bilayers. For example, the computational study of the DAG defect 1,2-dioleoyl-sn-glycerol (DOG) in 1,2-dioleoyl-sn-glycero-3-phosphocholine (DOPC)9 revealed an increase in thickness of the membrane bilayer hydrophobic region at 15 mol % DOG. This observation provides a useful comparison for other defect studies, including the one described herein. To the best of our knowledge, the effects of varying concentrations of POG and POPA defects in POPC lipid bilayers have not been previously studied theoretically. Here we aim to reveal the role that atomic-scale phospholipase-induced changes to membrane lipid composition play in the stability of fluid PC-based membranes and their supramolecular architectures.
When PLC and PLD act on lipid membrane bilayers, there is a change in the lipid composition. This can lead to alterations in the structural arrangement of lipids within such bilayers, affecting membrane stability, mobility of lipid species, membrane bilayer thickness, fluidity, flexibility, permeability, and domain formation. In the case of liposomes, this can also affect their overall morphology and stability. At room temperature, POPC membranes exist in a liquid disordered crystalline state and as such are capable of rapid lipid reorganization and domain formation. Phase diagrams of POG and POPC at different mole ratios illustrate that, below a critical POG ratio, there is a coexistence of domains consisting of mixtures of POG and POPC, and domains of pure POPC.17 Similarly, at 20 °C, doping Egg-DAG in Egg-PC (of which the primary lipid component is POPC) leads to the formation of two different lamellar phases above ca. 15% Egg-DAG and a hexagonal phase at ca. 23%.18 This can be attributed to the geometry of the lipid molecules; while PC exhibits a cylindrical geometry and favors a planar lamellar phase, DAG has a conical geometry that favors nonlamellar packing. This has implications for membrane stability when incorporated into lamellar lipid bilayers. For example, DOG preferentially forms a reversed liquid micellar phase, and at low concentrations (<20 mol %) in flat bilayers it induces packing defects that resemble those caused by positive curvature. This can encourage adsorption of proteins that use hydrophobic residues within the membrane as anchors.9 Compositions containing higher DOG mole ratios (generally >50%) mixed with Soy-PC give rise to complex mixtures of phases including 2D hexagonal and reversed micellar cubic, and are of interest as nonlamellar lipid nanoparticle drug delivery vectors.19 In mixtures of 1,2-dipalmitoyl-sn-glycerol (DPG), POPC, and cholesterol, it has been shown that the DPG acts in a similar manner to cholesterol, i.e., it increases chain order and bilayer thickness, reduces volume per lipid and lateral diffusion of lipids, and induces a strong condensing effect in PC bilayers.20 A recent single-concentration study of the diacylglycerols DPG, POG, and DOG in POPC membrane bilayers reported that this decrease in lateral diffusion of lipids is proportional to the level of DAG unsaturation.21
Here, we have employed a multi-length-scale investigation of the effect of changes in lipid composition and packing on vesicle stability. We experimentally probe the effect of these phospholipases on PC vesicles using small-angle neutron scattering (SANS) on PC liposomes, and small-angle X-ray scattering (SAXS) on bulk PC:DAG and PC:PA lipid mixtures. Specifically, we study the PC lipid POPC and the reaction products POG (the DAG formed upon POPC reaction with PLC) and POPA (the PA formed upon POPC reaction with PLD) (see Figure 1). While these techniques provide useful information about changes in membrane fluidity and liposome aggregation/degradation, they are bulk measurements and provide limited understanding of the origins of the structural change processes involved on the molecular scale. We therefore carried out all-atom simulations to investigate the effect of 10% and 50% conversion of PC to DAG or PA with respect to lipid clustering (a precursor to domain formation), membrane thickness, and curvature on the atomic level, and comment on the effects these may have on membrane bilayer stability. The flat membrane bilayer models used here provide an appropriate representation of the experimentally studied unilamellar vesicles (50 and 200 nm in diameter), since at these vesicle sizes one would expect the membrane bilayer to appear virtually flat within the length scales of the model. We show that the presence of enzyme reaction products in the membrane bilayer causes defect clustering, sodium cation coordination, and changes in bilayer thickness. As well as providing insights into lipid reorganization within the membrane bilayer on the atomic and molecular scale, the findings mark a vital step toward liposome-based diagnostic and drug delivery technologies for diseases where phospholipase dysregulation plays a role.
Results and Discussion
Enzyme-Induced Global Changes to PC Liposome Morphology and Membrane Thickness
In order to probe the global effects of PLC and PLD on PC liposomes, we performed time-resolved SANS experiments using 50 nm PC vesicles incubated with PLC or PLD. SANS is a highly useful technique for probing the nanoscale morphology of lipid ensembles. Fitted scattering data can provide information on nanoscale geometries, e.g., hollow and solid spherical, elliptical, and cylindrical structures and, in the case of hollow structures, the shell thickness. Here, we used it to study the enzyme-induced changes to membrane bilayer thickness and vesicle size and morphology.
SANS data, fitted using a custom model including uni- and bilamellar components as detailed in the SI (see Figure 2, Table 1 and Table S1), showed a steady decrease in membrane bilayer thickness of unilamellar vesicles incubated with PLC from 36 to 31 Å over 230 min. Thereafter, a sudden drop at 460 min to 18 Å was observed, equivalent to one leaflet of the membrane bilayer, which is indicative of disintegration of the unilamellar vesicles at this point. The bilamellar population is an artifact from the extrusion process during formulation,22 and also increases slightly in core radius, although the membrane bilayer thickness remains constant until 700 min incubation. We also observed that the proportion of bilamellar vesicles (Table 1 “bilamellar volume fraction”, and Table S1) increases slightly from 7.0% to 9.8% of the total particle population by volume.
Figure 2.

(A) Neutron scattering data of 50 nm POPC vesicles in the presence of 12.5 U/mL PLC before enzyme addition (0 min) and at 15, 120, 230, 460, and 700 min incubation (top to bottom). Points with errors are measured data, and lines are fitted models with uni- and bilamellar vesicle components. With increased time the overall scattering intensity drops, and the peak at Q = 0.08 Å–1 from bilamellar vesicle contributions becomes more prominent. (B) Neutron scattering data of 50 nm POPC vesicles in the presence of PLD before enzyme addition (0 min) and at 670 min incubation.
Table 1. Parametersa from Fitted Data Shown in Figure 2A.
| unilamellar
component |
bilamellar
component |
bilamellar volume fraction | ||||||
|---|---|---|---|---|---|---|---|---|
| time (min) | φ1 | rc1 | T1 | φ2 | rc2 | T2 | G | φ2/(φ1 + φ2) |
| 0 | 1.07 × 10⁻² | 583 | 36 | 8.06 × 10⁻⁴ | 230 | 36 | 25 | 7.02 × 10⁻² |
| 15 | 8.16 × 10⁻³ | 586 | 35 | 8.42 × 10⁻⁴ | 230 | 36 | 25 | 9.35 × 10⁻² |
| 120 | 7.09 × 10⁻³ | 1118 | 30 | 5.76 × 10⁻⁴ | 281 | 38 | 25 | 7.52 × 10⁻² |
| 230 | 4.39 × 10⁻³ | 980 | 31 | 3.63 × 10⁻⁴ | 310 | 37 | 25 | 7.65 × 10⁻² |
| 460 | 4.05 × 10⁻³ | 800 | 18 | 3.65 × 10⁻⁴ | 310 | 37 | 25 | 8.26 × 10⁻² |
| 700 | 2.05 × 10⁻³ | 700 | 19 | 2.23 × 10⁻⁴ | 323 | 45 | 25 | 9.82 × 10⁻² |
Here, φ is the volume fraction, rc is the core radius, T is the membrane bilayer thickness, and G is the thickness of the water gap between consecutive membrane bilayers. All lengths are in Å.
In the case of PLD, no change in membrane bilayer thickness or vesicle morphology was observed by SANS (see Figure 2) even after 670 min incubation. Here, the fitted SANS parameters for both the 0 and 670 min time points are the same and correspond to the 0 min fitted parameters presented in Table 1. This is in agreement with dynamic light scattering measurements (DLS, see Figure S1) of the same samples, collected after incubation with the enzymes. In the case of the PLD-incubated sample, the DLS trace remains unchanged even after 670 min enzyme incubation. However, after incubation with PLC, we observed the disappearance of the original vesicle peak centered around 90 nm and evolution of a highly polydisperse dispersion of scattering bodies ranging from 40 to 800 nm. These are most likely lipid aggregates of vesicle decomposition products formed during the enzymatic reaction. Further evidence of the presence of large scattering bodies is observed in the fitted SANS data. At low Q range (<6 × 10⁻³ Å–1) the SANS signal intensity is most sensitive to the total volume of lipid, so even when the longer-range model is not accurate, the SANS intensity should reflect the amount of interface present. We observe that the fitted model underestimates the intensity at low Q values, indicating that the total signal also comprises scattering from larger scattering bodies not accounted for in the model. Additionally, in the PLC sample, by 700 min incubation time the total scattering signal decreases by around a factor of 8, which is likely due to the lipid aggregate reaction products rising in the sample until they are out of the neutron beam. We observed this macroscopic separation by eye as a white band across the top of the sample cells.
Since the SANS measurements show that there is no observable change in liposome morphology and aggregation upon extended incubation with high amounts of PLD, it was necessary to qualify if the PLD was indeed active on membrane-immobilized PC lipids formulated into vesicles. This is nontrivial; many conventional assays for both PLD and PLC measure enzyme activity on fluorescent or radio-labeled free lipids in solution,23−26 while the readout mechanism of liposome-based activity assays relies on release of encapsulated contents or increased aggregation caused by a change in lipid phase behavior.27,28 It has been observed experimentally that incubating PC liposomes with PLC leads to release of encapsulated cargo;29 however incubation of PC liposomes with PLD leads to stable, asymmetric vesicles.30 To confirm enzyme activity on intact PC liposomes we used SPR, a highly sensitive technique that quantifies changes in mass of substrate immobilized on a functionalized gold chip, to measure the rate of detachment of PC liposomes from a Biacore L1 chip in the presence of PLD and PLC. After an initial lag period, we observed similar rates of detachment for both enzymes at 10 mU/mL activities (see Figure S2). For a thorough discussion of the results, see the Supporting Information. Raman spectroscopy of dried samples of liposomes incubated with PLC or PLD (see Figure S3) corroborated our findings. Specifically, we observed shifts of around 10 cm–1 on incubation with PLD in the peak around 1089 cm–1. This peak corresponds to the phosphate group which is the site of cleavage for the PLC and PLD (see Figure 1), and the shift is indicative of a change in its local chemical environment. We also studied the effect of PLD from two sources using SANS and saw identical results for both the PLD from Streptomyces chromofuscus (shown in Figure 2) and Arachis hypogaea (see Figure S4).
Lipid Clustering Is Driven by Hydrogen Bonds and Sodium Ion Coordination
To probe the molecular origins of the experimentally observed global changes, we performed all-atom MD simulations of lipid membrane bilayers with 10% and 50% conversion of PC to either DAG or PA. We observed hydrogen bond formation between the DAG terminal −OH and carbonyl oxygen of PC (Figure 3A) and the DAG terminal −OH and a phosphate oxygen of PC (Figure 3B), as well as with the terminal −OH of neighboring DAG molecules in 1:1 ratios of PC:DAG (Figure S5A). For phosphate and carbonyl oxygen positions, see Figure S5B.
Figure 3.

MD simulation snapshots of typical lipid complexes within the bilayer, illustrating hydrogen bond formation between (A) POG terminal −OH and POPC carbonyl oxygens, and (B) POG terminal −OH and POPC phosphate oxygens. Typical Na+ ion (yellow) coordination snapshots with (C) two POPC, one POPA, and two water molecules, and (D) one POPC, one POG, and three water molecules. Hydrogen bonds and ion coordination with atoms are explicitly shown with dotted lines. Atom colors are for oxygen (red), phosphorus (dark blue), carbon (light blue), and hydrogen (white, shown only in coordinating water molecules).
Although the SANS data showed no changes to vesicle structure in the presence of PLD, on the atomic level PA had an effect on lipid clustering and interactions with bulk ions. In the PC:PA system, the PA phosphate terminal −OH forms a hydrogen bond with the phosphate oxygen of PC, which facilitates coordination of two PA oxygens (one phosphate and one carbonyl) with a Na+ ion (Figure 3C). Two water molecules from the bulk solvent and phosphate oxygens from two neighboring PC molecules also take part in this ion coordination. This differs from ion coordination in PC (Figure S5C), where one Na+ ion coordinates with three water molecules and the phosphate oxygens in three PC molecules. It is worth mentioning that upon ion coordination PA acts like PC, in that it does not form any hydrogen bonds with neighbors in the PC:PA bilayer.
To understand the atomic interactions driving the events shown in Figure 3, we evaluated the distribution of interatomic separation distances using the radial distribution functions (RDFs) between possible hydrogen bond donor–acceptor pair atoms, in the case of hydrogen bonding and Na+ ion coordination (Figure 4A,B). The RDF between hydrogen bond donor–acceptor pairs is a common choice for comparative studies of the relative occurrence of specific interactions. In our study, the relative propensity for hydrogen bonding in the DAG system can be investigated by plotting the RDF of the DAG terminal oxygen with the carbonyl and phosphate oxygen of PC (Figure 4A). This shows that hydrogen bond formation is more favored for the phosphate oxygen (Figure 3B) compared to the carbonyl oxygen (Figure 3A). The RDF for the DAG carbonyl oxygen indicates a lower level of hydrogen bonding, likely since the DAG residue is required to penetrate deeper into the hydrophobic region (see Movie S1), which is energetically unfavorable and would impose tension in the bilayer.
Figure 4.
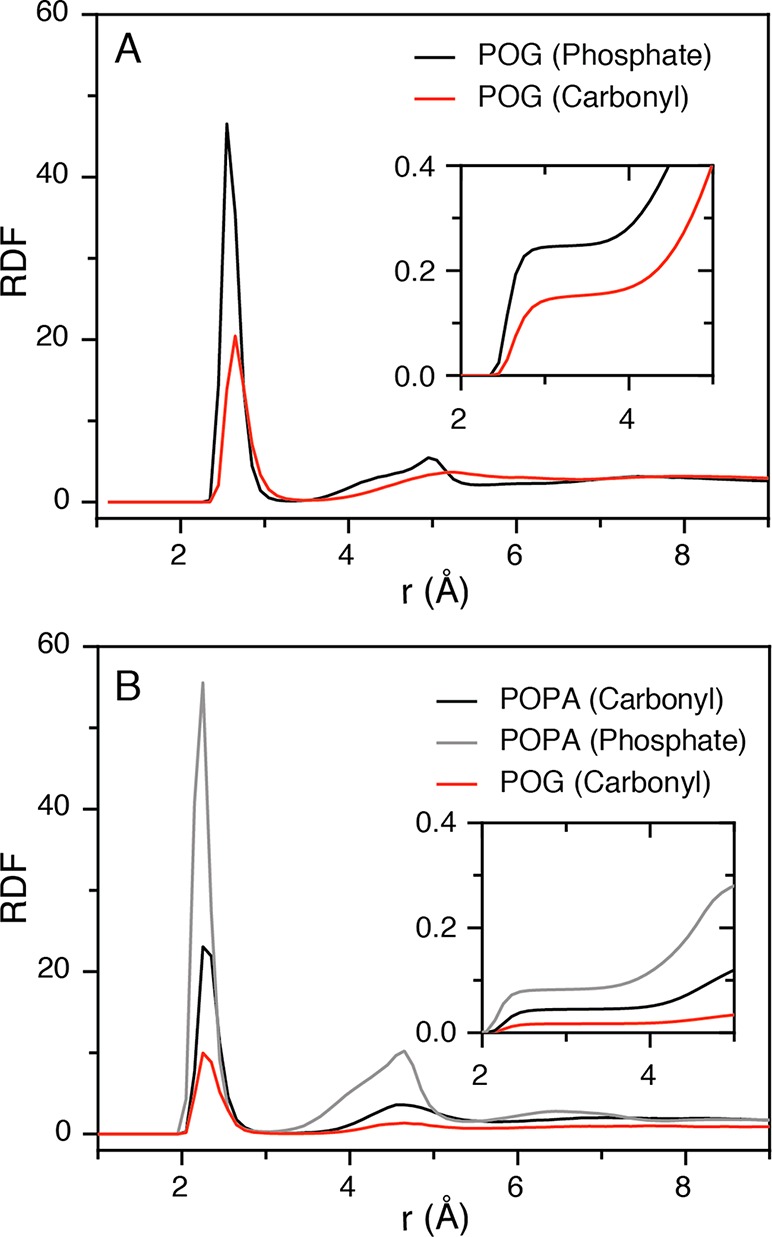
Radial distribution functions (RDFs) as determined by all-atom MD simulations. (A) RDFs between POG terminal oxygen and phosphate oxygen of POPC (black), and carbonyl oxygen of POPC (red). (B) RDFs for POG and POPA molecules bound to a Na+ ion in a POPC bilayer; specifically a Na+ ion bound to carbonyl oxygens of POG (red trace), carbonyl oxygens of POPA (black trace), and phosphate oxygens of POPA (gray trace). The cumulative sums are depicted in insets.
The RDF for Na+ ion coordination with phosphate and carbonyl oxygen in the PC:PA (9:1) system (Figure 4B) indicates that coordination with the PA phosphate group is more likely (gray peak in Figure 4B). Since a Na+ ion needs to coordinate six oxygen atoms for full hydration, two water molecules can be expected to complete the coordination complex when Na+ coordinates four oxygen atoms from the lipid carbonyl groups.31 It can be suggested that the Na+ ion coordinates with phosphate oxygen in coordination events mediated by three or two water molecules (Figure 3C and Figure S5C). In the presence of hydrogen bonds between PA and neighboring PC molecules, the carbonyl oxygen of PC also contributes to completing the Na+ hydration complex (see Figure 3C). We also observed a peak for Na+ ions coordinating with the carbonyl oxygen of DAG–PC clusters (represented in Figure 3D). The RDF peak is relatively small (red peak in Figure 4B) because only the DAGs that penetrate deeply into the hydrophobic region of the bilayer are contributing to the ion coordination.
Role of DAG and PA in Membrane Thickness
Penetration of DAG molecules into PC bilayers has been reported for several lipid mixtures, where it is commonly shown to lead to an increase in bilayer organization and thickness.9,17,21,32 In MD simulations of 10% DAG and 10% PA systems, we observed no significant change in the overall bilayer thickness (∼39.2 Å) over the course of a 200 ns simulation, although there is 0.3 Å higher fluctuation in the DAG system (Figure S6). This is comparable with SANS experiments, which showed the PC bilayer thickness to be 36 Å at time t = 0 (Table 1). The simulations have no capacity to fully reproduce the “real time” bilayer thickness changes; however we did observe DAG penetrating into the bilayer within the simulation time frame of 200 ns, which may be indicative of the initial stages of a rapid transformation. PC:DAG interactions (see Figure 3) did not generally occur simultaneously in both leaflets, and their stability was very short-lived. In regions where several PC:DAG interactions did occur in both leaflets simultaneously, we observed bilayer thinning (Figure 5A,B) by around ∼2.5 Å. In SAXS studies of bulk mixtures of PC and 10 mol % DAG, we also observed a decrease in lattice parameter of around 2 Å compared to pure PC, with the lipids packed into a single lamellar phase. This could explain the observed decrease in membrane bilayer thickness observed in SANS for PC vesicles incubated with PLC, before their eventual disintegration on increased conversion of PC to DAG.
Figure 5.

Distance between average centers of mass of tail carbon atoms in the two membrane leaflets (ΔZ) plotted in 10 ns blocks for bilayer components POPC, POG, and POPA: (A) ΔZ for PC:DAG (9:1), where POPC and POG are represented in red and black circles, respectively; (C) ΔZ for PC:PA (9:1), where POPC and POPA are represented in red and black circles, respectively. Z = 0 corresponds to midpoint of two leaflets. Pictorial representations of PC lipid bilayers: (B) bilayer with 10% POG (bold blue) and (D) bilayer with 10% POPA (bold green). Sodium and chloride ions are represented in yellow and violet, respectively. Water molecules are represented by red lines.
To quantify fluctuations in the degree of lipid penetration into the bilayer, we plotted the ΔZ of PC, DAG, and PA components of PC and 10 mol % DAG (Figure 5A), or PC and 10 mol % PA (Figure 5C) systems in 10 ns blocks. Here, ΔZ is the distance between the average centers of mass of the tail carbon atoms for lipids in each membrane leaflet, where decreased ΔZ implies membrane bilayer thinning. In both the 10% DAG and 10% PA systems, the PC ΔZ fluctuated at around ∼19 Å. ΔZ values shown in Figure 5A demonstrate that, at 10 mol %, the DAG residues penetrate approximately 2.5 Å into the PC bilayer. This rearrangement imposes a tail mismatch between the two leaflets (Figure S5D) leading to regions of bilayer thinning (Figure 5B), and is proposed as the most probable membrane bilayer breakdown mechanism. However, the PA position in the PC:PA system remains unchanged in relation to the remaining 90 mol % of PC lipids (Figure 5C). Here, bilayer preservation is due in part to the Na+ ion coordination with both PC and negatively charged PA as discussed previously, which explains why no instability was observed in this bilayer (Figure 5D). The differences in lipid packing between the two systems are in agreement with the differences in vesicle stability that we observed experimentally in SANS and SAXS.
Impact of Increasing Percentage of DAG and PA on PC Bilayer Stability
Whereas PC membranes with negatively charged phosphate residues (i.e., PA) attract Na+ ions from the bulk solution to the bilayer via charge interactions, DAG contains no charged species at neutral pH, so increased DAG concentration is proportional to a reduction in interactions between Na+ ions and the membrane bilayer. We corroborated the effect that this has on membrane bilayer stability, as observed in MD simulations and SANS, with SAXS studies of bulk lipid mixtures of PC and either DAG or PA, hydrated in either PBS or water (see Figure S7 for spectra). It is important to note that in the previously discussed SANS data we consider the thickness of the lipid bilayer only, whereas in the SAXS data we measure the lipid bilayer plus lipid-coordinated water layer that resides between each of the lipid lamellae. Additionally, SANS samples were measured with buffers prepared in a D2O:H2O (9:1) solvent system whereas SAXS was carried out in buffers prepared in H2O. In PBS at 25 °C, pure PC exhibited lamellar packing as expected, with a 63.81 ± 0.03 Å lattice parameter. The 10% DAG in PC composition, hydrated in PBS, was also lamellar with a 61.82 ± 0.04 Å lattice parameter. The 50% DAG composition however was a biphasic mixture of a swollen lamellar phase with a 70.16 ± 0.06 Å lattice parameter and a more tightly packed hexagonal phase with a 67.62 ± 0.02 Å lattice parameter. This change in thickness agrees with our MD simulation observations; unlike at 10% DAG, in PC membranes with 50% DAG in the bilayer we do not observe any tail mismatch, and the average carbon–carbon distance of DAG between two leaflets increases by 4.3 Å when its concentration increases from 10% to 50% (Table 2). However, large-scale lipid reorganization and evolution, of, e.g., a hexagonal phase, was not observed in MD simulations since this happens over time scales greater than 200 ns. Thickening of the hydrophobic region of the membrane bilayer has been previously reported in a computational study of 15 mol % DOG defect in DOPC, where its penetration into the membrane led to a thickening effect on the hydrophobic portion of the bilayer.9 Above concentrations of 20 mol %, the authors also observed the formation of an inverse hexagonal phase. This thickening effect has also been observed for other PC:DAG mixtures in both gel and fluid phase lipid systems.9,17,21,32 For example, addition of 50 mol % DPG to 1,2-dipalmitoyl-sn-glycero-3-phosphocholine (DPPC) has been shown using SANS and XRD to increase the membrane bilayer thickness by ∼4–8 Å. This is due to DPG forcing the gel phase DPPC lipid tails from a 36° to 0° angle from the bilayer normal.32 Here, however, in the PC fluid phase we observed an initial thinning of the membrane bilayer in both MD and SAXS experiments at low DAG concentration, before thickening is observed with increased DAG concentrations. Both MD simulations (Table 2) and SAXS patterns show an increase in lamellar spacing upon increased DAG concentration from 10 to 50 mol %. Interestingly, SAXS also shows that there is an evolution of an inverse hexagonal phase with a smaller lattice parameter at 50 mol % DAG.9,32 Since SANS only gives an average thickness, it is possible that the membrane thinning we observe with this technique is the average of the overall vesicle membrane thickness including the swollen lamellar and smaller hexagonal phases. Another explanation is that the decreased lattice parameter at 10 mol % DAG could correspond to the lipid composition of vesicles measured with SANS, above which DAG concentration the vesicles are not stable or form aggregates and rise out of the SANS neutron beam so are not measured.
Table 2. Hydrocarbon Thickness of 10 and 50 mol % POG or POPA in a POPC Membrane Bilayer, Determined by the Position of the Tail’s 1st Carbon Atom in All-Atom MD Simulations.
| hydrocarbon
thickness (Å) |
||
|---|---|---|
| lipid | 10% | 50% |
| POG | 30.6 ± 1.2 | 34.9 ± 0.8 |
| POPA | 32.5 ± 1.4 | 36.4 ± 1.0 |
At a 1:9 mole ratio of PC:DAG, an Fd3m micellar phase was observed by SAXS with a 132.55 ± 0.05 Å lattice parameter. Furthermore, we observed macroscopic separation between the lipid and aqueous phases during preparation of this sample for SAXS. The inverse micellar Fd3m cubic phase has also been reported previously in mixtures of DOPC:DOG at mole ratios of 1:2 in 60 wt % water.33 The observed decrease in membrane bilayer thickness in SANS is therefore most likely caused by phase separation above a critical concentration of DAG and the formation of the hexagonal and subsequent Fd3m phases. These phase transitions are likely responsible for the destabilization and degradation of the liposome constructs as a whole in the presence of PLC.
SAXS data (see Figure S7) supports the SANS observation of a stable lipid bilayer (Figure 2 and Table 1) even at high conversion of PC to PA. While MD simulations show a 3.9 Å increase in the PA hydrocarbon thickness from 10% to 50% PA (Table 2), SANS shows no overall increase in liposome membrane bilayer thickness from its initial value of 36 Å. Swelling is however observed experimentally in SAXS measurements, where the increase in the lattice parameter includes both the membrane thickness and the coordinated water layer between lamellae of bulk lipid mixtures. At 25 °C, PC films hydrated in water formed a lamellar phase with a lattice parameter of 63.05 ± 0.30 Å. In PC:PA films hydrated in water the lattice parameter increased to 88.23 ± 0.16 Å for a 1:1 ratio of PC:PA and 95.01 ± 0.03 Å in the case of a 1:9 ratio. In both cases the lamellar packing was maintained. Increasing lattice parameters with increasing charged lipid in the membrane have been well documented previously and attributed to an increase in the excess water point and therefore water layer associated with the membrane.34 Interestingly, all PC:PA lipid films hydrated with PBS were not fully hydrated, even at 80% mass ratio of PBS to lipid. This corroborates our earlier observations in MD simulations of high sodium ion affinity with the PA headgroup, and previous reports in the literature of incomplete hydration of highly charged lipids.
Conclusions
We have uncovered the role of PLC- and PLD-mediated defects in fluid PC membrane bilayers on the atomistic level. MD simulations provide an explanation for the mechanisms behind bulk observations in small-angle scattering experiments. In DAG-containing PC membrane bilayers, DAG penetration into the PC hydrophobic tails, as observed in MD simulations, creates tension within the bilayer and the subsequent tail mismatch between two leaflets. Interestingly, we observed a membrane thinning at low DAG concentrations before a thickening at higher concentrations. This destabilization of lamellar lipid packing causes large-scale lipid rearrangement and phase changes with the evolution of a hexagonal phase and Fd3m phase at higher DAG concentrations, as observed experimentally in SAXS measurements of bulk lipid mixtures. This leads to liposome breakdown, seen experimentally in SANS studies of liposomes in the presence of PLC. MD simulations show that this membrane destabilization is caused by the formation of hydrogen bonds between DAG terminal −OH groups and PC phosphate oxygens that leads to a penetration of DAG molecules into the PC bilayer. After an initial thinning of the lamellar lattice parameter, there is an increase in the thickness of the lamellar phase. This agrees with previous MD and experimental observations of similar DAG–PC lipid mixtures in both gel and fluid phase lipid membranes. The decreased ability of DAG-containing PC membrane bilayers to coordinate sodium ions also contributes to instability. Conversely, PA-containing PC membrane bilayers remain stable up to extremely high conversions to PA (90%), and attract significantly more sodium ions to the membrane surface leading to an increase in the coordinated water layer.
These findings are essential for the bottom-up design of sensitive liposome-based systems for therapy and diagnosis of PLC- and PLD-dysregulating diseases, which rely on enzyme-mediated liposome rupture leading to release of an encapsulated cargo. The stability of PC liposomes in the presence of PLD-mediated defects, even up to very high conversion to PA, suggests these liposomes are not suitable for therapy and diagnosis of PLD-dysregulating conditions in this context. However, the complete disintegration of PC liposomes in the presence of PLC-mediated defects indicates that they are promising candidates for diagnosing and treating PLC-dysregulating conditions.
Acknowledgments
M.N.H. acknowledges support from the FP7 Marie Curie Intra-European Fellowship “SMase LIPOSOME” (626766). This research is published with the support of the Swiss National Science Foundation (P300PA_171540 and 406240_147493). I.Y. and M.M.S. acknowledge the Australian Research Council Discovery Grants DP140101888 and DP170100511. This research was undertaken with the assistance of resources from the Australian National Computational Infrastructure (NCI) and Victorian Life Sciences Computation Initiative (VLSCI). M.R.T., M.N.H., and M.M.S. acknowledge support from the i-sense Engineering and Physical Sciences Research Council (EPSRC) IRC in Early Warning Sensing Systems for Infectious Diseases (EP/K031953/1; www.i-sense.org.uk). M.M.S. also acknowledges the EPSRC Grant “Bio-functionalised nanomaterials for ultrasensitive biosensing” (EP/K020641/1) and ERC Seventh Framework Programme Consolidator Grant “Naturale CG” (616417). H.M.G.B. acknowledges support from the H2020 through the Individual Marie Skłodowska-Curie Fellowship “SmartCubes” (703666). Experiments at the ISIS Neutron and Muon Source were supported by a beamtime allocation from the Science and Technology Facilities Council (RB1510557). This work benefited from the use of the SasView application, originally developed under NSF award DMR-0520547. SasView contains code developed with funding from the European Union’s Horizon 2020 research and innovation programme under the SINE2020 project, grant agreement 654000. We acknowledge Diamond Light Source for provision of synchrotron beamtime (SM 14792) and we would like to thank Dr. Andy Smith for assistance using beamline I22.
Supporting Information Available
The Supporting Information is available free of charge on the ACS Publications website at DOI: 10.1021/acscentsci.8b00286.
Materials and methods, additional analysis of SANS data and all-atom molecular dynamics simulations, SPR and Raman data to support enzyme activity, and DLS and SAXS data (PDF)
POG head group −OH forms a hydrogen bond with the carbonyl oxygen of POPC in POPC:POG (9:1) bilayers; only heavy atoms of a POG and a POPC molecule are shown (MPG)
Raw research data for experimental work is available at DOI: 10.5281/zenodo.1310679. Raw data for MD simulation are available upon reasonable request from Irene Yarovsky (irene.yarovsky@rmit.edu.au).
The authors declare no competing financial interest.
Supplementary Material
References
- Cocco L.; et al. Phosphoinositide-specific phospholipase C in health and disease. J. Lipid Res. 2015, 56, 1853. 10.1194/jlr.R057984. [DOI] [PMC free article] [PubMed] [Google Scholar]
- Brown H. A.; et al. Targeting phospholipase D in cancer, infection and neurodegenerative disorders. Nat. Rev. Drug Discovery 2017, 16, 351. 10.1038/nrd.2016.252. [DOI] [PMC free article] [PubMed] [Google Scholar]
- Peng X.; et al. Mammalian phospholipase D physiological and pathological roles. Acta Physiol. 2012, 204, 219. 10.1111/j.1748-1716.2011.02298.x. [DOI] [PMC free article] [PubMed] [Google Scholar]
- Yang Y. R.; et al. Primary phospholipase C and brain disorders. Adv. Biol. Regul. 2016, 61, 80. 10.1016/j.jbior.2015.11.003. [DOI] [PubMed] [Google Scholar]
- Bruntz R. C.; et al. Phospholipase D Signaling Pathways and Phosphatidic Acid as Therapeutic Targets in Cancer. Pharmacol. Rev. 2014, 66, 1033. 10.1124/pr.114.009217. [DOI] [PMC free article] [PubMed] [Google Scholar]
- Yamada Y.; et al. Association of a polymorphism of the phospholipase D-2 gene with the prevalence of colorectal cancer. J. Mol. Med. 2003, 81, 126. 10.1007/s00109-002-0411-x. [DOI] [PubMed] [Google Scholar]
- Koss H.; et al. Dysfunction of phospholipase C gamma in immune disorders and cancer. Trends Biochem. Sci. 2014, 39, 603. 10.1016/j.tibs.2014.09.004. [DOI] [PubMed] [Google Scholar]
- O’Reilly M. C.; et al. Discovery of a Highly Selective PLD2 Inhibitor (ML395): A New Probe with Improved Physiochemical Properties and Broad-Spectrum Antiviral Activity against Influenza Strains. ChemMedChem 2014, 9, 2633. 10.1002/cmdc.201402333. [DOI] [PMC free article] [PubMed] [Google Scholar]
- Vamparys L.; et al. Conical lipids in flat bilayers induce packing defects similar to that induced by positive curvature. Biophys. J. 2013, 104, 585. 10.1016/j.bpj.2012.11.3836. [DOI] [PMC free article] [PubMed] [Google Scholar]
- Nishizawa M.; et al. Molecular dynamics simulation analysis of membrane defects and pore propensity of hemifusion diaphragms. Biophys. J. 2013, 104, 1038. 10.1016/j.bpj.2013.01.022. [DOI] [PMC free article] [PubMed] [Google Scholar]
- Hu Y.; et al. Investigating hydrophilic pores in model lipid bilayers using molecular simulations: Correlating bilayer properties with pore-formation thermodynamics. Langmuir 2015, 31, 6615. 10.1021/la504049q. [DOI] [PMC free article] [PubMed] [Google Scholar]
- Bennett W F D.; et al. Atomistic simulations of pore formation and closure in lipid bilayers. Biophys. J. 2014, 106, 210. 10.1016/j.bpj.2013.11.4486. [DOI] [PMC free article] [PubMed] [Google Scholar]
- Martín-Molina A.; et al. Effect of calcium and magnesium on phosphatidylserine membranes: Experiments and all-atomic simulations. Biophys. J. 2012, 102, 2095. 10.1016/j.bpj.2012.03.009. [DOI] [PMC free article] [PubMed] [Google Scholar]
- Böckmann R. A.; et al. Effect of sodium chloride on a lipid bilayer. Biophys. J. 2003, 85, 1647. 10.1016/S0006-3495(03)74594-9. [DOI] [PMC free article] [PubMed] [Google Scholar]
- Reddy A. S.; et al. Effect of membrane tension on the physical properties of DOPC lipid bilayer membrane. Biochim. Biophys. Acta, Biomembr. 2012, 1818, 2271. 10.1016/j.bbamem.2012.05.006. [DOI] [PMC free article] [PubMed] [Google Scholar]
- Gardner J. M.; et al. Effect of intrinsic curvature and edge tension on the stability of binary mixed-membrane three-junctions. J. Chem. Phys. 2016, 145, 074901. 10.1063/1.4960433. [DOI] [PubMed] [Google Scholar]
- Jiménez-Monreal A. M.; et al. The phase behavior of aqueous dispersions of unsaturated mixtures of diacylglycerols and phospholipids. Biochim. Biophys. Acta, Biomembr. 1998, 1373, 209. 10.1016/S0005-2736(98)00106-0. [DOI] [PubMed] [Google Scholar]
- Das S.; et al. Modification by diacylglycerol of the structure and interaction of various phospholipid-bilayer membranes. Biochemistry 1986, 25, 2882. 10.1021/bi00358a022. [DOI] [PubMed] [Google Scholar]
- Tiberg F.; et al. Phase behavior, functions, and medical applications of soy phosphatidylcholine and diglyceride lipid compositions. Chem. Lett. 2012, 41, 1090. 10.1246/cl.2012.1090. [DOI] [Google Scholar]
- Alwarawrah M.; et al. Modification of lipid bilayer structure by diacylglycerol: A comparative study of diacylglycerol and cholesterol. J. Chem. Theory Comput. 2012, 8, 749. 10.1021/ct200790q. [DOI] [PMC free article] [PubMed] [Google Scholar]
- Alwarawrah M.; et al. Alteration of lipid membrane structure and dynamics by diacylglycerols with unsaturated chains. Biochim. Biophys. Acta, Biomembr. 2016, 1858, 253. 10.1016/j.bbamem.2015.11.014. [DOI] [PubMed] [Google Scholar]
- Schmiedel H.; et al. Multilamellarity, structure and hydration of extruded POPC vesicles by SANS. Eur. Biophys. J. 2006, 35, 181. 10.1007/s00249-005-0015-9. [DOI] [PubMed] [Google Scholar]
- Rose T. M.; et al. Synthesis and evaluation of fluorogenic substrates for phospholipase D and phospholipase C. Org. Lett. 2006, 8, 2575. 10.1021/ol060773d. [DOI] [PMC free article] [PubMed] [Google Scholar]
- Murakami C.; et al. Development of a liquid chromatography-mass spectrometry based enzyme activity assay for phosphatidylcholine-specific phospholipase C. Anal. Biochem. 2017, 526, 43. 10.1016/j.ab.2017.03.010. [DOI] [PubMed] [Google Scholar]
- Liu Y.; et al. Phosphorothiolate analogues of phosphatidylinositos as assay substrates for phospholipase C. ChemBioChem 2007, 8, 1430. 10.1002/cbic.200700061. [DOI] [PubMed] [Google Scholar]
- Caramelo J. J.; et al. A subnanogram assay for phospholipase activity based on a long-chain radioiodinatable phosphatidylcholine. Anal. Biochem. 2004, 333, 289. 10.1016/j.ab.2004.05.028. [DOI] [PubMed] [Google Scholar]
- Torley L.; et al. A turbidometric assay for phospholipase-C and sphingomyelinase. Anal. Biochem. 1994, 222, 461. 10.1006/abio.1994.1517. [DOI] [PubMed] [Google Scholar]
- Ichikawa S.; et al. Phospholipase D-mediated aggregation, fusion, and precipitation of phospholipid vesicles. Langmuir 2004, 20, 941. 10.1021/la030357r. [DOI] [PubMed] [Google Scholar]
- Lim S. J.; et al. Homogeneous liposome immunoassay for insulin using phospholipase C from Clostridium perfringens. Anal. Biochem. 1997, 247, 89. 10.1006/abio.1997.2050. [DOI] [PubMed] [Google Scholar]
- Jing Y. J.; et al. Heat-activated liposome targeting to streptavidin-coated surfaces. Biochim. Biophys. Acta, Biomembr. 2015, 1848, 1417. 10.1016/j.bbamem.2015.02.022. [DOI] [PubMed] [Google Scholar]
- Timko J.; et al. Dissociation of NaCl in water from ab initio molecular dynamics simulations. J. Chem. Phys. 2010, 132, 114510. 10.1063/1.3360310. [DOI] [PubMed] [Google Scholar]
- Takahashi H.; et al. Structural characterization of phosphatidylcholine-diacylglycerol system by neutron scattering and X-ray diffraction. Appl. Phys. A: Mater. Sci. Process. 2002, 74, S1251. 10.1007/s003390101214. [DOI] [Google Scholar]
- Tyler A. I. I.; et al. Hydrostatic pressure effects on a hydrated lipid inverse micellar Fd3m cubic phase. Phys. Chem. Chem. Phys. 2011, 13, 3033. 10.1039/C0CP01783C. [DOI] [PubMed] [Google Scholar]
- Hauser H. Some aspects of the phase behaviour of charged lipids. Biochim. Biophys. Acta, Biomembr. 1984, 772, 37. 10.1016/0005-2736(84)90515-7. [DOI] [Google Scholar]
Associated Data
This section collects any data citations, data availability statements, or supplementary materials included in this article.