

Abstract
Background
To assess the correlation between salivary glucose and blood glucose levels in diabetics and non diabetics and to study the association between salivary glucose levels and oral candidal carriage in patients with Type 2 diabetes mellitus.
Material and method
The study sample was divided into two groups, control and study group. The study group was again divided into two separate groups controlled diabetics and uncontrolled diabetics. Blood and saliva samples (for fasting and postprandial) were taken from each individual.
Results
The salivary glucose levels, highly correlated with blood glucose levels in both diabetic as well as non diabetics subjects. Salivary candidal carriage was more in oral cavity of Type 2 diabetic subjects than control subjects.
Conclusion
Saliva has the potential to be used as a noninvasive tool to monitor glycemic status of diabetic patients.
Keywords: Non diabetics (ND), Controlled diabetics (CD), Uncontrolled diabetics (UD), Fasting blood glucose level (FBG), SGL (Salivary glucose level)
1. Introduction
Diabetes mellitus (DM) is a complex multi-systemic metabolic disorder characterized by a relative or absolute insufficiency of insulin secretion and/or concomitant resistance to metabolic action of insulin on target tissues.1 Type 2 diabetes is a global, the International Diabetes Federation (IDF) states that diabetes has affected at least 382 million people worldwide in 2013, which is estimated to rise to 592 million by 2035.2, 3 Fungal infections of oral mucosal surfaces and removable prostheses are more commonly found in diabetics and higher salivary glucose concentration may be associated with increased oral candidal carriage in diabetics.4 It is becoming increasingly apparent to investigators and clinicians that saliva has many diagnostic uses and is valuable in the young, the old and infirm, and in large-scale screening and epidemiological studies.5 Salivary glucose concentrations may also be used as a non invasive tool to monitor glycemic control in diabetics.4 The aim of this study was to assess the correlation between blood glucose levels and salivary glucose levels in order to determine if salivary glucose levels could be used as a noninvasive tool for monitoring glycemic status in diabetics and also to explore the correlation between salivary glucose levels and oral candidal carriage.
2. Material and methods
The study was conducted at the Department of Oral Pathology & Microbiology and Department of General Pathology & Microbiology of our college. Consent was obtained from every individual participating in study and the study was approved by ethical committee of the institution. The subjects were divided into 3 groups – Sashikumar and Kannan.5
Group 1 (control group, n = 34) – non diabetics (ND)
Group 2 (study group, n = 97) – diabetics.
Group 2 was further sub-divided into two sub-groups:
Group 2a (N = 49) – controlled diabetics (CD)
Group 2b (N = 48) – uncontrolled diabetics (UD)
The inclusion criteria for non-diabetics (ND) were that only those subjects with no history of diabetes and with fasting blood glucose levels <120 mg/dl and post prandial blood glucose levels <200 mg/dl, measured at least twice in last 6 months (including current measurements) were considered along with those who had reported for voluntary routine blood examination as a part of routine medical checkup. For controlled diabetics (CD), only those subjects were considered with a history of diabetes and currently undergoing treatment, with fasting blood glucose levels <120 mg/dl and post prandial blood glucose levels <200 mg/d, measured at least twice in last 6 months (including current measurements). Secondly, the subjects who reported for voluntary blood examination as a part of routine checkup/prescribed by a physician. For uncontrolled diabetics (UD) subjects with a history of diabetes and currently undergoing treatment, with fasting blood glucose levels >120 mg/dl or post prandial blood glucose levels >200 mg/dl measured at least twice in last 6 months (including current measurements) and subjects who reported for voluntary blood examination as a part of routine medical checkup/prescribed by a physician. The exclusion criteria were patients with any kind of tobacco habits, patients suffering from any salivary gland disorders, patients having a history of/or undergoing chemotherapy or radiotherapy, patients with history of any chronic systemic diseases or undergoing long term medication for chronic conditions other than diabetes mellitus, patient currently on any antibiotic medication or having a history of use of any such medications in past 3 months, patients wearing any type of orthodontic appliance or removable dental prosthesis (Fig. 1, Fig. 2, Fig. 3, Fig. 4, Fig. 5, Fig. 6).
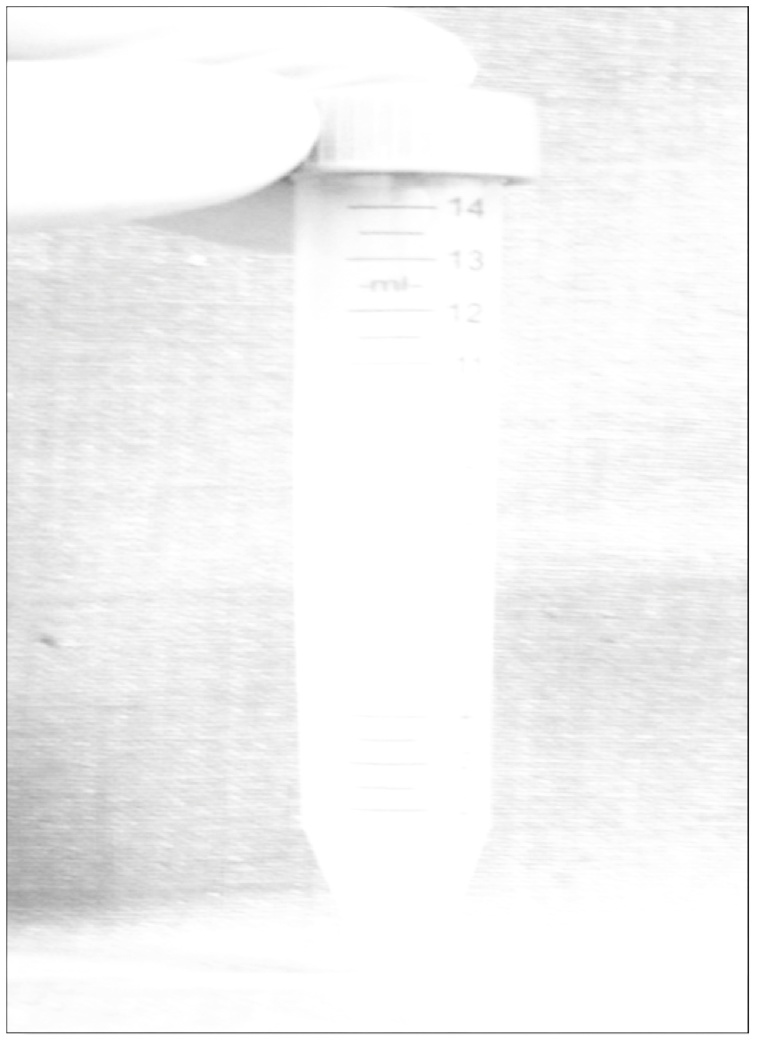
Fig. 1.

Salivary rinse collected in a sterile sample collection container (approx. 10 ml).
Fig. 2.
Salivary sample after centrifuge.
Fig. 3.

Streaking of sample using a sterile inoculation loop.
Fig. 4.

Candidal colonies on culture plates.
Fig. 5.

Counting of Colonies Forming Units using point tool of Image J 1.48v software.
Fig. 6.

Photomicrograph showing PAS positive candidal spores, some showing budding (PAS stain X 400).
3. Assessment of glucose levels
3.1. Collection of samples
-
(1)
Blood: Under aseptic conditions, 2 ml of patient's intravenous blood was obtained from median cubital vein of forearm into a blood collection tube (Bio In Vitro Diagnostics Pvt. Ltd., Gujarat) containing sodium fluoride and EDTA.
-
(2)
Saliva: Two salivary samples were collected from each subject for assessment of SGL. Fasting samples were collected in the morning (between 8 AM–10 AM) after an overnight fasting of at least 8 h. Post prandial samples were taken in between 1.5 h and 2 h after meal. Unstimulated salivary samples were collected in all instances.
3.2. Method of collection of salivary sample
Approximately 2 ml of unstimulated whole saliva was collected from each subjects in a sterile graduated tube by spitting method as proposed by Navazesh et al.,5 over a period of 5 min. Saliva was collected in resting position between 8.00 AM and 10.30 AM after rinsing with distilled water into a blood collection tube (Bio In Vitro Diagnostics Pvt. Ltd., Gujarat) containing sodium fluoride and EDTA (Ethylenediamenetetraacetic acid). Subjects were asked to sit on a chair with head tilted forward and instructed not to speak, swallow, or do any head movements during the procedure. Subjects were instructed to accumulate the saliva in the floor of the mouth and then spit in a sterile collection tube every minute for five minutes. The collected sample was processed immediately with a time lag of no more than 30 min.
3.3. Analysis of samples for glucose estimation
Blood: The blood sample was centrifuged at 2000 rpm for 2 min and supernatant was decanted. The serum thus obtained was analyzed for glucose levels. Serum glucose was assayed by Glucose Oxidase Peroxidase method using a semi-autoanalyser (Microlab 300, Merck & Co. Inc., USA). 10 μl of serum sample was added with 500 μl of glucose reagent (Accurex Biomedical Pvt. Ltd., Mumbai) and incubated for 15 min at 37 °C. The samples were the fed to semi autoanalyser for analysis. The values were expressed as mg/dl.
Salivary sample: The salivary samples were also centrifuged at 2000 rpm for 2 min and were decanted. The supernatant thus obtained was analyzed for glucose levels. Salivary glucose was assayed by Glucose Oxidase Peroxidase method using the same semi-autoanalyser (Microlab 300, Merck & Co. Inc, USA). 10 μl of salivary sample was added with 500 μl of glucose reagent (Accurex Biomedical Pvt. Ltd., Mumbai) and incubated for 15 min at 37 °C. Then the samples were fed to semi autoanalyser for analysis. The values were expressed as mg/dl.
3.4. Assessment of salivary candidal carriage
3.4.1. Collection of sample
The sample for oral candidal carriage was collected before the sample for salivary glucose estimation. Early morning (between 8 AM – 10 AM) saliva samples were collected using oral rinse technique. The subjects were asked to rinse oral cavity using 10 ml (approximately) of sterile phosphate buffered saline solution (0.1 M – 7.4pH) for 60 s. The expectorate was collected in a sterile sample container (LASANY, ILW 8453, Haryana, India). Then 10 ml of expectorant was transferred into a sterile graduated eppendorf tube (Tarson's 15 ml graduated centrifuge tube, radiation sterilized, cat no. 546020) and stored at 4 °C in a refrigerator for brief time till transport to the Microbiology Laboratory.
3.4.2. Estimation of salivary candidal carriage
Preparation of culture plates – 65 g of the medium (Sabouraud's Dextrose Agar supplemented with chloramphenicol; Hi Media, MM 1067-500G) was suspended in one liter of distilled water and mixed well, dissolved by heating with frequent agitation and boiled for one minute until complete dissolution occurred. After dissolution the whole suspension was sterilized in autoclave at 118–121 °C for 20 min at 15 psi. Over heating was avoided as it facilitates the hydrolysis of the components and the medium remains soft. The color of the plate was amber, slightly opalescent as supposed to be.
3.4.3. Processing of sample and inoculation
Salivary samples were centrifuged at 5000 rpm for 10 min. The supernatant was discarded and 50 μl distil water was added to the sample and mixed thoroughly. 50 μl of this mixture was taken using a micropipette (Perfect Product, Lucknow) and added as drops onto the culture plates. The sample was spread onto the plates using a sterile platinum inoculating loop using zig-zag motion and incubated at 37 °C for a period of 72 h for growth. After 72 h the culture plates were examined for growth. The colonies appeared as white to cream colored, smooth, glabrous and yeast-like in appearance. The presence of Candida was confirmed by colony characteristics on SDA, and Periodic Acid Schiff (PAS) staining on smears prepared from samples taken from cultured colonies. Microscopic morphology showed spherical to sub spherical budding yeast cells or blastoconidia. The colonies were counted manually (mouse driven method) using image analysis software (Image J 1.48v, Wayne Rasband, National institutes of Health, USA.) and the values were expressed as CFU/ml (colony forming units/ml).
3.5. Statistics
The Chi-square test was done in all three groups along with, post hoc analysis for intergroup comparison and one-way ANOVA between diabetic, non diabetic patient. p < 0.001 was considered statistically significant.
4. Results
The mean FBG levels in ND, CD, and UD were 92.51, 96.62 and 170.76 respectively. The mean PPBG levels were highest in UD 266.40 mg/dl followed by CD 142.63 and ND 137.15 (Graph 1).
Graph 1.

Comparison of blood glucose (Bg) levels (fasting and post parandial) in study groups (Nd, Cd, and Ud).
When compared using the one way ANOVA test the differences in both (Fasting and Post prandial) blood glucose levels were found to be statistically significant (p < 0.001) (Table 1).
Table 1.
One way ANOVA test for comparison of blood glucose levels in the three groups.
| Groups | N | Mean | Std. deviation | Statistics/mean squares | df2 (welch)/F (Anova) | p Value | |
|---|---|---|---|---|---|---|---|
| PPBG levels | ND | 34 | 137.15 | 20.24 | 85.09 | 81.27 | <0.001 |
| CD | 49 | 142.63 | 25.87 | ||||
| UD | 48 | 266.40 | 64.90 | ||||
| Total | 131 | 186.56 | 74.791 | ||||
| FBG levels | ND | 34 | 92.51 | 17.33 | 63.69 | 79.66 | <0.001 |
| CD | 49 | 96.62 | 18.67 | ||||
| UD | 48 | 170.76 | 44.55 | ||||
| Total | 131 | 122.72 | 47.65 | ||||
In pair wise comparison using Post Hoc Tukey Test the BG levels of both Fasting and Post Parandial in UD were found to be significantly higher than ND and CD (p < 0.001) but the difference between ND and CD was not statistically significant (Table 2).
Table 2.
Post Hoc Tukey Test for inter-group comparison of blood glucose levels.
| Dependent variable | (I) Group | (J) Group | Mean difference (I − J) | p Value |
|---|---|---|---|---|
| FBG levels | ND | CD | −4.11 | 0.819 |
| UD | −78.25 | <0.001 | ||
| CD | UD | −74.13 | <0.001 | |
| PPBG levels | ND | CD | −5.48 | 0.84 |
| UD | −129.24 | <0.001 | ||
| CD | UD | −123.76 | <0.001 | |
UD group had the highest mean FSG levels 15.21 mg/dl when compared to CD 9.14 mg/dl and ND 7.18 mg/dl. The mean PPSG levels were highest in UD (21.831 mg/dl followed by CD 12.379 mg/dl and ND 10.731 mg/dl (Graph 2).
Graph 2.

Comparison of salivary glucose (Sg) levels (fasting and post parandial) among study groups (Nd, Cd, and Ud).
ANOVA test revealed that the differences in both (Fasting and Post prandial) salivary glucose levels were statistically significant (p < 0.001) (Table 3).
Table 3.
One way ANOVA test for comparison of salivary glucose levels in the three groups.
| Groups | N | Mean | Std. deviation | Statistics/mean squares | df2 (welch)/F (Anova) | p Value | |
|---|---|---|---|---|---|---|---|
| FSG levels | ND | 34 | 7.18 | 1.97 | 62.73 | 81.57 | <0.001 |
| CD | 49 | 9.14 | 2.27 | ||||
| UD | 48 | 15.21 | 4.36 | ||||
| Total | 131 | 10.85 | 4.63 | ||||
| PPSG levels | ND | 34 | 10.73 | 2.21 | 165.91 | 85.20 | <0.001 |
| CD | 49 | 12.37 | 3.38 | ||||
| UD | 48 | 21.83 | 3.43 | ||||
| Total | 131 | 15.41 | 5.84 | ||||
Post Hoc Tukey Test for intergroup comparison of the SG (Fasting and Post prandial) levels showed that SG levels in ND were significantly lower in ND as compared to CD and UD. The differences between CD and UD were also statistically significant (p < 0.001) (Table 4).
Table 4.
Post Hoc Tukey Test for inter-group comparison of salivary glucose levels.
| Dependent variable | (I) Group | (J) Group | Mean difference (I − J) | p Value |
|---|---|---|---|---|
| FSG levels | ND | CD | −1.96 | 0.017 |
| UD | −8.03 | <0.001 | ||
| CD | UD | −6.07 | <0.001 | |
| PPSG levels | ND | CD | −1.648 | 0.053 |
| UD | −11.09 | <0.001 | ||
| CD | UD | −9.45 | <0.001 | |
In order to assess whether a correlation exists between Salivary Glucose and Blood Glucose, the values obtained for all the subjects in the study group, irrespective of the subgroup, were compared using the Pearson's correlation test (Fasting Glucose levels: R2 = 0.887, p < 0.001), (Post Parandial Glucose Levels: R2 = 0.894, p < 0.001) (Table 5). A very good positive and liner correlation was seen between the SG levels and BG levels in the study subjects which was statistically significant (Graph 3, Graph 4).
Table 5.
Correlations of salivary glucose levels and blood glucose levels.
| FSG levels | Pearson correlation | .887** | .820** | 1 | |
| Sig. (2-tailed) | .000 | .000 | |||
| R2 | 0.787 | ||||
| N | 131 | 131 | 131 | ||
| PPSG levels | Pearson correlation | .804** | .894** | .785** | 1 |
| Sig. (2-tailed) | .000 | .000 | .000 | ||
| R2 | .799 | ||||
| N | 131 | 131 | 131 | 131 | |
Graph 3.

Correlation between fasting salivary glucose levels and fasting blood glucose levels.
Graph 4.

Correlation between post prandial salivary glucose levels and post prandial blood glucose levels.
The mean salivary candidal carriage in ND, CD, and UD were 1187.64 ± 3417.77 CFU/ml (0–19,840 CFU/ml), 3988.16 ± 4746.38 CFU/ml (140–19,520 CFU/ml) and 5329.58 ± 4103.26 CFU/ml (0–19,600 CFU/ml) respectively (Graph 5).
Graph 5.

Showing CFU in nondiabetics, controlled diabetics and uncontrolled diabetic patients.
In order to assess whether a correlation exists between Salivary Glucose and Colony Forming Units/ml, the values obtained for all the subjects in the study group, irrespective of the subgroup, were compared using the Pearson's correlation test.
A poor correlation was seen between FSG levels and CFU/ml in the study subjects which was statistically significant (R2 = 0.091, p < 0.001) (Table 6).
Table 6.
Correlation between salivary glucose levels with colony forming units/ml in study samples.
| FSG | PPSG | CFU/ml | ||
|---|---|---|---|---|
| CFU/ml | Pearson correlation | .301** | .262** | 1 |
| Sig. (2-tailed) | .000 | .003 | ||
| R2 | .091 | .069 | ||
| p | <0.001 | <0.001 | ||
| N | 131 | 131 |
Similarly, a statistically significant but poor correlation was seen between the PPSG levels and CFU/ml units in the study subjects (R2 = 0.069, p < 0.005).
5. Discussions
It is becoming increasingly apparent to investigators and clinicians in a variety of disciplines that saliva has many diagnostic uses and is especially valuable in the young, the old and infirm, and in large-scale screening and epidemiological studies. Diabetes mellitus is a syndrome of abnormal carbohydrate, fat and protein metabolism that results in acute and chronic complications due to the absolute or relative lack of insulin.6 Oral candidiasis is an opportunistic infection of the oral cavity. It is common, often under diagnosed, among the elderly, particularly in those who wear dentures, and in many cases is avoidable with a good mouth care regimen.7 Oral candidiasis is caused by an overgrowth or infection of the oral cavity by a yeast-like fungus, candida.8 Fungal infections of oral mucosal surfaces and removable prostheses are more commonly found in diabetics4 and higher salivary glucose concentration may be associated with increased oral candidal carriage in diabetics.5 This study was designed to evaluate the possibility of utilizing salivary glucose levels as a tool for assessing glycemic status of the patient and to study the relationship between salivary glucose levels and oral candidal carriage in diabetics.
Our results showed that glucose was consistently isolated from salivary samples of non diabetics as well as diabetics (Graph 1). Presence of glucose in saliva has previously been demonstrated in various studies though the results were variable.9, 10, 11 While some authors have found glucose in both non diabetics as well as diabetics5, 12, 13, 14 others were able to demonstrate glucose in the only in diabetics.5
In addition to the molecules synthesized in the salivary glands, saliva also contains molecules that are present in blood. Depending on their size and charge, some molecules enter into saliva via diffusion, filtration, and/or active transportation.15 Presence of glucose in saliva has been attributed to the small molecular size which permits movement from vascular compartment to the salivary duct during passage of salivary secretion through the ductal system.16
Several pathways, both intra and extracellular, enable molecules to be transported from blood to saliva. Biomolecules enter saliva by either passive diffusion, active transport via ligand-receptor binding, or ultrafiltration.15 The most common route for substances to migrate from blood to saliva is via unaided or passive diffusion. The ability of a molecule to diffuse passively through cell membranes depends partly on its size, the electrical charge that it carries, and degree of ionization. Small lipophilic unionized molecules are ideal to diffuse through cell membranes. Molecules having molecular masses upto 400 g/mol and pKa values above 8.5 can pass through cell membranes.17 Glucose is ideal in both these respects with molecular masses of 180.16 g/mol and pKa value of 12.28 and hence would easily diffuse through cell membranes.
In our study all the diabetic subjects had elevated salivary glucose levels in comparison to the non diabetic subjects. Even among the diabetics glucose levels were significantly higher in the UDs as compared to CDs which is in accordance with previous studies which have shown increased salivary glucose in diabetics9, 10, 11, 18 although the concentration of glucose varies considerably in different studies.5, 9, 10, 18 This may be due to the variability in methods of collection and processing of salivary samples for analysis.
We collected saliva in a sterile container containing sodium fluoride which has been shown to stabilize glucose by preventing glycolysis.19 Also the samples were processed and analyzed almost immediately following the collection to prevent any time delay. This was done to counter act the effect of salivary microorganisms and temperature over salivary glucose molecule.
Increased glucose content in saliva of diabetic patients has been linked to many theories. It has been shown that salivary glucose levels correlate negatively with the salivary flow rate.11, 20 Insulin deficiency has been shown to cause degenerative changes in salivary glands of animals.21, 22, 23
Persistent hyperglycemia may lead to microvascular changes in the blood vessels, as well as basement membrane alteration in the salivary glands and could be another cause of increased salivary glucose.24, 25 Hyperglycemia causes leaky microvasculature and basement membrane, which leads to increased leakage of glucose from the ductal cells of the salivary gland, thereby increasing the glucose content in saliva. Thus, large amounts of glucose become available in saliva when blood glucose levels are elevated, as in diabetes.9 Another source of glucose in a sample taken from whole saliva is from the gingival crevicular fluid (GCF). Since GCF is thought to be a capillary filtrate and is derived directly from blood,26 molecules like glucose can easily pass into the gingival crevice.
In our study we also found higher salivary glucose levels even in diabetics with good glycemic control (CDs) as compared to non diabetics (NDs) even though there were no significant differences in blood glucose concentrations (Table 6). These findings are in accordance to those of Sashikumar and Kannan,5 Panchbhai et al.,18 and Kumar et al.27 The possible reason for this could be that although structural changes in glandular tissue are reversible with insulin therapy a complete restoration of glandular structure may not take place even after glycemic control (Caldeira et al.).21
We found that both fasting and post prandial salivary glucose levels correlated significantly with corresponding serum glucose levels. These findings are in concordance with those of Amer et al.,28 Sreedevi et al.,10 Abikshyeet et al.9
The frequent occurrence of Candida infections in patients with diabetes mellitus has been recognized for many years and oral candidiasis in particular is thought to be more prevalent among these individuals.29, 30, 31, 32
We found a high percentage of candidal carriage in diabetic as well as non diabetic individuals. This is possibly because our study sample was derived from a population attending a dental hospital and hence may have higher prevalence of factors (oral hygiene,33 dental caries,14 periodontitis,34 amalgam restoration,33 fixed or removable orthodontic and prosthetic appliances,30 as well as habits like smoking35) encouraging candidal colonization.
For the purpose of clinical relevance, quantitative evaluation of the culture was done and number of colony forming units (CFU) was evaluated. We found a high degree of intra-group variation and inter-group overlap in candidal CFU counts among the study groups, in accordance with Lamey et al.,36 Sashikumar and Kannan5 and Bremenkamp et al.37
Various authors have shown higher candidal CFU counts in diabetics and various reasons have been attributed for this finding. One of the factors which are thought to be responsible for increased candidal colonization in diabetics is the decreased salivary flow rate.38, 39, 40, 41 Others have proposed increased candidal adhesion to epithelial cells of diabetic patients,42 increased salivary glucose levels in diabetics43, 44 and defects in candidacidal activity of neutrophils, particularly in the presence of glucose.45
We found a statistically significant poor correlation between salivary glucose levels and candidal CFUs even though the candidal carriage was higher in diabetics. This is in accordance Lamey et al.36 and Fisher et al.30
Thus candidal carriage, colonization, and pathogenicity appear to be a complex process involving a number of inter-dependent as well as independent factors. Salivary glucose may only be one of these multiple factors affecting candidal growth in oral cavity. This could explain the poor correlation between salivary glucose levels and candidal CFU counts obtained in our study.
Hence it may be concluded from the results of the study that salivary glucose levels are significantly elevated in diabetics as compared to non diabetics and strongly correlated with levels of blood glycemia. Thus salivary glucose estimation has a potential to be used as a marker for monitoring glycemic status of the patient.
We also conclude that although diabetes is associated with increased oral candidal carriage, the association between salivary glucose levels and candidal carriage may be weak due to multifactorial nature of oral candidal colonization.
6. Conclusion
To summarize, the present study was conducted with aim and objectives to assess the correlation between salivary glucose and blood glucose levels in diabetics and non diabetics and to study the association between salivary glucose levels and oral candidal carriage in patients with Type 2 diabetes mellitus. The salivary glucose levels, highly correlated with blood glucose levels in both diabetic as well as non diabetics subjects. Salivary candidal carriage was more in oral cavity of Type 2 diabetic subjects than control subjects. Higher candidal CFU counts showed a poor correlation with salivary glucose levels. From our study we can conclude that saliva has the potential to be used as a noninvasive tool to monitor glycemic status of diabetic patients. Although there is higher candidal colonization in diabetics the relationship between candidal carriage and salivary glucose is still uncertain. Further studies with larger sample size and well defined patient cohorts are required to concord or refute these findings.
Conflicts of interest
The authors have none to declare.
Contributor Information
Amritaksha Bhattacharyya, Email: dramritakshabhattacharyya@gmail.com.
Shaleen Chandra, Email: shal_nam@hotmail.com.
Anil Singh, Email: dranilsingh@yahoo.com.
Vineet Raj, Email: veneetraj@gmail.com.
Bhavana Gupta, Email: drbhavanagupta@gmail.com.
References
- 1.Marjani A. Effect of storage time and temperature on some serum analytes. Internet J Lab Med. 2006;(2):2. [Google Scholar]
- 2.Aguirre F., Dahlquist G., Dodd T., Soltész G. 6th ed. International Diabetes Federation; 2013. IDF Diabetes Atlas: www.idf.org/diabetesatlas. [Google Scholar]
- 3.Joshi S.R., Parikh R.M. India: the diabetes capital of the world: now heading towards hypertension. J-Assoc Physicians India. 2007;55:323. [PubMed] [Google Scholar]
- 4.Guggenheimer J., Moore P.A., Rossie K. Insulin-dependent diabetes mellitus and oral soft tissue pathologies, part II: prevalence and characteristics of Candida and candidal lesions. Oral Surg Oral Med Oral Pathol Oral Radiol Endod. 2000;89:570–576. doi: 10.1067/moe.2000.104477. [DOI] [PubMed] [Google Scholar]
- 5.Sashikumar R., Kannan R. Salivary glucose levels and oral candidal carriage in type II diabetics. Oral Surg Oral Med Oral Pathol Oral Radiol Endod. 2010;109(5):706–711. doi: 10.1016/j.tripleo.2009.12.042. [DOI] [PubMed] [Google Scholar]
- 6.Ship J.A. Diabetes and oral health. J Am Dent Assoc. 2003;134(1):4S–10S. doi: 10.14219/jada.archive.2003.0367. [DOI] [PubMed] [Google Scholar]
- 7.Gravina H.G., de Morán E.G., Zambrano O. Oral Candidiasis in children and adolescents with cancer. Identification of Candida spp. Med Oral Patol Oral Cir Bucal. 2007;(12):419–423. [PubMed] [Google Scholar]
- 8.Akpan A., Morgan R. Oral candidiasis – review. Postgrad Med J. 2002;78:455–459. doi: 10.1136/pmj.78.922.455. [DOI] [PMC free article] [PubMed] [Google Scholar]
- 9.Abikshyeet P., Ramesh V., Oza N. Glucose estimation in the salivary secretion of diabetes mellitus patients. Diabetes Metab Syndr Obes: Targets Ther. 2012;5:149–154. doi: 10.2147/DMSO.S32112. [DOI] [PMC free article] [PubMed] [Google Scholar]
- 10.Shashikanth M.C., Shambulingappa P. Comparison of serum glucose and salivary glucose in diabetic patients. J Indian Acad Oral Med Radiol. 2008;20:9–13. [Google Scholar]
- 11.Vasoconcelos C.A.U., Soares M.S.M., Almeida P.C., Soares T.C. Comparitive study of salivary and blood glucosa in Type 2 diabetic patients. J Oral Sci. 2010;52:293–298. doi: 10.2334/josnusd.52.293. [DOI] [PubMed] [Google Scholar]
- 12.Ben-Aryeh H., Cohen M., Kanter Y., Szargel R., Laufer D. Salivary composition in diabetic patients. J Diabet Complic. 1988;2(2):96–99. doi: 10.1016/0891-6632(88)90011-6. [DOI] [PubMed] [Google Scholar]
- 13.Lopez M.E., Maria C., Paez R.G., Schallmach J.N., Koss M.A., Chervonagura A. Salivary characteristics of diabetic children. Braz Dent J. 2003;14(1):26–31. doi: 10.1590/s0103-64402003000100005. [DOI] [PubMed] [Google Scholar]
- 14.Srivastava B., Bhatia H.P., Chaudhary V., Aggarwal A., Singh A.K., Gupta N. Comparative evaluation of oral Candida albicans carriage in children with and without dental caries: a microbiological in vivo study. Int J Clin Pediatr Dent. 2012;5(2):108–112. doi: 10.5005/jp-journals-10005-1146. [DOI] [PMC free article] [PubMed] [Google Scholar]
- 15.Pfaffe T., Cooper-White J., Beyerlein P., Kostner K., Punyadeera C. Diagnostic potential of saliva: current state and future applications. Clin Chem. 2011;57(5):675–687. doi: 10.1373/clinchem.2010.153767. [DOI] [PubMed] [Google Scholar]
- 16.Belazi M.A., Galli-Tsinopoulou A., Drakoulakos D., Fleva A., Papanayiotou P.H. Salivary alterations in insulin-dependent diabetes mellitus. Int J Paediatr Dent. 1998;8:29–33. doi: 10.1046/j.1365-263x.1998.00057.x. [DOI] [PubMed] [Google Scholar]
- 17.Haeckel R., Hanecke P. Application of saliva for drug monitoring: an in vivo model for transmembrane transport. Eur J Clin Chem Clin Biochem. 1996;34:171–191. [PubMed] [Google Scholar]
- 18.Panchbhai A.S., Degwekar S.S., Bhowte R.R. Estimation of salivary glucose, salivary amylase, salivary total protein and salivary flow rate in diabetics in India. J Oral Sci. 2010;52(3):359–368. doi: 10.2334/josnusd.52.359. [DOI] [PubMed] [Google Scholar]
- 19.Chan A.Y.W., Swamlnathan A., Cockram C.S. Effectiveness of sodium fluoride as a preservative of glucose in blood. Clin Chem. 1989;35(2):315–317. [PubMed] [Google Scholar]
- 20.Karjalainen K.M., Knuuttila M.L., Kaar M.L. Salivary factors in children and adolescents with insulin-dependent diabetes mellitus. Paediatr Dent. 1996;18(4):306–311. [PubMed] [Google Scholar]
- 21.Caldeira E.J., Camilli J., Cagnon V.H.A. Stereology and ultrastructure of the salivary glands of diabetic nod mice submitted to long-term insulin treatment. Anat Rec Part A. 2005;286a:930–937. doi: 10.1002/ar.a.20236. [DOI] [PubMed] [Google Scholar]
- 22.Hand A.R., Weiss R.E. Effects of streptozotocin-induced diabetes on the rat parotid gland. Lab Investig. 1984;51(4):429–440. [PubMed] [Google Scholar]
- 23.Take G., Ilgaz C., Erdogan D., Ozugul C., Elmas C.A. comparative study of the ultrastructure of submandibular, parotid and exocrine pancrease in diabetes and fasting. Saudi Med J. 2007;28(1):28–35. [PubMed] [Google Scholar]
- 24.Harrison R., Bowen W.H. Flow rate and organic constituents of whole saliva in insulin-dependent diabetic children and adolescents. Pediatr Dent. 1987;9(4):287–292. [PubMed] [Google Scholar]
- 25.Qureshi A., Qureshi A., Qureshi H., Khan A.A. Blood glucose level, salivary pH and oral bacterial count in type 1 diabetic children. Infect Dis J. 2007;16(2):45–48. [Google Scholar]
- 26.Griffith G.S. Formation, collection and significance of gingival crevice fluid. Periodontology. 2000 2003;31:32–42. doi: 10.1034/j.1600-0757.2003.03103.x. [DOI] [PubMed] [Google Scholar]
- 27.Kumar S., Padmashree S., Jayalekshmi R. .Correlation of salivary glucose, blood glucose and oral candidal carriage in the saliva of Type 2 diabetics: a case-control study. Contemp Clin Dent. 2014;5(3):311–314. doi: 10.4103/0976-237X.137925. [DOI] [PMC free article] [PubMed] [Google Scholar]
- 28.Amer S., Yousuf A.M., Siddiqui P.Q., Alam J. Salivary glucose concentrations in patients with diabetes mellitus – a minimally invasive technique for monitoring blood glucose levels. Pak J Pharm Sci. 2001;14(1):33–37. [PubMed] [Google Scholar]
- 29.Bartholomew G.A. Oral Candidiasis in patients with diabetes mellitus: a thorough analysis. Diabetes Care. 1987;10:607–612. doi: 10.2337/diacare.10.5.607. [DOI] [PubMed] [Google Scholar]
- 30.Fisher B.M., Lamey P.-J., Samaranayake L.P., Macfarlane T.W. Carriage of Candida species in the oral cavity in diabetic patients: relationship to glycemic control. J Oral Pathol. 1987;16:282–284. doi: 10.1111/j.1600-0714.1987.tb01494.x. [DOI] [PubMed] [Google Scholar]
- 31.Kumar B.V., Padshety N.S. Prevalence of Candida in the oral cavity of diabetic subjects. J-Assoc Physicians India. 2005;53:599–602. [PubMed] [Google Scholar]
- 32.Tapper-Jones L.M., Aldred M.J., Walker D.M., Hayes T.M. Candidal infections and populations of Candida albicans in mouths of diabetics. J Clin Pathol. 1981;34(7):706–711. doi: 10.1136/jcp.34.7.706. [DOI] [PMC free article] [PubMed] [Google Scholar]
- 33.Muzurovic S., Babajic E., Masic T., Smajic R., Selmanagic A. The relationship between oral hygiene and oral colonisation with Candida species. Med Arh. 2012;66(6):415–417. doi: 10.5455/medarh.2012.66.415-417. [DOI] [PubMed] [Google Scholar]
- 34.Canabarro A., Valle C., Farias M.R., Santos F.B., Lazera M., Wanke B. Association of subgingival colonization of Candida albicans and other yeasts with severity of chronic periodontitis. J Periodontal Res. 2013;48(4):428–432. doi: 10.1111/jre.12022. [DOI] [PubMed] [Google Scholar]
- 35.Soysa N.S., Shillitoe E.J. Effects of smoking on oral Candidosis: an overview. Oral Dis. 2005;11:268–273. doi: 10.1111/j.1601-0825.2005.01115.x. [DOI] [PubMed] [Google Scholar]
- 36.Lamey P.-J., Darwazeh A.M.G., Fisher B.M., Samaranayake L.P., MacFarlane T.W., Frier B.M. Secretor status, candidal carriage and candidal infection in patients with diabetes mellitus. J Oral Pathol. 1988;17:354–357. doi: 10.1111/j.1600-0714.1988.tb01549.x. [DOI] [PubMed] [Google Scholar]
- 37.Bremenkamp R.M.A.R., Caris A.O.C., Jorge G.N. Prevalence and antifungal resistance profile of Candida spp. oral isolates from patients with type 1 and 2 diabetes mellitus. Arch Oral Biol. 2011;56(6):549–555. doi: 10.1016/j.archoralbio.2010.11.018. [DOI] [PubMed] [Google Scholar]
- 38.Orellana M.F., Lagravère M.O., Boychuk D., Major P.W., Flores-Mir C., Ortho C. Prevalence of xerostomia in population-based samples: a systematic review. J Public Health Dent. 2006;66(2):152–158. doi: 10.1111/j.1752-7325.2006.tb02572.x. [DOI] [PubMed] [Google Scholar]
- 39.Rao P.K. Oral Candidiasis – a review. Sch J Med. 2012;2(2):26–30. [Google Scholar]
- 40.Suárez B.L., Álvarez M.I., de Bernal M., Collazos A. Candida species and other yeasts in the oral cavities of Type 2 diabetic patients in Cali, Colombia. Colomb Méd. 2013;44(1):26. [PMC free article] [PubMed] [Google Scholar]
- 41.Turner M.D., Ship J.A. Dry mouth and its effects on the oral health of elderly people. J Am Dent Assoc. 2007;138(suppl 1):15–20. doi: 10.14219/jada.archive.2007.0358. [DOI] [PubMed] [Google Scholar]
- 42.Naik R., Ahmed Mujib B.R., Raaju U.R., Telagi N. Assessing oral candidal carriage with mixed salivary glucose levels as non-invasive diagnostic tool in type-2 diabetics of Davangere, Karnataka, India. J Clin Diagn Res. 2014;8(7):69–73. doi: 10.7860/JCDR/2014/8761.4628. [DOI] [PMC free article] [PubMed] [Google Scholar]
- 43.Basson N.J. Competition for glucose between Candida albicans and oral bacteria grown in mixed culture in a chemostat. J Med Microbiol. 2000;49(11):969–975. doi: 10.1099/0022-1317-49-11-969. [DOI] [PubMed] [Google Scholar]
- 44.Sabina J., Brown V. Glucose sensing network in Candida albicans: a sweet spot for fungal morphogenesis. Eukaryot Cell. 2009;8(9):1314–1320. doi: 10.1128/EC.00138-09. [DOI] [PMC free article] [PubMed] [Google Scholar]
- 45.Wilson R.M., Reeves W.G. Neutrophil phagocytosis and killing in insulin-dependent diabetes. Clin Exp Immunol. 1986;63:478–484. [PMC free article] [PubMed] [Google Scholar]