Abstract
As breakthrough cellular therapy discoveries are translated into reliable, commercializable applications, effective stem cell biomanufacturing requires systematically developing and optimizing bioprocess design and operation. This article proposes a rigorous computational framework for stem cell biomanufacturing under uncertainty. Our mathematical tool kit incorporates: high‐fidelity modeling, single variate and multivariate sensitivity analysis, global topological superstructure optimization, and robust optimization. The advantages of the proposed bioprocess optimization framework using, as a case study, a dual hollow fiber bioreactor producing red blood cells from progenitor cells were quantitatively demonstrated. The optimization phase reduces the cost by a factor of 4, and the price of insuring process performance against uncertainty is approximately 15% over the nominal optimal solution. Mathematical modeling and optimization can guide decision making; the possible commercial impact of this cellular therapy using the disruptive technology paradigm was quantitatively evaluated. © 2017 American Institute of Chemical Engineers AIChE J, 64: 3011–3022, 2018
Keywords: red blood cell production, bioreactor design under uncertainty, bioprocess optimization under uncertainty, robust optimization, stem cell biomanufacturing
Introduction
Biomanufacturing process engineering is now at a stage where we can consider systematic production of cell therapies.1, 2, 3, 4, 5, 6, 7 But stem cell biomanufacturing is a new industry with high upfront costs and long time scales to market, so commercializing therapies such as ex vivo red blood cell (RBC) production requires detailed cost‐benefit analyses and financial planning.8 Relevant cost contributions include materials, time, regulatory, and staff. Researchers have begun considering bioprocessing strategies enabling systematic, reliable production of cellular therapies.1, 9, 10, 11, 12 Mathematical modeling and optimization can positively impact stem cell biomanufacturing.13
This article proposes a computational framework for stem cell bioreactor design and operation which: accurately predicts erythropoietic, that is, RBC, maturation in the bioreactor via high‐fidelity modeling, discovers the factors most affecting production/cost/quality through single variate and multivariate sensitivity analysis, determines the best bioreactor design using global topological superstructure optimization, devises operational strategies maximizing bioreactor production under uncertainty via robust optimization, analyzes the likelihood of the bioreactor to be a disruptive technology using net present value (NPV) market analysis. We quantitatively demonstrate the advantages of the proposed bioprocess optimization framework using, as a case study, a dual hollow fiber bioreactor that produces RBC from hematopoietic cell, that is, blood cell, progenitors.14, 15
This article's core goal is formulating a computational framework facilitating stem cell bioreactor design and operation. The mathematical tool kit builds on algorithms previously developed for mainstream industries, for example, superstructure optimization is frequently applied to petrochemical refining. We show how to adapt, change, and apply the tools toward stem cell bioreactor design. Bioprocess optimization under uncertainty has been previously considered for monoclonal antibody production,16, 17, 18 but mathematical optimization for the cellular therapy industry requires: (1) accurately incorporating cellular kinetics, (2) capturing spatial design scales ranging from individual cellular behavior to bioreactor layout, (3) representing temporal scales ranging from metabolic reactions to cellular differentiation, (4) elucidating the impact uncertainty and heterogeneity have onto the final outcome. This article shows how the proposed computational framework incorporates the four preceding considerations; suggests specific bioreactor features for further experimental study with respect to the target cell type (RBC); motivates the application of this framework to other cellular therapy applications. We also analyze the potential for this to become a disruptive technology, that is, transform an industry with less than 2 years lead time to the clinic.19, 20
The modular, mathematical framework being proposed is illustrated in Figures 1, 2, 3. This article belongs to an ongoing effort developing building blocks for modeling and optimizing biomedical systems.21, 22 Figure 1 diagrams the computational tool kit of six mathematical methods and Figure 2 show their synergies which facilitate stem cell bioreactor design. Figure 3 outlines four sets of mathematical models needed for bioreactor design (objectives, equipment, species, cellular characteristics); each contains its own modeling, optimization, and uncertainty considerations.
Figure 1.
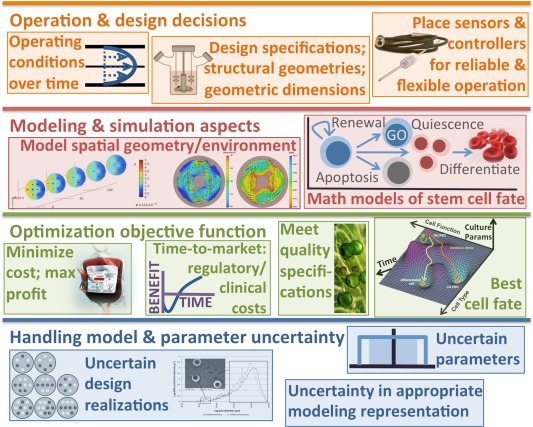
The proposed bioprocess optimization framework consists of: operation and design decisions, modeling and simulation aspects, optimization, and handling model and parameter uncertainty.
The recipe illustrated in Figure 2 for building the biomanufacturing framework under uncertainty uses the components in this figure. [Color figure can be viewed at http://wileyonlinelibrary.com]
Figure 2.
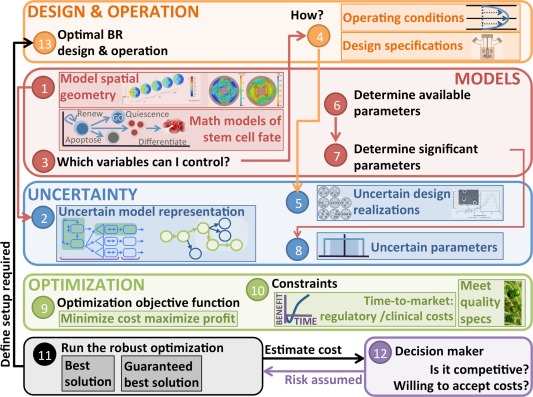
Recipe for the biomanufacturing under uncertainty framework uses the algorithm components illustrated in Figure 1.
[Color figure can be viewed at http://wileyonlinelibrary.com]
Figure 3.
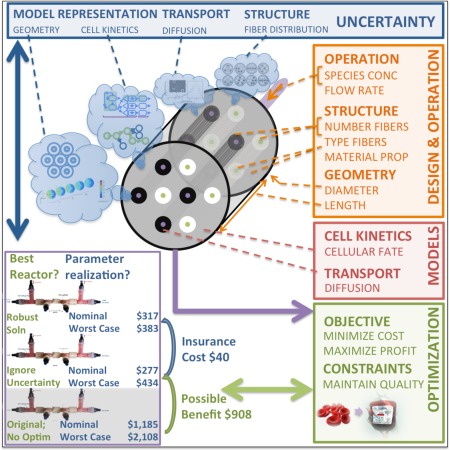
Optimal design under uncertainty for stem cell biomanufacturing requires incorporating four sets of mathematical models: (1) optimization, (2) models of mass transfer and cell kinetics, (3) design and operation, and (4) uncertainty characterization.
This application of the methods described in Figure 1 and the recipe diagramed in Figure 2 finds the optimal bioreactor design and operation that works under uncertainty and maximizes the RBCs produced while keeping the cost as low as possible. [Color figure can be viewed at http://wileyonlinelibrary.com]
As an example of the computational framework, we consider the RBC‐producing hollow fiber bioreactor illustrated in Figure 4. This novel, biomimetic, cost effective 3‐D hollow fiber bioreactor grows healthy blood ex vivo.14, 15 This bioreactor recapitulates the architectural and functional properties of blood formation and thereby reduces the need for growth factors (GFs) by an order of magnitude.14, 23 Nutrients, GFs, and oxygen flow through the hollow fibers via Poiseuille flow and diffuse into the 3‐D polymeric scaffold; resulting reactions cause the cells to grow, proliferate, and differentiate. Products and byproducts are excess cells and waste which diffuse out of the scaffold and exit through the hollow fibers. The dual hollow fiber design illustrated in Figure 5 allows recycling the expensive GFs in one set of capillaries (B) while taking up nutrients and discarding waste metabolites in another capillary set (A).15 We previously proposed a nominal superstructure optimization model for designing and operating the bioreactor.24 Rigorous, deterministic global optimization designed the nominal superstructure by simultaneously considering: number of parallelized bioreactor, number and type of hollow fibers, size and aspect ratio, feed concentrations, and flow rate through the bioreactor.
Figure 4.
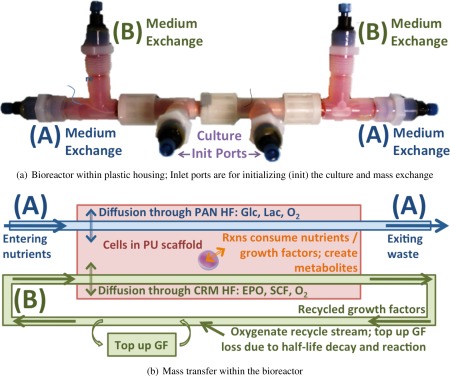
Bioreactor superstructure. 15
[Color figure can be viewed at http://wileyonlinelibrary.com]
Figure 5.
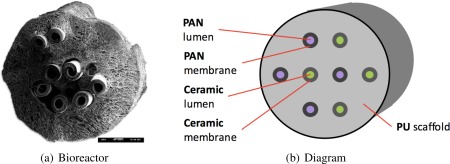
Dual hollow fiber bioreactor cross section.
[Color figure can be viewed at http://wileyonlinelibrary.com]
This article designs a computational framework analyzing how uncertain stem cell bioreactor performance impacts technology marketability. Our work fits into a broader vision of applying Quality by Design (QbD) toward reliable, reproducible, cellular therapy applications.13, 25, 26 Specifically, we manage uncertainty by: robustifying bioreactor design so that each reactor is likely to work; analyzing the price of robustification; quantifying how uncertainty affects bridging scales from individual reactions to production; identifying which sources of uncertainty profoundly impact bioreactor variability; comparing the impact of using different mathematical models; exploring the potential product marketability. Our computational analysis feeds back into experiments by suggesting candidate parameters validated using quantitative image analysis.27
Computational Methods
Our overall computational goal is studying uncertainty using a baseline model and analyzing which sources of uncertainty have the most impact. The outcome of this study is to understand the quantitative tradeoffs for entering the RBC production market using a particular technology. We use as an example a model of RBC production in a dual hollow fiber bioreactor.24 The following subsections describe the component methods of our framework: mathematical models of stem cell fate; Krogh modeling and computational fluid dynamics (CFD); single variate and multivariate sensitivity analysis; superstructure optimization; robust optimization; NPV market analysis. Figure 1 shows the constituent parts and Figure 2 illustrates how they fit into a cohesive framework.
Mathematical models of progenitor cell fate
White‐box, dynamic models of stem cell growth, proliferation, and differentiation are frequently developed by biologists, engineers, and mathematicians.28, 29, 30, 31, 32, 33, 34, 35, 36 Roeder32 summarizes these models, which conceptualize bioreactor cellular processes, for example, via molecular regulators34 or via network structure and dynamics.36 When we developed our optimization model for the blood cell bioreactor,24 we chose an ordinary differential equation (ODE) model relating hematopoiesis to the availability of GF proteins33; the Ma et al.33 model augments earlier hematopoiesis models.28, 29, 31 Using a discretized version of the Ma et al.33 model allowed us to relate growth kinetics to GF, the most expensive process input.24 For uncertainty analysis, we compare it with a competing literature hematopoiesis model; the Lobato da Silva et al.30 model of hematopoiesis in 2‐D suspension culture effectively bounds the performance of the 3‐D bioreactor. The RBC bioreactor will perform intermediate to human hematopoiesis31 and 2‐D suspension culture.30
Krogh modeling and computational fluid dynamics
Misener et al.24 model mass transfer in the dual hollow fiber bioreactor following prior work.37, 38, 39, 40, 41, 42, 43, 44 Specifically, we use the Krogh45 approximation which models fluid flow within the bioreactor as an analytical function. But Krogh45 developed his original model, illustrated in Figure 6, with respect to oxygen distribution in muscle tissues where capillary densities range 379–2341 mm−2 46; the assumption of evenly distributed, noninteracting capillaries may not be valid in a bioreactor which can accommodate 0.15–0.25 capillaries mm−2.15 The Krogh45 model validity is further challenged by: (1) extending the reactive species from O2 to additionally incorporate glucose, lactate, stem cell factor (SCF), and erythropoietin (EPO); and (2) the dual hollow fiber design of Macedo14 which allows selective species exchange such that adjacent hollow fiber have different characteristics. To quantify the error introduced by assuming the Krogh45 model, we use a high‐fidelity CFD model of mass transfer and numerically test the Krogh45 hypothesis using COMSOL 4.0a and finite element analysis. The Computational Fluid Dynamics section in the Supporting Information describes the complete setup that tests varying placements of hollow fibers so as to contradict the Kroghian assumption of equal spacing.
Figure 6.

Krogh approximation applied to the dual hollow fiber bioreactor.
[Color figure can be viewed at http://wileyonlinelibrary.com]
Single variate and multivariate sensitivity analysis
Sensitivity analysis relates model parametric uncertainty to process design decisions and is therefore a commonly used tool in process engineering applications.47, 48, 49 Misener et al.24 use one‐at‐a‐time sensitivity analysis to test how parameter uncertainty affects optimization outcomes. But any variety of single‐parameter analysis makes it difficult to analyze the nonlinear parameter interactions common in biotechnology and bioengineering.50 Sensitivity analysis in optimization typically relates to shadow prices (Lagrangian multipliers) but, for the RBC bioreactor, we cannot use these sensitivities because: (1) the discrete design choices make the shadow prices meaningless; and (2) we want to study the parameters globally across their entire range.
Global sensitivity analysis (GSA), which estimates the effect of higher level indices across the entire parameter space,51 has been used in bioprocess engineering contexts including developing cell culture parameters.52 An alternative to GSA incorporates principal component analysis.53 It would be ideal to use GSA for optimizing the hematopoietic cell bioreactor, but the Misener et al.24 model has 30 possible parameters and each optimization run requires 300 s (mathematical optimization is typically more computationally demanding than mathematical simulation because each optimization may require many simulations or function calls). There are 435 combinations of two parameters ( ) where, if we consider four levels of each parameter will take CPU days; 4060 combinations of three parameters (902.2 CPU days); 27,405 combinations of four parameters (24,360 CPU days).
To mitigate, single variable and multivariable sensitivities analyze which parameter combinations have the most significant joint effect. Our strategy is similar to the Morris54 elementary effects method which copes with computationally expensive simulation models, but note that moving from a simulation to an optimization model implies considering optimization solution outputs rather than simulation sensitivities. For a linear optimization model, we would expect the sensitivity to be approximately 0; significantly large values of indicate that nonlinearity in the optimization model is affecting the final outcome.
Global topological superstructure optimization
Typical superstructure optimization applications are in industry; examples include: well scheduling in petroleum fields,55, 56 crude oil scheduling in a petrochemical refinery,57 designing wastewater treatment systems,58, 59, 60 and crystallization.61 The purpose of Misener et al.24 applying superstructure optimization to a stem cell bioreactor is simultaneously testing a range of design variables leading to different superstructure possibilities; the ANTIGONE algorithm resolves design choice tradeoffs.62
The potential downside of superstructure optimization is that it is an expensive algorithm; deterministic global optimization involves divide‐and‐conquer search. The Misener et al.24 model therefore uses model sizes involving 200 variables and equations to achieve the reasonable 300 CPU seconds time performance noted in the single variate and multivariate sensitivity analysis section; limiting the number of parameters is also helpful in quantifying parametric uncertainty.
Robust optimization
Robust optimization, a strategy illustrated in Figure 7, finds the best solution inoculated against uncertainty; it is typically applied to instances of strict uncertainty where we can anticipate a range of possible parametric outcomes but not a probability distribution.63, 64, 65 Optimality is guaranteed in the worst‐case parameter realization and performance is also guaranteed to improve for the case of a continuum of scenarios.66
Figure 7.
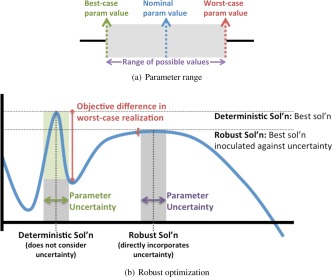
Robust optimization finds the best solution inoculated against parametric uncertainty; here we use it to produce a proactively defensive bioreactor design that takes into account the possibility of parameter variation.
Optimality is guaranteed in the worst‐case parameter realization (a) and performance is also guaranteed to improve for the case of a continuum of scenarios (b). [Color figure can be viewed at http://wileyonlinelibrary.com]
Strict uncertainty is most applicable to the RBC‐producing bioreactor because we have no knowledge of a probability distribution for any of the parameters except for the bioreactor material properties; see the analysis in Eq. (2) of Misener et al.24 Beyond assuming a uniform distribution for the parameter outcome, it is possible (with more experimental data) to permit a predetermined probability that a constraint can be violated; this prevents the recommended result from being too conservative. For now we focus on worst‐case analysis.
Robust optimization is a conservative strategy making the system more likely to operate within specifications; robust optimization allows proactively defensive bioreactor design. One possible problem with optimization is achieving solutions that are unrealistic because optimization pushes the system to the very best possible nominal solution. In practical application this is an issue because the “global optimum” may be highly sensitive to small parameter variation (see Figure 7). If the parameter realization is different than expected, the “optimal” solution with nominal parameters may perform very badly in the actual parameter realization. Robust optimization takes into account the possibility of parameter variation during the optimization process itself; this yields the best solutions that are inoculated against uncertainty.
Net present value market analysis
NPV analyzes cash flows with respect to the time value of money; each cash inflow/outflow is discounted to its present value and the present values are summed
where pairs correspond to the time t and amount Rt of each cash flow and i is the discount rate. We compare the cost inflows and outflows with respect to the expected: technology development costs, success probability, revenue stream, and market share.
Mathematical Modeling Aspects
This section discusses mathematical modeling aspects dealing with introducing an alternative model for erythropoiesis, that is, RBC production, and a robust optimization framework. The nominal optimization model is fully characterized elsewhere24; the Supporting Information defines the optimization problem and all relevant symbols in Table S3.
Ordinary differential equation models of hematopoiesis
The Colijn and Mackey31 model for hematopoiesis is the baseline for our optimal design24; an alternative model for cellular growth, proliferation, and differentiation was defined by Lobato da Silva et al.30 Figure 8 illustrates both our baseline and alternative models.
Figure 8.
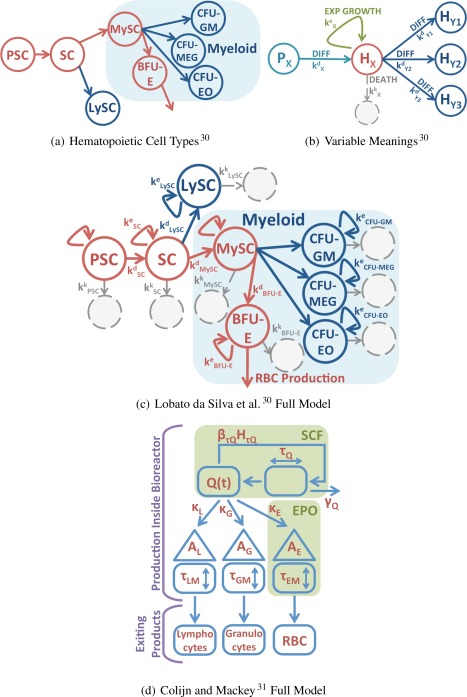
The Lobato da Silva et al. 30 alternative model of hematopoiesis (illustrated in subfigures a–c) allows us to evaluate the possible error due to selecting the baseline Colijn and Mackey 31 model 2.
[Color figure can be viewed at http://wileyonlinelibrary.com]
The cell types in Supporting Information Eq. (1) do not match the cell types defined by our baseline Colijn and Mackey31 model; both sets of authors take heterogeneous cell types from hematopoiesis and segment the cells into specific, definable types. We have already shown24 how to map the Colijn and Mackey31 cell types onto parameters defined by Chow et al.67 and Basford et al.68; these parameters connect the cellular growth, proliferation, and differentiation to the initialization and mass transfer portions of the model. Supporting Information Table S2 shows the new initialization and oxygen consumption parameters corresponding to the cellular definitions of Lobato da Silva et al.30
Robust modeling counterpart
Supporting Information develops a robust counterpart for nominal oxygen consumption and designs equivalent robust counterpart models for each of the other uncertain parameters (see Supporting Information Table S4). This discussion significantly expands a conference paper69 where we used robust optimization on the bioreactor model but did not specify the mathematics.
Results
Misener et al.24 justified a baseline mathematical model of the RBC‐producing bioreactor; this model is repeated in the Supporting Information. Supporting Information Table S3 defines the model indices, parameters, and variables. For the baseline mathematical model, we found a deterministic global optimum of $277 per unit of RBC (339 reactors; $0.82/reactor) where the material cost per reactor (after being lowered by massive parallelization) is driven by half‐life decay of EPO ($0.298) and SCF ($0.512). These bioreactor results compare favorably to the $8330 needed for 2‐D static culture.70
The following sections analyze the solution robustness via single variate and multivariate parameter sensitivity analysis, CFD modeling and exchanging models of hematopoiesis, and robust optimization. We show that, for the RBC‐producing bioreactor, the parameters interacting the most nonlinearly are those affecting the very smallest bioreactor scales. From a model uncertainty perspective, we show that and alternative hollow fiber placement and an alternative hematopoiesis model can be reformulated as parameter uncertainty and a 10% cost increase, respectively. Then, we directly use optimization under uncertainty to determine a more robust bioreactor configuration. Finally, we use our analysis to consider the potential for the RBC‐producing bioreactor to be a disruptive technology.
Single variate and multivariate parameter sensitivity analysis
The baseline results are based partially on assumptions of parameters having specific values.24 For example, we assume that glucose uptake and lactate production are proportional to our experimental results14 and that every type of cell consumes metabolites/nutrients and produces waste in the same way. But Collins et al.71 show that nutrient consumption levels depend on the percentages of colony‐forming cells (CFU‐GM and BFU‐E); there is similar uncertainty in other parameters. As described in the Computational Methods section, we vary the 30 uncertain parameters over the Supporting Information Table S4 uncertainty ranges. Parameters with known error bars vary within their expected uncertainty levels; the remaining parameters were allowed to take values 50% (L1), 90% (L2), 110% (U1), and 150% (U2) of their nominal values.
Of the 30 parameters, 9 induced the global optimum to vary by 10% or more; these are presented in Supporting Information Table S5. The cellular flux uncertainty induces the most variability; this is in line with our experimental observations that cells are being impeded from pushing through the ceramic hollow fibers of the bioreactor.72, 73 Next we investigate bivariate sensitivity; jointly changing the values of two parameters may have a nonlinear effect because the optimization model itself is nonlinear.
We see an interesting effect in Supporting Information Table S6 of bivariate sensitivities : 13 of the 24 entries contributing to inducing >15% change are related to cellular kinetics and an additional 7 parameter entries are related to cellular consumption of nutrients and production of waste. These results are interesting because they imply that the parameters interacting the most nonlinearly in the model are those affecting the very smallest scales in the bioreactor. Note that it is common to observe that very small length and time scales in a simulation model may profoundly affect the largest length and time scales,74, 75 but this effect is more rare in engineering optimization models. This interaction of many length and time scales is one of the ways that superstructure optimization and its associated sensitivity analysis have to change from its original applications in industrial petrochemical systems toward tissue engineering.
Exchanging models of mass transfer and hematopoiesis
The Computational Fluid Dynamics section in the Supporting Information describes how we set up the CFD analysis; Figure 9 and Supporting Information Figure S13 show results. The purpose of the CFD is to stress‐test the analytical Krogh45 approximation with respect to fluid flow within the experimentally observed bioreactors. Figure 9, which diagrams the bioreactor fraction limited by O2, indicates that, at least for one possible hollow fiber configuration, the Krogh and 3‐D CFD models have similar performance. But, at this writing, we have little control over bioreactor hollow fiber placement and do not know the hollow fiber placement until the bioreactor is cut open at the completion of an experiment. Supporting Information Figure S13 indicate that the variability induced by uncertainty in hollow fiber placement is more significant than the Kroghian vs. 3‐D CFD models. Based on these results, the Krogh approximation is well suited for this application; we assume that the parameter sensitivity analysis incorporates uncertainty due to hollow fiber placement.
Figure 9.
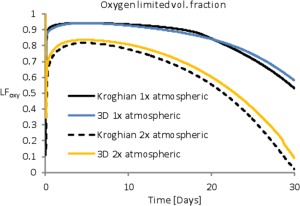
Comparison between the Krogh approximation and CFD Results.
Atmospheric refers to O2 levels and 2x atmospheric refers to a bioreactor with artificially increased O2 levels. This is only one run with evenly spaced hollow fibers. Note that there is more variability between different hollow fiber configurations, for example, Supporting Information Figure S13, than between the Krogh and CFD results. [Color figure can be viewed at http://wileyonlinelibrary.com]
In addition to switching between Kroghian and CFD models, we also considered replacing the hematopoiesis model of Colijn and Mackey31 with the model of Lobato da Silva et al.30; this change moved the price point on the reactor from $277 per unit of RBC to $306 per unit of RBC (a roughly 10% increase) but otherwise left the major design decisions the same from the ones we previously reported.24 The reason the design decisions stay constant is that, although the cell growth model has changed and the cells produce fewer RBC, the basic cellular need for nutrient delivery and waste clearance has not changed. This 10% cost increase with respect to cells yielded bounds the effect of using the wrong hematopoiesis model to describe the system; the Colijn and Mackey31 model of normal human hematopoiesis is probably too optimistic for an ex vivo system whereas the Lobato da Silva et al.30 2‐D culture model may be too pessimistic for the biomimetic bioreactor.
Robust optimization
Deterministic global optimization evaluated tradeoffs between multiple design parameters over multiple operating phases24; prior work had only optimized hollow fiber bioreactors over single variables under steady state assumptions.38, 42, 43, 44 But the nominal model is subject to uncertainty not only in the parameters but also in the model formulation itself; this uncertainty is the focus of the current article. Our quantitative image analysis confirms that key sources of uncertainty include27:
Variable distribution of hollow fibers; the Krogh45 approximation of evenly distributed, noninteracting hollow fibers may not be valid for the RBC producing bioreactor.
Uncertain mass‐transfer coefficients including: species diffusivities; hollow fiber and polyurethane scaffold porosities and pore structures; cellular flux leaving the scaffold.
Species reaction rates of the five representative species (Glc, Lac, O2, EPO, and SCF) by each of the four representative cell types (hematopoietic stem cell, Gran, Leuk, and RBC).
Price and half‐life decay of GFs.
Cellular growth, proliferation, differentiation; parameters and the underlying model.
Using robust optimization, the nominal price for a unit of RBC increases from $277 to $383. This is a worst case estimate based on every one of the parameters taking the worst case realization with respect to Supporting Information Table S4; more bioreactor data would help us design more reasonable uncertainty rules which would allow moderate increases in the price while still handling the uncertainty in a reasonable way. But even before we have complete data on how the robust optimization parameters can be modified, it is important to note the way in which robust optimization proposes to change the bioreactor model. As expected, the robust framework recommends more reactors and GFs, but robust optimization also recommends a different configuration of polymeric and ceramic hollow fibers than the nominal optimization problem. Specifically, the hollow fiber type and number are limiting constraints robust framework recommends increasing the number of ceramic hollow fibers and decreasing the number of polymeric hollow fibers. The robust model assumes that fewer cells are likely to grow in the robust reactor but that more of the produced RBC is likely to exit the hollow fiber.
Analyzing the potential to be disruptive technology
We previously estimated the bioreactor material cost,24 but we have thus far neglected the time‐value of money. To design an NPV market analysis, we assume:
Our aim is to create a disruptive technology19, 20; therefore we only have 2 years to get a fully operational product.
-
Based on Table 1 and the experimental Gantt charts in Figure 10: one operator can create and culture two bioreactors in parallel every 48 days and each operator can manage seven new experiments per year in duplicate.
Figure 10.
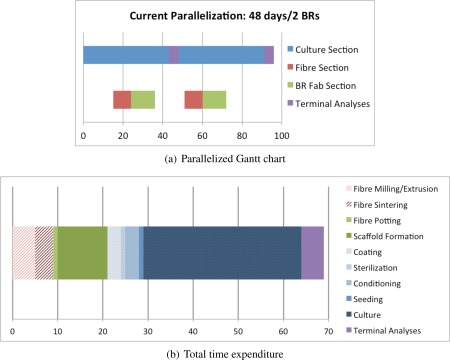 Labor time for fabricating the dual hollow fiber bioreactors.[Color figure can be viewed at http://wileyonlinelibrary.com]
 All material properties have been rigorously characterized.
Species concentrations measurements are accurate both into and out of the reactor.
We can quantitatively analyze each reactor at the end of an experiment, for example, using image analysis on bioreactor cross sections.27
Table 1.
Labor Time
| Timeline | Days | Hours/Day | Person/Days | ||
|---|---|---|---|---|---|
| Fiber creation | Fiber milling/extrusion | 5 | 5 | 3.125 |
 Sequential Steps Sequential Steps |
| Fiber sintering | 4 | 1 | 0.5 | ||
| Total | 9 | 3.625 | |||
| Bioreactor fabrication | Fiber potting | 1 | 4 | 0.5 |
 Sequential Steps Sequential Steps |
| Scaffold formation | 11 | 1 | 1.375 | ||
| Total | 12 | 1.875 | |||
| Precondition and culture | Coating | 3 | 4 | 1.5 |
 Sequential Steps Sequential Steps |
| Sterilization | 1 | 11 | 1.375 | ||
| Conditioning | 3 | 0.5 | 0.1875 | ||
| Seeding | 1 | 14 | 1.75 | ||
| Culture | 35 | 2 | 8.75 | ||
| Total | 43 | 13.5625 | |||
| Terminal analyses | 5 | 6 | 3.75 | ||
| Total time expenditure | 69 | 22.8125 |
We consider many types of uncertainty and design decisions, but assumptions (i)–(v) imply that all uncertainty can be handled by robust optimization except for uncertainty associated with the cells and their growth/proliferation/differentiation. So there are really only five design decisions which can induce unexpected changes: (1) bioreactor seeding density and (2–5) concentrations of O2, SCF, EPO, and glucose entering the bioreactor.
Based on the ODE model systems,30, 33 the cell kinetics functions are nonlinear. We aim to build a surrogate function using response surface methods76; this surrogate function may have similarities to the white‐box ODE hematopoiesis models,30, 31 but we cannot guarantee the form for either model and therefore the experiments will build a surrogate model over time. We expect that building a 5‐D response curve which is also informed by the ODE models mentioned previously will take on the order of 30, for example, if we consider a corner point design, experiments if we assume that the response is no more than quadratic. Therefore, in the first year, the project should employ four people to complete a total of 28 experiments; this will fully characterize the space. After that, the same four people will do 28 more experiments to exploit areas around the optimum a bit better.
But there is no reason to do experiments when the bioreactor is not going to be transformative. We consider several scenarios. The first is that we can construct the bioreactor in the price range of rare blood, $1150 to $3025 per unit RBC70; we take the average number of units rare blood requested each year in the United States of America (1800) and posit: (1) if there was greater rare blood availability, then it would be used more frequently and (2) that the proportion of rare blood used in the First World is proportional to that used in the United States of America. Therefore, we multiply the current rare blood usage, 1800 units per year in the United States of America by five to incorporate better availability and scale by the First World population ( ) to account for total usage; we conclude that the rare blood market share is units per year. We also posit that the total market share for blood shortages at storage banks and hospitals is a fraction of the total market share for blood and corresponds to the 10.3% of hospitals which experience at least 1 day yearly when blood shortages cannot be met70; those data imply units of blood needed to cover yearly shortages. We also estimate that the military would be willing to pay for units of blood per year for security and defense. We therefore estimate that the entire market share of rare blood is units per year; note that this an underestimate of the rare blood needed since it excludes Africa where there are significantly higher populations of rare blood types and rare blood diseases.77, 78 Assuming a 11% discount rate for NPV79 and a 10.4% chance success chance of clearing clinical trials,80 we say that for the first two years our costs will scale with the four parallel operators; we assume that each person plus lab and material costs will be $150k per year so that in the first two years we will pay out $600k per year. In years 3–20, we assume that we have 40% market share.81 In total, the payout is (using NPV) which does not compensate for the expected prehuman capitalized cost of an average compound plus the clinical cost of the average compound.
But if we could compete with the current human transfusion market and price the product at $225, then we could expect that the total market share would be per year. Using the same assumption of per year for 2 years, and 40% market saturation in year 3 and thereafter,81 the revenue would be over 20 years; this is enough to clear regulatory approval in both prehuman and clinical trials. If we have miscalculated the discount rate by 10%, then the revenue could be as little as or as much as over 20 years.
Our current estimate for robustified bioreactor design is that the bioreactor is priced at $383 in the worst case; we assume that storage and delivery is a further $225 (since this is the storage and delivery price for the already‐free blood) and assume that the final blood price would be $800; at that price we can beat the rare blood market by a significant fraction and therefore the market share is an order of magnitude larger than for rare blood. Then the payout would be which is still not enough to clear regulatory. We estimate that the price point becomes more reasonable when we are able to charge $500 and we therefore estimate that at that point the blood product could cover 20% of the total market since people may be willing to pay more for the ease‐of use. Then the payout would be over the 20 years and therefore worthwhile. To get down to $500, we need several things in the bioreactor to be better. First, the cell flux through the ceramic hollow fibers needs to be better; to manage this is basically a material question to ask whether it is possible to have hollow fibers through which the cells can migrate without shear‐related damage. With better production rates through the membrane, we expect that this could be a disruptive technology; the disruptive potential of the technology radically increases if this RBC production technology significantly cuts down on the current 1% immunologic reaction rate for RBC transfusions.82 Also, the recently developed immortalized adult human erythroid line12 may help the bioreactor by allowing production runs longer than 30 days.
Discussion
Although the nominal optimization model indicated that we could design a bioreactor costing roughly $277 per unit of RBC,24 the model did not incorporate uncertainty and therefore we had no way of evaluating if our design decisions would stand up to scrutiny. Based on this analysis, we find that, for this particular bioreactor, there are a number of parameters including cellular flux, species half‐life, and cellular kinetic parameters which should be analyzed in greater detail to find the exact price point of the bioreactor. For this hematopoietic cell bioreactor, the robust framework recommends hedging against uncertainty with more reactors and GFs. The robust framework recommends increasing the number of ceramic hollow fibers and decreasing the number of polymeric hollow fibers with respect to the nominal optimum. We also note that robust optimization is a useful framework for explicitly incorporating the parameter uncertainty into the optimization model; we can defensively design the bioreactor to accommodate known parameter variability.
There are several novel items here. First, neither superstructure optimization nor robust optimization have been applied to stem cell tissue engineering; our proposed computational framework adapts techniques which have proved successful in well‐established industries and transforming these strategies to optimize stem cell bioprocesses. One significant way that superstructure optimization changes from heavy industries to stem cell bioprocessing is the need to incorporate more orders of magnitude into the constraint set. In examples such as water treatment, there will be small quantities such as trace metals and small amounts of sulfur, but these may be linearly scaled such that the condition number of the constraint matrix is small, that is, the problem is well scaled. The superstructure optimization problem for stem cell bioprocessing, however, involves many orders of magnitude ranging from the individual cellular reactions to the number of cells produced. The complexity here is the interaction between different scales.
For robust optimization, we quantitatively ask how much risk is acceptable. In petrochemical process optimization, for example, engineers evaluate how close they are willing to get to environmental constraints; violating the law may result in a fine while staying too conservative may reduce product margins. Moving toward a clinical application, the risk incurred is that the process does not make sufficient blood for a patient in need. On the other hand, acting very conservatively may increase the price dramatically; robust optimization weighs the risk between not providing a necessary product and making it too expensively.
Combining many different uncertainty analysis strategies into one model is especially powerful; stem cell bioprocessing does not admit certain models or certain parameters. Modeling and optimization quantitatively characterize a system with minimal experiments, but we cannot tie ourselves to a single uncertainty analysis method; we want to build consensus between disparate analysis types. The different framework components reinforce one another; the computational techniques illustrated in Figure 1 are combined using the Figure 2 recipe.
Conclusions
This article proposes a framework for stem cell bioreactor design under uncertainty and analyzes the associated mathematical tool kit. In stem cell biomanufacturing, an optimal but nonrobust design may be sensitive to model or parametric uncertainty. Our framework directly incorporates uncertainty considerations and therefore fits into the broader vision of QbD.
Supporting information
Supporting Information 1
Acknowledgments
Authors acknowledge the support from Royal Academy of Engineering Research Fellowship to R.M.; EPSRC EP/M028240/1; ERC‐BioBlood (no. 340719); and the Richard Thomas Leukaemia Research Fund. M.C.A. is grateful for the Imperial College Chemical Engineering Scholarship.
Contributor Information
Ruth Misener, Email: r.misener@imperial.ac.uk.
Athanasios Mantalaris, Email: a.mantalaris@imperial.ac.uk.
Literature Cited
- 1. Kirouac DC, Zandstra PW. The systematic production of cells for cell therapies. Cell Stem Cell. 2008;3(4):369–381. [DOI] [PubMed] [Google Scholar]
- 2. Csaszar E, Kirouac DC, Yu M, Wang WJ, Qiao W, Cooke MP, Boitano AE, Ito C, Zandstra PW. Rapid expansion of human hematopoietic stem cells by automated control of inhibitory feedback signaling. Cell Stem Cell. 2012;10(2):218–229. [DOI] [PubMed] [Google Scholar]
- 3. Csaszar E, Cohen S, Zandstra PW. Blood stem cell products: toward sustainable benchmarks for clinical translation. BioEssays. 2013;35(3):201–210. [DOI] [PubMed] [Google Scholar]
- 4. Serra M, Brito C, Correia C, Alves PM. Process engineering of human pluripotent stem cells for clinical application. Trends Biotechnol. 2012;30(6):350–359. [DOI] [PubMed] [Google Scholar]
- 5. Ungrin MD, Clarke G, Yin T, Niebrugge S, Nostro MC, Sarangi F, Wood G, Keller G, Zandstra PW. Rational bioprocess design for human pluripotent stem cell expansion and endoderm differentiation based on cellular dynamics. Biotechnol Bioeng. 2012;109(4):853–866. [DOI] [PMC free article] [PubMed] [Google Scholar]
- 6. Rousseau GF, Giarratana M‐C, Douay L. Large‐scale production of red blood cells from stem cells: what are the technical challenges ahead? Biotechnol J. 2014;9(1):28–38. [DOI] [PubMed] [Google Scholar]
- 7. Jenkins MJ, Farid SS. Human pluripotent stem cell‐derived products: advances towards robust, scalable and cost‐effective manufacturing strategies. Biotechnol J. 2015;10(1):83–95. [DOI] [PMC free article] [PubMed] [Google Scholar]
- 8. Brindley DA, Reeve BC, Sahlman WA, Bonfiglio GA, Davie NL, Culme‐Seymour EJ, Mason C. The impact of market volatility on the cell therapy industry. Cell Stem Cell. 2011;9(5):397–401. [DOI] [PubMed] [Google Scholar]
- 9. Placzek MR, Chung I‐M, Macedo HM, Ismail S, Mortera Blanco T, Lim M, Min JC, Fauzi I, Kang Y, Yeo DCL, Ma CYJ, Polak JM, Panoskaltsis N, Mantalaris A. Stem cell bioprocessing: fundamentals and principles. J R Soc Interface. 2009;6(32):209–232. [DOI] [PMC free article] [PubMed] [Google Scholar]
- 10. Ratcliffe E, Thomas RJ, Williams DJ. Current understanding and challenges in bioprocessing of stem cell‐based therapies for regenerative medicine. Br Med Bull. 2011;100(1):137–155. [DOI] [PubMed] [Google Scholar]
- 11. Hambor JE. Bioreactor design and bioprocess controls for industrialized cell processing. BioProcess Int. 2012;10(6):22–33. [Google Scholar]
- 12. Trakarnsanga K, Griffiths RE, Wilson MC, Blair A, Satchwell TJ, Meinders M, Cogan N, Kupzig S, Kurita R, Nakamura Y, Toye AM, Anstee DJ, Frayne J. An immortalized adult human erythroid line facilitates sustainable and scalable generation of functional red cells. Nat Commun. 2017;8:14750. [DOI] [PMC free article] [PubMed] [Google Scholar]
- 13. Papantoniou I, Mantalaris A, Sonnaert M, Lambrechts T, Aerts J‐M, Geris L, Schrooten J. Product and process design: towards industrial TE manufacturing In: Mouse M, editor. Tissue Engineering. Amsterdam, the Netherlands: Elsevier, 2014:1–40. [Google Scholar]
- 14. Macedo HM. A novel 3D dual hollow fibre bioreactor for the production of human red blood cells. PhD Thesis. London, UK: Imperial College London, 2011.
- 15. Panoskaltsis N, Macedo HMM, Blanco MTM, Mantalaris A, Livingston AG. 3‐dimensional hollow fibre bioreactor systems for the maintenance, expansion, differentiation and harvesting of human stem cells and their progeny, 2012. Patent WO 2012/069841 A1.
- 16. Farid SS, Washbrook J, Titchener‐Hooker NJ. Decision‐support tool for assessing biomanufacturing strategies under uncertainty: stainless steel versus disposable equipment for clinical trial material preparation. Biotech Prog. 2005;21(2):486–497. [DOI] [PubMed] [Google Scholar]
- 17. Farid SS, Washbrook J, Titchener‐Hooker NJ. Modelling biopharmaceutical manufacture: design and implementation of SimBiopharma. Comput Chem Eng. 2007;31(9):1141–1158. [Google Scholar]
- 18. Pollock J, Ho SV, Farid SS. Fed‐batch and perfusion culture processes: economic, environmental, and operational feasibility under uncertainty. Biotech Bioeng. 2013;110(1):206–219. [DOI] [PubMed] [Google Scholar]
- 19. Russell AJ. First steps on the path to defining disruptive science and technology. Disruptive Sci Technol. 2012;1(1):1–2. [Google Scholar]
- 20. Russell AJ. The end of the beginning for tissue engineering. The Lancet. 2015;383(9913):193–195. [DOI] [PubMed] [Google Scholar]
- 21. Velliou E, Fuentes‐Garí M, Misener R, Pefani E, Rende M, Panoskaltsis N, Pistikopoulos EN, Mantalaris A. A framework for the design, modeling and optimization of biomedical systems. In Siirola JD, Eden M, Towler GP, editors. Proceedings of the 8th International Conference on Foundations of Computer‐Aided Process Design FOCAPD, Computer‐Aided Chemical Engineering Series, Vol. 34. Amsterdam, the Netherlands: Elsevier, 2014:225–236.
- 22. Fuentes‐Garí M, Velliou E, Misener R, Pefani E, Rende M, Panoskaltsis N, Pistikopoulos EN, Mantalaris A. A systematic framework for the design, simulation and optimization of personalized healthcare: making and healing blood. Comput Chem Eng. 2015;81:80–93. [Google Scholar]
- 23. Allenby MC, Tahlawi A, Misener R, Brito dos Santos S, Mantalaris A, Panoskaltsis N. Spatiotemporal mapping of erythroid, stromal, and osteogenic niche formation to support physiologic red cell production in a three‐dimensional hollow fibre perfusion bioreactor. Blood. 2016;128(22):3885. [Google Scholar]
- 24. Misener R, Fuentes‐Garí M, Rende M, Velliou E, Panoskaltsis N, Pistikopoulos EN, Mantalaris A. Global superstructure optimisation of red blood cell production in a parallelised hollow fibre bioreactor. Comput Chem Eng. 2014;71:532–553. [Google Scholar]
- 25. Geris L, Guyot Y, Schrooten J, Papantoniou I. In silico regenerative medicine: how computational tools allow regulatory and financial challenges to be addressed in a volatile market. Interface Focus. 2015;6(2):20150105. [DOI] [PMC free article] [PubMed] [Google Scholar]
- 26. Lipsitz YY, Timmins NE, Zandstra PW. Quality cell therapy manufacturing by design. Nat Biotechnol. 2016;34(4):393–401. [DOI] [PubMed] [Google Scholar]
- 27. Allenby MC, Misener R, Panoskaltsis N, Mantalaris A. A quantitative three‐dimensional (3D) image analysis tool for maximal acquisition of spatial heterogeneity data. Tissue Eng Part C Methods. 2017;23(2):108–117. [DOI] [PubMed] [Google Scholar]
- 28. Belair J, Mackey MC, Mahaffy JM. Age‐structured and 2‐delay models for erythropoiesis. Math Biosci. 1995;128(1–2):317–346. [DOI] [PubMed] [Google Scholar]
- 29. Mahaffy JM, Belair J, Mackey MC. Hematopoietic model with moving boundary condition and state dependent delay: applications in erythropoiesis. J Theor Biol. 1998;190(2):135–146. [DOI] [PubMed] [Google Scholar]
- 30. Lobato da Silva C, Goncalves R, Lemos F, Lemos MA, Zanjani ED, Almeida‐Porada G, Cabral JMS. Modelling of ex vivo expansion/maintenance of hematopoietic stem cells. Bioproc Biosyst Eng. 2003;25(6):365–369. [DOI] [PubMed] [Google Scholar]
- 31. Colijn C, Mackey MC. A mathematical model of hematopoiesis—I. Periodic chronic myelogenous leukemia. J Theor Biol. 2005;237(2):117–132. [DOI] [PubMed] [Google Scholar]
- 32. Roeder I. Quantitative stem cell biology: computational studies in the hematopoietic system. Curr Opin Hematol. 2006;13(4):222–228. [DOI] [PubMed] [Google Scholar]
- 33. Ma CYJ, Kumar R, Xu XY, Mantalaris A. A combined fluid dynamics, mass transport and cell growth model for a three‐dimensional perfused biorector for tissue engineering of haematopoietic cells. Biochem Eng J. 2007;35(1):1–11. [Google Scholar]
- 34. Ma CYJ, Panoskaltsis N, Kumar R, Xu XY, Mantalaris A. Simulation of ex vivo bone marrow culture: application to chronic myeloid leukaemia growth model. Biochem Eng J. 2012;61:66–77. [Google Scholar]
- 35. Yeo D, Kiparissides A, Cha JM, Aguilar‐Gallardo C, Polak JM, Tsiridis E, Pistikopoulos EN, Mantalaris A. Improving embryonic stem cell expansion through the combination of perfusion and bioprocess model design. PLoS One, 2013;8(12):e81728. [DOI] [PMC free article] [PubMed] [Google Scholar]
- 36. Kittas A, Yang L, Papageorgiou LG, May G, Enver T, Bogle IDL. Identifying gene regulatory networks In: Espuña A, Graells M, Puigjaner L, editors. 27th European Symposium on Computer Aided Process Engineering, Computer‐Aided Chemical Engineering Series. Amsterdam, the Netherlands: Elsevier, 2017. [Google Scholar]
- 37. Brotherton JD, Chau PC. Modeling of axial‐flow hollow fiber cell culture bioreactors. Biotechnol Progr. 1996;12(5):575–590. [Google Scholar]
- 38. Chresand TJ, Gillies RJ, Dale BE. Optimum fiber spacing in a hollow fiber bioreactor. Biotechnol Bioeng. 1998;32(8):983–992. [DOI] [PubMed] [Google Scholar]
- 39. Piret JM, Cooney CL. Model of oxygen‐transport limitations in hollow fiber bioreactors. Biotechnol Bioeng. 1991;37(1):80–92. [DOI] [PubMed] [Google Scholar]
- 40. Jayaraman VK. The solution of hollow fiber bioreactor design equations. Biotechnol Progr. 1992;8(5):462–464. [DOI] [PubMed] [Google Scholar]
- 41. Labecki M, Bowen BD, Piret JM. Two‐dimensional analysis of protein transport in the extracapillary space of hollow‐fibre bioreactors. Chem Eng Sci. 1996;51(17):4197–4213. [Google Scholar]
- 42. Yoon SH, Kim HS, Yeom IT. Optimization model of submerged hollow fiber membrane modules. J Membr Sci. 2004;234(1–2):147–156. [Google Scholar]
- 43. Davidson AJ, Ellis MJ, Chaudhuri JB. A theoretical method to improve and optimize the design of bioartificial livers. Biotechnol Bioeng. 2010;106(6):980–988. [DOI] [PubMed] [Google Scholar]
- 44. Shipley RJ, Davidson AJ, Chan K, Chaudhuri JB, Waters SL, Ellis MJ. A strategy to determine operating parameters in tissue engineering hollow fiber bioreactors. Biotechnol Bioeng. 2011;108(6):1450–1461. [DOI] [PMC free article] [PubMed] [Google Scholar]
- 45. Krogh A. The number and distribution of capillaries in muscles with calculations of the oxygen pressure head necessary for supplying the tissue. J Physiol. 1919;52:409–415. [DOI] [PMC free article] [PubMed] [Google Scholar]
- 46. Borisov AB, Huang SK, Carlson BM. Remodeling of the vascular bed and progressive loss of capillaries in denervated skeletal muscle. Anat Rec. 2000;258(3):292–304. [DOI] [PubMed] [Google Scholar]
- 47. Kiparissides A, Kucherenko SS, Mantalaris A, Pistikopoulos EN. Global sensitivity analysis challenges in biological systems modeling. Ind Eng Chem Res. 2009;48(15):7168–7180. [Google Scholar]
- 48. Kiparissides A, Koutinas M, Kontoravdi C, Mantalaris A, Pistikopoulos EN. ‘Closing the loop’ in biological systems modeling—from the in silico to the in vitro. Automatica. 2011;47:1147–1155. [Google Scholar]
- 49. Ashworth WB, Davies NA, Bogle IDL. A computational model of hepatic energy metabolism: understanding zonated damage and steatosis in NAFLD. PLOS Comput Biol. 2016;12:1–30. [DOI] [PMC free article] [PubMed] [Google Scholar]
- 50. Saltelli A, Ratto M, Tarantola S, Campolongo F. Sensitivity analysis for chemical models. Chem Rev. 2005;105(7):2811–2827. [DOI] [PubMed] [Google Scholar]
- 51. Kucherenko S, Rodriguez‐Fernandez M, Pantelides C, Shah N. Monte Carlo evaluation of derivative‐based global sensitivity measures. Reliab Eng Syst Saf. 2009;94(7, Spec. Issue):1135–1148. [Google Scholar]
- 52. Kontoravdi C, Pistikopoulos EN, Mantalaris A. Systematic development of predictive mathematical models for animal cell cultures. Comput Chem Eng. 2010;34(8):1192–1198. [Google Scholar]
- 53. Sumner T, Shephard E, Bogle IDL. A methodology for global‐sensitivity analysis of time‐dependent outputs in systems biology modelling. J Royal Soc Interface. 2012;9(74):2156–2166. [DOI] [PMC free article] [PubMed] [Google Scholar]
- 54. Morris MD. Factorial sampling plans for preliminary computational experiments. Technometrics. 1991;33(2):161–174. [Google Scholar]
- 55. Kosmidis VD, Perkins JD, Pistikopoulos EN. Optimization of well oil rate allocations in petroleum fields. Ind Eng Chem Res. 2004;43(14):3513–3527. [Google Scholar]
- 56. Kosmidis VD, Perkins JD, Pistikopoulos EN. A mixed integer optimization formulation for the well scheduling problem on petroleum fields. Comput Chem Eng. 2005;29(7):1523–1541. [Google Scholar]
- 57. Li J, Misener R, Floudas CA. Continuous‐time modeling and global optimization approach for scheduling of crude oil operations. AIChE J. 2012;58(1):205–226. [Google Scholar]
- 58. Chakraborty A, Linninger AA. Plant‐wide waste management. 1. Synthesis and multiobjective design. Ind Eng Chem Res. 2002;41(18):4591–4604. [Google Scholar]
- 59. Meyer CA, Floudas CA. Global optimization of a combinatorially complex generalized pooling problem. AIChE J. 2006;52(3):1027–1037. [Google Scholar]
- 60. Misener R, Floudas CA. Global optimization of large‐scale pooling problems: quadratically constrained MINLP models. Ind Eng Chem Res. 2010;49(11):5424–5438. [Google Scholar]
- 61. Su Q, Benyahia B, Nagy ZK, Rielly CD. Mathematical modeling, design, and optimization of a multisegment multiaddition plug‐flow crystallizer for antisolvent crystallizations. Org Process Res Dev. 2015;19(12):1859–1870. [Google Scholar]
- 62. Misener R, Floudas CA. ANTIGONE: Algorithms for coNTinuous/Integer Global Optimization of Nonlinear Equations. J Glob Optim, 59(2–3):503–526, 2014. [Google Scholar]
- 63. Ben‐Tal A. and Nemirovski A. Robust solutions of linear programming problems contaminated with uncertain data. Math Progam. 2000;88(3):411–424. [Google Scholar]
- 64. Bertsimas D, Sim M. The price of robustness. Oper Res. 2004;52(1):35–53. [Google Scholar]
- 65. Lin X, Janak SL, Floudas CA. A new robust optimization approach for scheduling under uncertainty: I. Bounded uncertainty. Comput Chem Eng. 2004;28(67):1069–1085. [Google Scholar]
- 66. Rustem B, Howe M. Algorithms for Worst‐Case Design and Applications to Risk Management. Princeton, NJ: Princeton University Press, 2009. [Google Scholar]
- 67. Chow DC, Wenning LA, Miller WM, Papoutsakis ET. Modeling pO(2) distributions in the bone marrow hematopoietic compartment. I. Krogh's model. Biophys J. 2001;81(2):675–684. [DOI] [PMC free article] [PubMed] [Google Scholar]
- 68. Basford C, Forraz N, McGuckin C. Optimized multiparametric immunophenotyping of umbilical cord blood cells by flow cytometry. Nat Protoc. 2010;5(7):1337–1346. [DOI] [PubMed] [Google Scholar]
- 69. Misener R, Chin J, Lai M, Fuentes‐Garí M, Velliou E, Panoskaltsis N, Pistikopoulos EN, Mantalaris A. Robust superstructure optimisation of a bioreactor that produces red blood cells In: Mizsey P, Klemes J, Friedler F, editor. 24th European Symposium on Computer Aided Process Engineering, Computer‐Aided Chemical Engineering, Vol 33 Amsterdam, the Netherlands: Elsevier, 2014:91–96. [Google Scholar]
- 70. Timmins NE, Nielsen LK. Blood cell manufacture: current methods and future challenges. Trends Biotechnol. 2009;27(7):415–422. [DOI] [PubMed] [Google Scholar]
- 71. Collins PC, Nielsen LK, Wong C‐K, Papoutsakis ET, Miller WM. Real‐time method for determining the colony‐forming cell content of human hematopoietic cell cultures. Biotechnol Bioeng. 1997;55(4):693–700. [DOI] [PubMed] [Google Scholar]
- 72. Allenby MC, Tahlawi A, Brito Dos Santos S, Misener R, Hwang Y, Panoskaltsis N, Mantalaris A. Development of a hematopoietic microenvironment for the production of red blood cells (RBCs) in a novel 3D hollow fibre bioreactor. Tissue Eng Part A. 2015;21(S1):S15–S16. [Google Scholar]
- 73. Allenby MC, Tahlawi A, Brito Dos Santos S, Misener R, Hwang YS, Panoskaltsis N, Mantalaris A. Development of an ex vivo bone marrow mimicry microenvironment in a novel 3D hollow fibre bioreactor. Exp Hematol. 2015;43(9):S51. [Google Scholar]
- 74. Praprotnik M, Site LD, Kremer K. Multiscale simulation of soft matter: from scale bridging to adaptive resolution. Annu Rev Phys Chem. 2008;59(1):545–571. [DOI] [PubMed] [Google Scholar]
- 75. Ford AN, Pack DW, Braatz RD. Multi‐scale modeling of PLGA microparticle drug delivery systems In: Pistikopoulos EN, Georgiadis MC, Kokossis A, editors. 21st European Symposium on Computer Aided Process Engineering, Computer‐Aided Chemical Engineering Series. Amsterdam, the Netherlands: Elsevier, 2011:1475–1479. [Google Scholar]
- 76. Box GEP, Wilson KB. On the experimental attainment of optimum conditions. J R Stat Soc Series B Methodol. 1951;13(1):1–45. [Google Scholar]
- 77. Anstee DJ. The relationship between blood groups and disease. Blood. 2010;115(23):4635–4643. [DOI] [PubMed] [Google Scholar]
- 78. Osaro E, Charles AT. The challenges of meeting the blood transfusion requirements in Sub‐Saharan Africa: the need for the development of alternatives to allogenic blood. J Blood Med. 2011;2:721. [DOI] [PMC free article] [PubMed] [Google Scholar]
- 79. Stewart JJ, Bonifant B. The valuation high ground. Nat Biotechnol. 2009;27(11):980–983. [PubMed] [Google Scholar]
- 80. Hay M, Thomas DW, Craighead JL, Economides C, Rosenthal J. Clinical development success rates for investigational drugs. Nat Biotechnol. 2014;32(1):40–51. [DOI] [PubMed] [Google Scholar]
- 81. Cha M, Yu F. Pharmas first‐to‐market advantage, 2014. http://www.mckinsey.com/insights/health_systems_and_services/pharmas_first_to_market_advantage. Accessed September 13, 2015.
- 82. Heddle NM, Klama LN, Griffith L, Roberts R, Shukla G, Kelton JG. A prospective‐study to identify the risk‐factors associated with acute reactions to platelet and red‐cell transfusions. Transfusion. 1993;33(10):794–797. [DOI] [PubMed] [Google Scholar]
Associated Data
This section collects any data citations, data availability statements, or supplementary materials included in this article.
Supplementary Materials
Supporting Information 1


