Abstract
Purpose
To create an interactive web-based tool for the Prediction of Risk of Metastasis in Uveal Melanoma (PRiMeUM) that can provide a personalized risk estimate of developing metastases within 48 months of primary uveal melanoma (UM) treatment. The model utilizes routinely collected clinical and tumor characteristics on 1227 UM, with the option of including chromosome information when available.
Methods
Using a cohort of 1227 UM cases, Cox proportional hazard modeling was used to assess significant predictors of metastasis including clinical and chromosomal characteristics. A multivariate model to predict risk of metastasis was evaluated using machine learning methods including logistic regression, decision trees, survival random forest, and survival-based regression models. Based on cross-validation results, a logistic regression classifier was developed to compute an individualized risk of metastasis based on clinical and chromosomal information.
Results
The PRiMeUM model provides prognostic information for personalized risk of metastasis in UM. The accuracy of the risk prediction ranged between 80% (using chromosomal features only), 83% using clinical features only (age, sex, tumor location, and size), and 85% (clinical and chromosomal information). Kaplan-Meier analysis showed these risk scores to be highly predictive of metastasis (P < 0.0001).
Conclusions
PRiMeUM provides a tool for predicting an individual's personal risk of metastasis based on their individual and tumor characteristics. It will aid physicians with decisions concerning frequency of systemic surveillance and can be used as a criterion for entering clinical trials for adjuvant therapies.
Keywords: uveal melanoma, metastasis, prediction model, prognostic features, ocular cancer
Uveal melanoma (UM) is an aggressive ocular tumor associated with loss of vision and high morbidity.1 The population-based mortality rate is quoted as high as 50%2 within an interval of 4 to 5 years, primarily a result of metastasis to the liver. However, the personal risk for metastasis varies for each individual because of the fact that all tumors carry unique combinations of features. Our previous studies, and those of others, have shown that clinical characteristics, including male sex, older age, larger tumor diameter and thickness, and ciliary body involvement can increase the risk of metastasis.3–9 Risk is also increased by the presence of chromosome 3 monosomy, loss of chromosome 1p or 8p, or gain of 8q, or decreased by the gain of 6p in the tumors.4,9–16 Dogrusöz et al.17 have recently shown that the prognostic value of the American Joint Committee on Cancer (AJCC) Tumor-Node-Metastasis staging system18 can be improved by adding chromosome 3 and 8q status. Somatic mutations in BAP1 and SF3B1, and PRAME expression have also been associated with increased metastatic risk, whereas mutations in EIF1AX have been shown to be protective.19–21
Models designed to predict either survival or risk of metastasis following treatment for UM based on gene expression profiling (GEP),22–26 or clinical and tumor characteristics, and cytogenetic risk factors27–29 have been described. The GEP model uses the expression profile of a 12-gene panel in combination with tumor diameter to classify UM into low (class 1A and 1B) or high (class 2) risk of metastasis.22–26 Using this GEP model, the 5-year actuarial metastasis-free survival estimate for class 1 tumors was 97% or 90%, depending on whether the basal diameter was less or greater than 12 mm. For class 2 tumors, the survival estimate was 90% for tumors having a basal diameter less than 12 mm and 30% for those greater than 12 mm.25 An alternative model, Liverpool Uveal Melanoma Prognosticator Online (LUMPO)27,28 utilizes a set of clinical, histological and chromosomal features to estimate relative overall survival in individuals with UM relative to an age and sex matched British population and adjusted for risk from death due to all other causes.28,29 This model has recently been validated in an independent cohort of 390 UM individuals from University of California-San Francisco (C-index = 0.72).29
The aim of this study was to develop a web based tool titled Predicting Risk of Metastasis in Uveal Melanoma (PriMeUM), which provides an individualized prediction of risk of metastasis from UM within 48 months following treatment. When compared with previously established models,23,25,27–29 this risk prognostication integrates clinical and tumor characteristics that are routinely obtained as part of the clinical work-up and can be refined by chromosome 3, 1p, 6, and 8 copy number status when known. This personalized estimate of risk of developing metastases within 48 months of treatment can be generated with or without chromosomal copy number information and does not require extrinsic population-based survival statistics. PRiMeUM output provides information that is important for the patient and helps physicians decide on a more individualized plan of care and treatment.
Methods
UM Cohort
The dataset consisted of 1227 UM cases managed by the Ocular Oncology Service at Wills Eye Hospital, Philadelphia, Pennsylvania between December 1985 and March 2016. Cases included in this study were drawn from those submitted to the Genetic Diagnostic Laboratory, University of Pennsylvania. Inclusion was based on the availability of complete clinical information and information on whether metastases had occurred within a known follow-up period. The Wills Eye Hospital Ocular Oncology Service sees approximately 9 to 10 new patients per week, or 475 per year. Based on the estimate of 2000 new UM cases per year in the United States,30 this number represents approximately 24% of new cases each year. Approximately 57% of the cases included in the dataset used to create the PRiMeUM model are regional to Philadelphia (PA, NJ, NY, MD, and DE), 40% are national (largely from VA, TX, FL, NC, MI, SC, GA, and IL), and 3% are international. This dataset reflects closely the geographic distribution of patients seen by the Ocular Oncology Service. Because UM is a rare tumor, there are a limited number of specialty ocular oncology centers where most of the affected cases are treated. In our dataset, in comparing cases with less than and greater than 48 months follow-up, there is no significant difference in the distribution of cases based on regional, national, or international residential addresses (P = 0.23). More than 50% of the cases in this study come from a large radius along the east coast of the United States, suggesting a bias in terms of the residential addresses. Hence, although we note that there is a regional bias, it will likely be the same for every specialty center that treats UM.
Archived and fresh tumor samples collected following enucleation or fine-needle aspiration biopsy (FNAB) were submitted to the Genetic Diagnostic Laboratory for chromosomal copy number analysis. Information on age at time of UM diagnosis, sex, tumor location and size, and information on UM metastasis and follow-up time was obtained by a retrospective review of medical charts for all individuals. Tumor dimensions were determined at the time of initial diagnosis. Informed consent for the use of excess tissue and relevant information for research purposes was obtained from all individuals who submitted samples for chromosomal testing. This research was approved by the Institutional Review Board of the University of Pennsylvania.
DNA Extraction and Determination of Chromosomal Alterations
Genomic DNA was isolated from archived or fresh-frozen tumor samples and FNABs, and whole genome copy number status determined as previously described.4 Chromosome 3 copy number was available for 1158 tumors, whereas chromosome 1p, 6, and 8 status were available for a subset of 688 tumors. Tumors having a pattern of mixed chromosome disomy and monosomy likely as a result of tumor heterogeneity were categorized as mosaic.
Data for Analysis
Tumors were labeled “metastasis free” when there were no metastases within 48 months of primary UM treatment (n = 593, 48%), and “metastasis positive” (n = 204, 17%) for those cases where systemic tumors were identified within 48 months of treatment. Cases with less than 48 months follow-up were considered “unlabeled” (n = 430, 35%). Because our goal was to create a predictive model for metastasis within 48 months, this third group was considered unlabeled data for the classification task.
Data available for all 1227 cases included the following features: age and sex, tumor location (choroidal [CH], ciliary body [CB], ciliochoroidal [CB-CH], iris, iris-CB, and iris CB-CH), diameter, and thickness (mm). Chromosome 3 status (disomy, monosomy, partial monosomy, or mosaic) was available for 1158 tumors. The copy number status of 1p, 6p, 6q, 8p, and 8q (disomy, gain, or loss) was available for a subset of 688 tumors. Based on the availability of chromosome information, all tumors (labeled and unlabeled) were divided into three categories and were used to generate three related models (Table 1): SET1 tumors had clinical and tumor characteristics but no chromosome information (N = 1227 total), SET2 had SET1 features plus chromosome 3 status (n = 1158), and SET3 had SET2 features plus chromosome 1p, 6p, 6q, 8p, and 8q data (n = 688). SET0 used chromosomal information only to demonstrate the improvement in the accuracy of the prognostication provided by inclusion of clinical data (n = 688).
Table 1.
Clinical, Tumor, and Chromosomal Features Used in the Three Datasets Used to Train the PRiMeUM Models
Continuous features (age and tumor diameter and thickness) were compared using Mann-Whitney U test, and discrete features (sex, tumor location, and chromosome copy number) using Fisher exact tests (vassarstats.net). Cox univariate and multivariate proportional hazard regression was used to determine association with metastasis (SPSS 24, IBM, New York, NY, USA).4
When building the models, discrete attributes were turned into binary features, whereas age, diameter, and thickness were scaled and used as continuous variables. The information content describes the mutual information31 between a discrete feature (e.g., metastasis yes/no) and a dichotomized continuous feature for a given threshold (e.g., tumor diameter). The P value was computed using a two-sided Fisher exact test.
Classification Algorithm
For the classification task, both linear (logistic regression) and nonlinear models were tested (see Supplementary Methods), and the simpler logistic regression model was chosen to build the prognostic classifier. It was evaluated using 10-fold cross validation repeated 10 times using random permutation of the case cohort. The logistic regression linear model was fit by coordinate descent using the Liblinear package.32 This allowed only 797 labeled samples to be used for both training and testing. We also utilized the 430 unlabeled samples by training the algorithm in a two-step approach using the cross entropy loss function (see Supplementary Methods).33 The algorithm was then retrained using both the labeled data and the predicted (probabilistic) labels for the unlabeled data. Including the 430 unlabeled cases with the two-step approach resulted in a slight improvement in the accuracy. The accuracy of the model was estimated using the area under the curve (AUC).
To develop a personalized risk score (PRS) based on the individual's clinical characteristics and chromosomal features of the tumor, we transformed the logistic regression output (termed ‘raw model score' throughout) using a local positive prediction value approach based on the labeled cases only. For this purpose, we defined a score's neighborhood to include the scores ±5% around the given score's percentile. Thus, for each individual, we considered all other raw model scores within ±5% of that individual. The PRS was then calculated as the fraction of metastasis in those individuals and used as the individualized risk score for that individual. The individual risk of metastasis is therefore influenced by the individual's raw model score and by the rate of metastasis for individuals in our cohort with a similar raw model score. For example, if an individual's score was at the 78th percentile of the scores in the population, we computed the expected PRS based on the scores in the 73nd to 83rd percentiles. The Kaplan-Meier survival method was used to visualize metastasis-free survival with five equal sized categories of individualized risk scores (SPSS 24, IBM).
Webtool Implementation
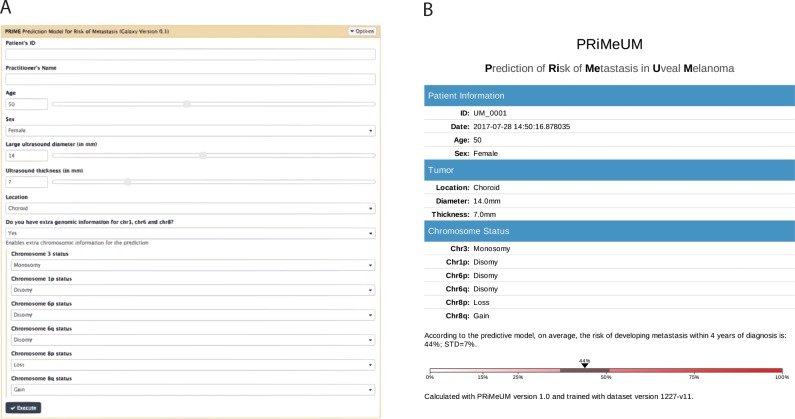
The PRiMeUM webtool is located on Galaxy server free to access at https://primeum.biociphers.org/. Users can enter clinical and chromosomal data (when available) to generate a personalized risk estimate based on the PRS (Figs. 1A,1B). Estimates of the standard error of the individual risk score were based on the 10 iterations of 10-fold cross validation described above.
Figure 1.
PRiMeUM input (A) and output (B) pages. The input form requires age, sex, tumor diameter, thickness, and location. The options exist to execute PRiMeUM using no chromosomal data, chromosome 3 data only, or chromosome 3, plus 1p, 6p, 6q, 8p, and 8q status. The output page records the input features and reports an individual's risk of metastasis within 48 months of diagnosis based on the input features. PRiMeUM can be accessed at https://primeum.biociphers.org/.
Results
UM Individual and Tumor Characteristics
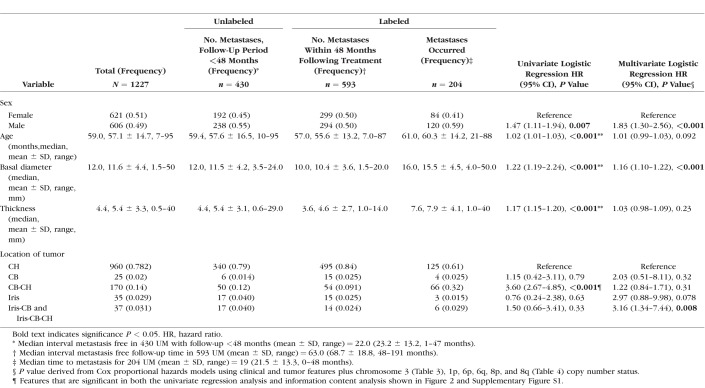
The cohort used to train and validate the PRiMeUM prognostication model comprised 1227 samples described in Table 2. These included 593 individuals without metastases within 48 months of treatment (48%), 204 with metastases within this time period (17%), and 430 with no known metastases (35%), but with follow-up time less than 48 months. The total number of tumors originally considered for analysis included 250 that had metastasized, 204 (82%) within 48 months following initial treatment. To maximize the number of labeled metastasis-free cases while ensuring greater accuracy in the prognostic model, 48 months was chosen as the cut-off for defining the metastasis-free label. The remaining 46 (18%) metastasized between 49 and 133 months and were not included in this study (see Supplementary Methods).
Table 2.
Cox Univariate and Multivariate Regression Analysis Correlating the Incidence of Metastasis in 1227 UM Cases (SET1) With Clinical and Tumor Features Plus Chromosome 3, 1p, 6, and 8 Copy Number Status When Known
Feature Analysis
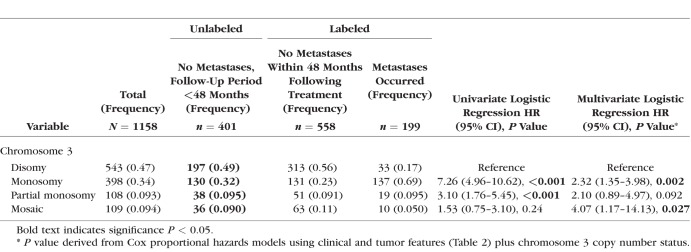
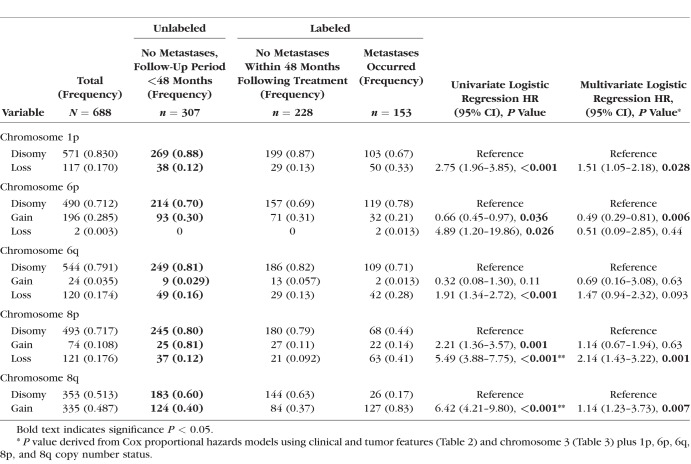
In line with previous studies,3–9,11 Cox univariate analysis showed that male sex (P = 0.007), older age (P < 0.001), tumor basal diameter and thickness (both P < 0.001), ciliochoroidal location (CB-CH, P < 0.001), and chromosome 3 monosomy or partial monosomy (P < 0.001) were all significantly associated with increased incidence of metastases (Tables 2 and 3). Copy number statuses of chromosomes 1p, 6, and 8, were included because of their previously described association with metastasis in UM4,10–12 as follows: 1p loss (P < 0.001), 6p loss (0.026), 6q loss (P < 0.001), 8p loss (P < 0.001), and 8q gain (P < 0.001) were associated with increased risk of metastasis, whereas 6p gain was associated with a decreased risk (P = 0.036; Table 4).
Table 3.
Cox Univariate and Multivariate Regression Analyses Correlating the Incidence of Metastasis in 1158 UM Cases (SET2) for Which Chromosome 3 Copy Number Status Was Available
Table 4.
Cox Univariate and Multivariate Regression Analyses Correlating the Incidence of Metastasis in 688 UM Cases (SET3) for Which Chromosomes 3, 1p, 6, and 8 Copy Number Status Was Available
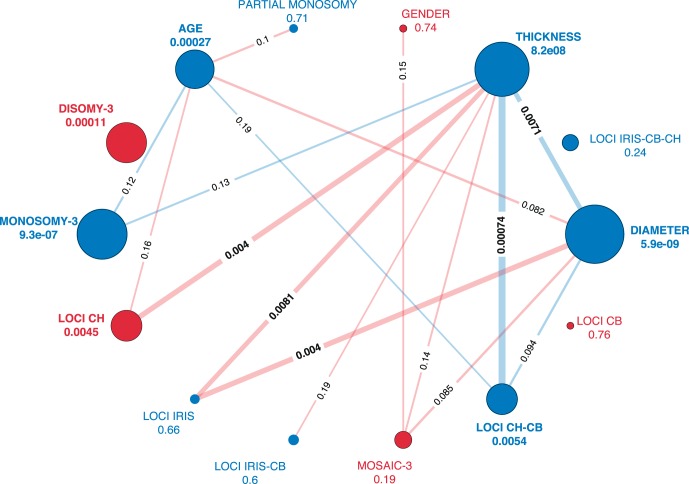
These results were largely recapitulated using an alternative approach using information content analysis to assess statistical enrichment for any of these variables with metastatic outcome (two-sided Fisher exact test, see nodes in Fig. 2). Sex was the only variable that did not replicate the findings from the univariate Cox models (Table 2). We also assessed the statistical enrichment between all pairs of variables (see edges in Fig. 2). There was a significant association between tumor thickness, diameter, and location. Indeed, tumor thickness had the highest number of significant associations (n = 6) with other variables, including chromosome 3 monosomy. This finding was consistent when we considered the additional chromosomal features in Set 3 (Supplementary Fig. S1). In general, chromosomal features were highly associated with one another, as indicated by thicker edges in Figure 2 and Supplementary Figure S1, whereas tumor thickness had many weak associations with clinical and chromosomal features (thin lines). For example, we observe a significant association between monosomy-3 and chromosome 8q gain (P = 0.002). Given these complex interactions in our feature space, we focused on developing a multivariate model.
Figure 2.
Information content measure for SET2 features based on a two-sided Fisher exact test between the features and the true labels of the nodes (metastasis yes/no) and the information content between the features (edges). The color indicates negative (red) or positive (blue) correlation. The size of the nodes and the width of the edges show their significance (larger indicates lower P value). P values less than 0.2 are indicated on the edges connecting the nodes. P values measuring the correlation between the individual features and metastatic outcome are indicated adjacent to the node. Chromosome 3 monosomy and disomy, tumor thickness and diameter, CH, and CH-CB location are all highly correlated with metastatic outcome. Tumor diameter or thickness is also correlated with some locations.
We then evaluated the concept that interaction of multiple features contribute to risk of metastasis with a Cox multivariate model (Table 2), which included all 11 features. Male sex (P < 0.001), tumor diameter (P < 0.001), chromosome 3 monosomy (P = 0.027), 1p loss (P = 0.028), 8p loss (P = 0.001), 8q gain (P = 0.007), and 6p gain (protective, P = 0.006) remained significantly associated with metastasis after adjusting for the effects of all other features. Iris-CB or iris CB-CH (P = 0.008) tumor location and a mosaic chromosome 3 pattern (P = 0.027) were also significant despite not being significant in the univariate analysis. These 11 features were therefore used in building an algorithm to yield precise personalized prediction of risk of metastasis within 48 months following initial treatment.
Development and Implementation of the PRiMeUM Model
To develop a multivariate prognostic classifier, we next evaluated machine learning algorithms. We tested a number of alternative models, including a mixture of decision trees, logistic regression, standard Cox survival models, and random survival trees34 (see Supplementary Methods). We found that for our dataset, boosting over decision trees35 and logistic regression had similar performance, whereas the other models suffered from lower accuracy or higher variability (data not shown). We therefore selected the simpler logistic regression model to build our prognostic classifier.
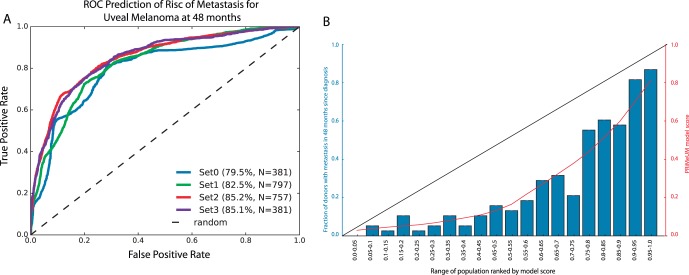
Our basic model that used clinical and tumor features had an accuracy of 83% for predicting risk of metastasis at 48 months following diagnosis (Fig. 3A, SET1). Adding chromosome 3 information to the basic model increased its accuracy to 85% (SET2). Adding chromosomes 1p, 6, and 8 data (SET3) did not increase the accuracy beyond 85% despite all features being informative. This was probably a result of the smaller number of cases used to train the latter model. Figure 2A also demonstrated that, relative to an accuracy of 79.6% for SET0 features (chromosomal information only), a 3% to 6% increase in the accuracy of the prediction of risk of metastasis was achieved by adding clinical (age and sex) and tumor (size and location) information to chromosomal information (SET2 and SET3, respectively).
Figure 3.
Model accuracy and calibration. (A) Receiver Operator Curve of the PRiMeUM models based on different feature sets. The percentage indicates the accuracy (as measured by the AUC); N = total number of cases used for the model validation. SET0 is a base model using only chromosomal information. SET1 tumors have clinical features, but no chromosome information. SET2 have clinical features and chromosome 3 data, and SET3 has clinical features plus chromosome 3, 1p, 6p, 6q, 8p, and 8q data. (B) Distribution of the training cohort based on equally probable model scores. The x-axis shows the range of the population, and the y-axis is the frequency of metastases in that group. The red line shows the mean score per bin, indicating a good calibration of the model toward the whole cohort.
As seen in Figure 3B, the PRS based on the 797 labeled cases corresponded well with the raw model score (red line) generated by the logistic regression model. For example, individuals with a raw model score of 0.13 were in the 40% to 45% percentile group, where 4 of 38 individuals developed metastasis. This translated to a predicted risk of metastasis of 10.9% within 48 months. This PRS approach captured the large training cohort available for our study and enabled clear clinical interpretation of the model output compared to using the output of the logistic regression model alone.
Critically, the individualized PRS were highly predictive of metastasis as shown by Kaplan-Meier analysis in Figure 4. Cases were split into five groups based on their individualized risk score, which resulted in significant discrimination for risk of metastasis (P < 0.0001). These results indicated that 50% of patients fell in the lowest risk group (0%-20%) and were unlikely to develop metastasis within 48 months, whereas a risk score >60% was associated with a particularly poor prognosis.
Figure 4.
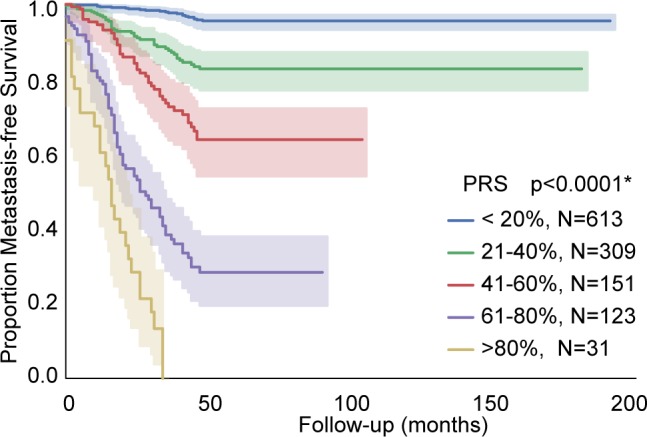
Kaplan-Meier curves showing metastasis-free survival stratified by the PRS categorized in intervals of 20% each. *Log-rank test P value.
PRiMeUM Web-Based Tool
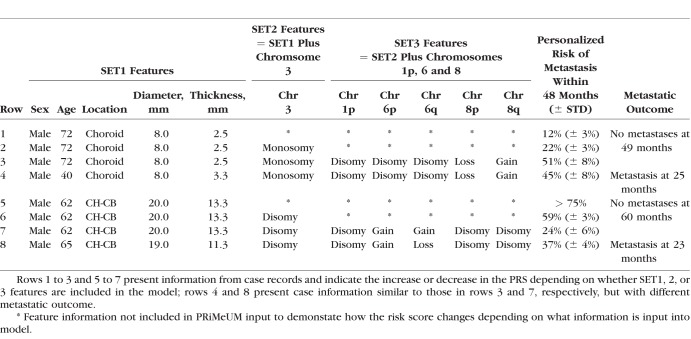
To translate the metastasis prediction model into a tool for clinical use, we developed the PRiMeUM web tool. The PRiMeUM model was trained using the entire cohort of 1227 UM to maximize accuracy as opposed to the 10-fold cross validation approach described above. Based on a Galaxy server,36 PRiMeUM allows clinicians to input clinical and/or chromosomal data and provides the PRS score as an estimate of the individualized risk of metastasis within 48 months. The input page requires the individual's age and sex and tumor diameter, thickness, and location. Optional fields include chromosome 3 plus 1p, 6p, 6q, 8p, and 8q status, if available (Fig. 1A). The output from executing PRiMeUM is presented in a downloadable and printable document for clinicians to easily interpret and share with their patients (Fig. 1B). Table 5 shows examples of PRiMeUM's PRS for different combinations of features, indicating how changing sex, tumor size, or location or the addition of chromosome 3, 1p, 6, and 8 statuses can change the predicted metastatic risk score. Profiles presented in rows 1 to 3 show that adding chromosome 3, 1p, 8p, and 8q information to a small, choroidal tumor increased the risk score from 12% to 51%. Alternatively, in rows 5 to 7 it can be seen that a large choroid tumor with ciliary body involvement had a risk of metastasis of >75%, but adding information about chromosomal status decreased the risk to 24%. The profiles in rows 4 and 8 are similar to those shown in rows 3 and 7, respectively, but with different metastatic outcomes reflecting the model's inaccuracy rate of 15%, and suggesting the existence of additional risk factors. PRiMeUM provides a tool that simultaneously takes into account a large set of features previously known to contribute individually to the risk of metastasis in a single, combined personalized risk score for metastatic risk.
Table 5.
Examples of PRiMeUM Individualized UM Metastatic PRS
Discussion
The aim of precision medicine in cancer is to use clinical profiles of individuals and genetic profiles of tumors for accurate prognostic classification and to facilitate best clinical management paradigms. In the field of UM management, multiple tumor classification models have been adopted that include clinical and tumor characteristics, chromosomal profiles, and/or gene expression profiles. Two recent publications report combining two traditional predictors of metastasis to provide models with increased prognostic value: AJCC staging with chromosome 3 and 8q status17 and GEP with tumor diameter.25
In UM, the overall population risk of metastases is projected to be as high as 50%2; however, this population risk does not provide a personalized risk for the individual that could be considerably less (or greater) than 50%. In one survey of individuals who underwent UM testing, 97% of participants reported that they would like to receive prognostic information even when no prophylactic adjuvant therapies were available.37 Even if the prognostic result suggested an increased risk of metastasis, the participants indicated a heightened sense of control and reduction in uncertainty and accompanying anxiety.37–39 The estimated risk of metastasis calculated based on the PRiMeUM model is reported in the range between 15% and 75% and takes into account the observed misclassification rate of approximately 15%. The main advantage is that this is an individualized risk estimate, which is different from population-based risk estimates.
In addition to developing a model for individualized risk score, a further motivation for developing PRiMeUM is that in many cases the chromosomal and clinical features are not always correlated. From our experience, there can be small tumors with disomy 3 that metastasize soon after diagnosis, whereas large, monosomy 3 tumors do not.20 These findings can be partially explained by the presence of tumor heterogeneity.40–42 Both PRiMeUM and GEP24 use information gathered from a single-site FNAB or tumor biopsy. Data from Ewens et al.4 and Augsburger et al.43 indicate 10% to 13% discordance between FNAB samples from the same tumor, thus it is likely that tumor heterogeneity may explain a significant proportion of the misclassification rates for both models. Other contributing factors could include additional prognostic factors that are not captured by the model including both genetic and epidemiological factors. For LUMPO,27,28 information derived from cytology, including the cellular nature of the sample and the mitotic index, are included. Because of the small number of cells collected during the FNAB procedure, it was not feasible to collect this information for the current data series and it was not included in the PRiMeUM model.
Another limitation of most prognostic models, including the PRiMeUM, is that not all risk factors have been identified. An increasing number of studies are showing that mutations in genes such as BAP1, SF3B1, and EIF1AX and expression of PRAME19–21,44–47 are associated with increased or decreased risk of metastases. Whole-genome, whole-exome, and cancer panel studies48,49 are also likely to identify additional potential risk (or protective) genes. Although the UM survival rate was not shown to improve between 1973 and 2008, it has been acknowledged that prognostication in UM is evolving as better markers are identified.50,51
The benefits of such a prognostic model are obvious. It empowers the individual with additional, accurate information concerning their future prognosis, can aid the medical oncologist with decisions concerning frequency of systemic surveillance and can be used as a criterion for entering clinical trials for adjuvant therapies. The utility of the PRiMeUM prognostic model, in comparison with the GEP molecular classification model23,25 is that it can be run using data routinely collected at the time of UM treatment and does not require the input of either chromosome copy number status or gene expression values. In addition, PRiMeUM is designed to predict the risk of metastasis within 48 months of treatment rather than melanoma-specific mortality that necessitates comparison with the appropriate population-based survival statistics.28,29 The results of PRiMeUM are easily interpretable, and it is openly available to physicians and genetic counselors.
For the future, the availability of larger data sets with additional labeled individuals and longer follow-up times will further increase the accuracy of the model. However, in trying to achieve this goal, one is limited by the lack of current follow-up information because of the loss of individuals who are followed by their local providers and the observations that lower risk individuals may not return to their original surgical oncologists.
Prognostic models are only as accurate as the data on which they are based and may be collected differently in different centers. They require frequent reassessment, recalibration, and validation by other centers.52 In developing PRiMeUM, several different types of models for classification were evaluated, including both linear and nonlinear regression. The model was designed such that as additional informative features are identified and as the science of UM evolves, it can be updated to accommodate this new information. It is also possible that with additional features and a larger dataset we could improve the model by revisiting other model designs or trying other nonlinear, regression-based approaches. Although the current version of PRiMeUM provides an accuracy rate of approximately 85%, this rate will likely increase in future iterations as additional UM cases having longer follow-up times are incorporated into the training set. Furthermore, the model can easily be extended to incorporate new risk factors that are identified.
In summary, PRiMeUM provides a tool to allow physicians and genetic counselors to estimate an individual's risk of metastasis with 48 months with an accuracy of 83% when only clinical and tumor characteristics are used and 85% when chromosomal copy number status is known as well. Given that 97% of individuals with UM responded that they wanted prognostic information at the time of treatment,37 the general availability of PRiMeUM will provide an important source of information on which to base decisions of UM management and surveillance.
Supplementary Material
Acknowledgments
Supported in part by grants from the National Institute on Aging (R01 AG046544) (YB), the Penn Institute for Biomedical Informatics Pilot Grant (YB), and from the National Cancer Institute (5R21CA181935) (AG).
Disclosure: J. Vaquero-Garcia, None; E. Lalonde, None; K.G. Ewens, None; J. Ebrahimzadeh, None; J. Richard-Yutz, None; C.L. Shields, None; A. Barrera, None; C.J. Green, None; Y. Barash, None; A. Ganguly, None
References
- 1.Paul EV, Parnell BL, Fraker M. Prognosis of malignant melanomas of the choroid and ciliary body. Int Ophthalmol Clin. 1962;2:387–402. [Google Scholar]
- 2.Kujala E, Mäkitie T, Kivelä T. Very long-term prognosis of patients with malignant uveal melanoma. Invest Ophthalmol Vis Sci. 2003;44:4651–4659. doi: 10.1167/iovs.03-0538. [DOI] [PubMed] [Google Scholar]
- 3.Damato B, Coupland SE. A reappraisal of the significance of largest basal diameter of posterior uveal melanoma. Eye. 2009;23:2152–2162. doi: 10.1038/eye.2009.235. [DOI] [PubMed] [Google Scholar]
- 4.Ewens KG, Kanetsky PA, Richards-Yutz J, et al. Genomic profile of 320 uveal melanoma cases: chromosome 8p-loss and metastatic outcome. Invest Ophthalmol Vis Sci. 2013;54:5721–5729. doi: 10.1167/iovs.13-12195. [DOI] [PubMed] [Google Scholar]
- 5.Kujala E, Damato B, Coupland SE, et al. Staging of ciliary body and choroidal melanomas based on anatomic extent. J Clin Oncol. 2013;31:2825–2831. doi: 10.1200/JCO.2012.45.2771. [DOI] [PubMed] [Google Scholar]
- 6.Shields CL, Furuta M, Thangappan A, et al. Metastasis of uveal melanoma millimeter-by-millimeter in 8033 consecutive eyes. Arch Ophthalmol. 2009;127:989–998. doi: 10.1001/archophthalmol.2009.208. [DOI] [PubMed] [Google Scholar]
- 7.Shields CL, Kaliki S, Furuta M, Mashayekhi A, Shields JA. Clinical spectrum and prognosis of uveal melanoma based on age at presentation in 8,033 cases. Retina. 2012;32:1363–1372. doi: 10.1097/IAE.0b013e31824d09a8. [DOI] [PubMed] [Google Scholar]
- 8.Zloto O, Pe'er J, Frenkel S. Gender differences in clinical presentation and prognosis of uveal melanoma. Invest Ophthalmol Vis Sci. 2013;54:652–656. doi: 10.1167/iovs.12-10365. [DOI] [PubMed] [Google Scholar]
- 9.Shields CL, Say EAT, Hasanreisoglu M, et al. Cytogenetic abnormalities in uveal melanoma based on tumor features and size in 1059 patients: the 2016 W. Richard Green Lecture. Ophthalmology. 2017;124:609–618. doi: 10.1016/j.ophtha.2016.12.026. [DOI] [PubMed] [Google Scholar]
- 10.Aalto Y, Eriksson L, Seregard S, Larsson O, Knuutila S. Concomitant loss of chromosome 3 and whole arm losses and gains of chromosome 1, 6, or 8 in metastasizing primary uveal melanoma. Invest Ophthalmol Vis Sci. 2001;42:313–317. [PubMed] [Google Scholar]
- 11.Damato B, Dopierala JA, Coupland SE. Genotypic profiling of 452 choroidal melanomas with multiplex ligation-dependent probe amplification. Clin Cancer Res. 2010;16:6083–6092. doi: 10.1158/1078-0432.CCR-10-2076. [DOI] [PubMed] [Google Scholar]
- 12.Kilic E, Naus NC, van Gils W, et al. Concurrent loss of chromosome arm 1p and chromosome 3 predicts a decreased disease-free survival in uveal melanoma patients. Invest Ophthalmol Vis Sci. 2005;46:2253–2257. doi: 10.1167/iovs.04-1460. [DOI] [PubMed] [Google Scholar]
- 13.Onken MD, Worley LA, Harbour JW. A metastasis modifier locus on human chromosome 8p in uveal melanoma identified by integrative genomic analysis. Clin Cancer Res. 2008;14:3737–3745. doi: 10.1158/1078-0432.CCR-07-5144. [DOI] [PubMed] [Google Scholar]
- 14.van den Bosch T, van Beek JGM, Vaarwater J, et al. Higher percentage of FISH-determined monosomy 3 and 8q amplification in uveal melanoma cells relate to poor patient prognosis. Invest Ophthalmol Vis Sci. 2012;53:2668–2674. doi: 10.1167/iovs.11-8697. [DOI] [PubMed] [Google Scholar]
- 15.Shields CL, Kaliki S, Furuta M, Fulco E, Alarcon C, Shields JA. American Joint Committee on Cancer Classification of posterior uveal melanoma (tumor size category) predicts prognosis in 7731 patients. Ophthalmology. 2013;120:2066–2071. doi: 10.1016/j.ophtha.2013.03.012. [DOI] [PubMed] [Google Scholar]
- 16.Shields CL, Kaliki S, Furuta M, Fulco E, Alarcon C, Shields JA. American Joint Committee on Cancer Classification of uveal melanoma (anatomic stage) predicts prognosis in 7731 patients: the 2013 Zimmerman Lecture. Ophthalmology. 2015;122:1180–1186. doi: 10.1016/j.ophtha.2015.01.026. [DOI] [PubMed] [Google Scholar]
- 17.Dogrusöz M, Bagger M, van Duinen SG, et al. The prognostic value of AJCC staging in uveal melanoma is enhanced by adding chromosome 3 and 8q status. Invest Ophthalmol Vis Sci. 2017;58:833–842. doi: 10.1167/iovs.16-20212. [DOI] [PubMed] [Google Scholar]
- 18.Kivela T, Simpson ER, Grossniklaus HE, et al. Amin MB. AJCC Cancer Staging Manual 8th ed. New York: Springer;; 2017. Uveal melanoma; pp. 805–817. [Google Scholar]
- 19.Decatur CL, Ong E, Garg N, et al. Driver mutations in uveal melanoma: associations with gene expression profile and patient outcomes. JAMA Ophthalmol. 2016;134:728–733. doi: 10.1001/jamaophthalmol.2016.0903. [DOI] [PMC free article] [PubMed] [Google Scholar]
- 20.Ewens KG, Kanetsky PA, Richards-Yutz J, et al. Chromosome 3 status combined with BAP1 and EIF1AX mutation profiles are associated with metastasis in uveal melanoma. Invest Ophthalmol Vis Sci. 2014;55:5160–5167. doi: 10.1167/iovs.14-14550. [DOI] [PubMed] [Google Scholar]
- 21.Field MG, Decatur CL, Kurtenbach S, et al. PRAME as an independent biomarker for metastasis in uveal melanoma. Clin Cancer Res. 2016;22:1234–1242. doi: 10.1158/1078-0432.CCR-15-2071. [DOI] [PMC free article] [PubMed] [Google Scholar]
- 22.Onken MD, Worley LA, Char DH, et al. Collaborative Ocular Oncology Group Report Number 1: prospective validation of a multi-gene prognostic assay in uveal melanoma. Ophthalmology. 2012;119:1596–1603. doi: 10.1016/j.ophtha.2012.02.017. [DOI] [PMC free article] [PubMed] [Google Scholar]
- 23.Onken MD, Worley LA, Ehlers JP, Harbour JW. Gene expression profiling in uveal melanoma reveals two molecular classes and predicts metastatic death. Cancer Res. 2004;64:7205–7209. doi: 10.1158/0008-5472.CAN-04-1750. [DOI] [PMC free article] [PubMed] [Google Scholar]
- 24.Onken MD, Worley LA, Tuscan MD, Harbour JW. An accurate, clinically feasible multi-gene expression assay for predicting metastasis in uveal melanoma. J Mol Diagn. 2010;12:461–468. doi: 10.2353/jmoldx.2010.090220. [DOI] [PMC free article] [PubMed] [Google Scholar]
- 25.Walter SD, Chao DL, Feuer W, Schiffman J, Char DH, Harbour J. Prognostic implications of tumor diameter in association with gene expression profile for uveal melanoma. JAMA Ophthalmol. 2016;134:734–740. doi: 10.1001/jamaophthalmol.2016.0913. [DOI] [PMC free article] [PubMed] [Google Scholar]
- 26.Worley LA, Onken MD, Person E, et al. Transcriptomic versus chromosomal prognostic markers and clinical outcome in uveal melanoma. Clin Cancer Res. 2007;13:1466–1471. doi: 10.1158/1078-0432.CCR-06-2401. [DOI] [PubMed] [Google Scholar]
- 27.Damato B, Eleuteri A, Taktak AF, Coupland SE. Estimating prognosis for survival after treatment of choroidal melanoma. Prog Retin Eye Res. 2011;30:285–295. doi: 10.1016/j.preteyeres.2011.05.003. [DOI] [PubMed] [Google Scholar]
- 28.Eleuteri A. Bertil Damato B, Coupland SE, Taktak AF. Enhancing survival prognostication in patients with choroidal melanoma by integrating pathologic, clinical and genetic predictors of metastasis. Int J Biomed Eng Technol. 2012;8:18–35. [Google Scholar]
- 29.DeParis SW, Taktak A, Eleuteri A, et al. External validation of the Liverpool uveal melanoma prognosticator online. Invest Ophthalmol Vis Sci. 2016;57:6116–6122. doi: 10.1167/iovs.16-19654. [DOI] [PubMed] [Google Scholar]
- 30.McLaughlin CC, Wu X-C, Jemal A, Martin HJ, Roche LM, Chen VW. Incidence of noncutaneous melanomas in the U.S. Cancer. 2005;103:1000–1007. doi: 10.1002/cncr.20866. [DOI] [PubMed] [Google Scholar]
- 31.Cover TM, Thomas JA. Elements of Information Theory. Hoboken, NJ: John Wiley & Sons;; 1991. [Google Scholar]
- 32.Fan R-E, Chang K-W, Hsieh C-J, Wang X-R, Lin C-J. LIBLINEAR: a library for large linear classification. J Machine Learning Res. 2008;9:1871–1874. [Google Scholar]
- 33.Elkan C, Noto K. Learning classifiers from only positive and unlabeled data. In: Proceedings of the 14th ACM SIGKDD International Conference on Knowledge Discovery and Data Mining. New York, NY: ACM. 2008. pp. 213–220.
- 34.Ishwaran H, Udaya B, Kogalur UB, Blackstone EH, Lauer MS. Random survival forests. Ann Appl Stat. 2008;2:841–860. [Google Scholar]
- 35.Friedman JH. Greedy function approximation: a gradient boosting machine. Ann Appl Stat. 2001;29:1189–1232. [Google Scholar]
- 36.Afgan E, Baker D, van den Beek M, et al. The Galaxy platform for accessible, reproducible and collaborative biomedical analyses: 2016 update. Nucleic Acids Res. 2016;44:W3–W10. doi: 10.1093/nar/gkw343. [DOI] [PMC free article] [PubMed] [Google Scholar]
- 37.Beran TM, McCannel TA, Stanton AL, Straatsma BR, Burgess BL. Reactions to and desire for prognostic testing in choroidal melanoma patients. J Genet Couns. 2009;18:265–274. doi: 10.1007/s10897-009-9223-2. [DOI] [PMC free article] [PubMed] [Google Scholar]
- 38.Cook SA, Damato B, Marshall E, Salmon P. Psychological aspects of cytogenetic testing of uveal melanoma: preliminary findings and directions for future research. Eye. 2008;23:581–585. doi: 10.1038/eye.2008.54. [DOI] [PubMed] [Google Scholar]
- 39.Erim Y, Scheel J, Breidenstein A, et al. Psychosocial impact of prognostic genetic testing in the care of uveal melanoma patients: protocol of a controlled prospective clinical observational study. BMC Cancer. 2016;16:408. doi: 10.1186/s12885-016-2479-7. [DOI] [PMC free article] [PubMed] [Google Scholar]
- 40.Bronkhorst IHG, Maat W, Jordanova ES, et al. Effect of heterogeneous distribution of monosomy 3 on prognosis in uveal melanoma. Arch Pathol Lab Med. 2011;135:1042–1047. doi: 10.5858/2010-0477-OAR1. [DOI] [PubMed] [Google Scholar]
- 41.Dopierala J, Damato BE, Lake SL, Taktak AFG, Coupland SE. Genetic heterogeneity in uveal melanoma assessed by multiplex ligation-dependent probe amplification. Invest Ophthalmol Vis Sci. 2010;51:4898–4905. doi: 10.1167/iovs.09-5004. [DOI] [PubMed] [Google Scholar]
- 42.Schoenfield L, Pettay J, Tubbs RR, Singh AD. Variation of monosomy 3 status within uveal melanoma. Arch Pathol Lab Med. 2009;133:1219–1222. doi: 10.5858/133.8.1219. [DOI] [PubMed] [Google Scholar]
- 43.Augsburger JJ, Corrêa ZM, Augsburger BD. Frequency and implications of discordant gene expression profile class in posterior uveal melanomas sampled by fine needle aspiration biopsy. Am J Ophthalmol. 2015;159:248–256. doi: 10.1016/j.ajo.2014.10.026. [DOI] [PMC free article] [PubMed] [Google Scholar]
- 44.Harbour JW, Onken MD, Roberson EDO, et al. Frequent mutation of BAP1 in metastasizing uveal melanomas. Science. 2010;330:1410–1413. doi: 10.1126/science.1194472. [DOI] [PMC free article] [PubMed] [Google Scholar]
- 45.Kalirai H, Dodson A, Faqir S, Damato BE, Coupland SE. Lack of BAP1 protein expression in uveal melanoma is associated with increased metastatic risk and has utility in routine prognostic testing. Br J Cancer. 2014;111:1373–1380. doi: 10.1038/bjc.2014.417. [DOI] [PMC free article] [PubMed] [Google Scholar]
- 46.van Essen TH, van Pelt SI, Versluis M, et al. Prognostic parameters in uveal melanoma and their association with BAP1 expression. Br J Ophthalmol. 2014;98:1738–1743. doi: 10.1136/bjophthalmol-2014-305047. [DOI] [PMC free article] [PubMed] [Google Scholar]
- 47.Yavuzyigitoglu S, Koopmans AE, Verdijk RM, et al. Uveal melanomas with SF3B1 mutations: a distinct subclass associated with late-onset metastases. Ophthalmology. 2016;123:1118–1128. doi: 10.1016/j.ophtha.2016.01.023. [DOI] [PubMed] [Google Scholar]
- 48.Luscan A, Just PA, Briand A, et al. Uveal melanoma hepatic metastases mutation spectrum analysis using targeted next-generation sequencing of 400 cancer genes. Br J Ophthalmol. 2015;99:437–439. doi: 10.1136/bjophthalmol-2014-305371. [DOI] [PubMed] [Google Scholar]
- 49.Royer-Bertrand B, Torsello M, Rimoldi D, et al. Comprehensive genetic Landscape of uveal melanoma by whole-genome sequencing. Am J Hum Genet. 2016;99:1190–1198. doi: 10.1016/j.ajhg.2016.09.008. [DOI] [PMC free article] [PubMed] [Google Scholar]
- 50.Singh AD, Turell ME, Topham AK. Uveal melanoma: trends in incidence, treatment, and survival. Ophthalmology. 2011;118:1881–1885. doi: 10.1016/j.ophtha.2011.01.040. [DOI] [PubMed] [Google Scholar]
- 51.Singh AD. Prognostication of uveal melanoma: a work in progress. JAMA Ophthalmology. 2016;134:740–741. doi: 10.1001/jamaophthalmol.2016.1070. [DOI] [PubMed] [Google Scholar]
- 52.Pavlou M, Ambler G, Seaman SR, et al. How to develop a more accurate risk prediction model when there are few events. BMJ. 2015;351:h3868. doi: 10.1136/bmj.h3868. [DOI] [PMC free article] [PubMed] [Google Scholar]
Associated Data
This section collects any data citations, data availability statements, or supplementary materials included in this article.


