Abstract
Purpose
This study was designed to develop and characterize a laser-induced model of acute intraocular hypertension that permits the study of the anterior segment of the eye.
Methods
CD1 mice aged 5 and 8 weeks were examined for elevation of IOP induced by laser photocoagulation. We compared between occlusion of episcleral veins alone and when combined with 270° limbal vessel occlusion. Anterior chamber angle, corneal thickness, and retinal nerve fiber layer (RNFL) thickness were evaluated by anterior- and posterior-segment optical coherence tomography (OCT). Additionally, at day 7 post-procedure, the anterior segment was evaluated for inflammatory cellular presentation by histologic analysis and OCT, and limbal vessels and whole-mount retina were immunostained for CD31 and Brn3a, respectively. Brn3a-positive retinal ganglion cells (RGCs) were quantified with ImageJ software.
Results
After single or combined laser treatment in mice aged 5 or 8 weeks, IOP was significantly elevated for 5 to 6 days before returning to the baseline by day 7 post-procedure. Anterior segment assessment indicated less synechiae in the anterior chamber angle and better preserved limbal vessels with single versus combined laser treatment. Corneal thickness was significantly increased after single or combined treatment. No inflammatory cells were detected in the anterior chamber. The thickness of the RNFL and the density of RGCs were both significantly reduced after single or combined treatment.
Conclusions
Laser photocoagulation of episcleral veins alone in CD1 mice aged 5 to 8 weeks may be used to induce ocular hypertension resulting in RNFL thinning and ganglion cell loss. This model permits the study of the anterior as well as the posterior segment of the eye.
Keywords: ocular hypertension, laser photocoagulation, glaucoma, animal model, episcleral vein
Glaucoma is a leading cause of irreversible blindness. It is estimated that 111.8 million people will be affected by this disease worldwide in 2040.1 Given its importance and multifacets, the mechanisms underlying glaucoma have been studied extensively but are not yet fully understood.2–7 We recently reported the first evidence that Schlemm's canal, a critical structure involved in aqueous humor drainage, expresses Prox-1, the master control gene for lymphatic development.8 This novel finding aligns well with several succeeding reports showing that Schlemm's canal is a VEGF-C/VEGFR-3 responsive lymphatic-like vessel and Prox-1 determines its integrity and identity.9,10 We are therefore interested in studying the structures located at the anterior chamber angle and exploring possible new mechanisms and therapeutic targets for glaucoma.
The purpose of this study was to develop a mouse model of acute intraocular hypertension that permits the study of the anterior segment of the eye. While a variety of mouse models have been developed to establish elevated IOP for glaucoma research, it is acknowledged that they are all bound by limitations. Nevertheless, depending on the subject of interest, it is possible to choose or develop a specific model to best approach individual research goals. Recently, an animal model of elevated IOP and glaucoma was developed by injection of microbeads into the anterior chamber with subsequent blockage of the aqueous humor outflow pathway.11–13 While this model best suits studies of the posterior segment of the eye, its application to the anterior segment is limited by blockade and damage of the angle structures. Laser photocoagulation is another method to induce ocular hypertension. This method was first developed in rats using a hand-held ophthalmic cautery to induce chronic hypertension.14 It was later reported that chronic hypertension can also be achieved in mice using laser photocoagulation by targeting both the limbus and the episcleral veins,15 by targeting the limbus following anterior chamber cannulation,16 by targeting the trabecular meshwork through the limbus,17 or by targeting the trabecular meshwork and the episcleral veins.18 Fu et al.19 reported a mouse model of acute ocular hypertension by laser photocoagulation of both limbal and episcleral vessels, and with this model, IOP elevation returns to normal within 1 week post-procedure. All these models, whether of the acute or chronic type, cause damage to the anterior chamber angles and are thus not ideal for our research purpose.
In this paper, we present an acute ocular hypertension model in CD1 mice using laser-induced occlusion of the episcleral veins alone. This model, avoiding direct cautery on limbal vessels or nearby structures, overcomes barriers of other mouse models that hinder the study of the anterior chamber angle. By comparative analysis between occlusion of episcleral veins alone and when combined with 270° limbal vessel occlusion, we show that occlusion of episcleral veins alone in CD1 mice is effective in inducing IOP elevation for 1 week, and this insult also leads to thinning of the retinal nerve fiber layer (RNFL) and loss of retinal ganglion cells (RGCs). More importantly, this model is associated with less synechiae of the anterior chamber angle and thereby permits the study of both anterior and posterior segments of the eye. Because the structures of the iridocorneal angles of the mice mature by postnatal days 35 to 42,20 we studied mice as early as 5 weeks of age. In addition, mice aged 8 weeks that are more commonly used for adult stage study, were also investigated. Our study revealed similar results between the groups. Taken together, we have demonstrated that this model of laser-induced occlusion of the episcleral veins alone can be used to study both anterior and posterior segments of the eye, and it can be used in CD1 mice aged 5 to 8 weeks. Further investigations using this new model may facilitate the discovery and development of new mechanisms and treatment for glaucoma.
Methods
Animals
Five- and eight-week-old male CD1 mice (Charles River Laboratories, Wilmington, MA, USA) were used in the study. All animals were treated according to the ARVO Statement for the Use of Animals in Ophthalmic and Vision Research, and all protocols were approved by the animal care and use committee at the University of California, Berkeley. Mice were anesthetized using a mixture of ketamine, xylazine, and acepromazine (50 mg, 10 mg, and 1 mg/kg body weight, respectively) for each surgical procedure. This was complemented with topical anesthesia using 0.5% proparacaine hydrochloride ophthalmic solution (Bausch & Lomb, Rochester, NY, USA). Antibiotic ointment was applied after laser treatment.
Measurement of Intraocular Pressure
Intraocular pressure was measured by a noninvasive TonoLab tonometer (Icare Lab, Helsinki, Finland) under light general anesthesia with 2% isoflurane. The measurement was performed three times for each eye, with each instrument-generated average derived from six effective IOP measurements.
Laser Photocoagulation
Mice were randomized to receive unilateral laser photocoagulation (532 nm, OcuLight TX; IRIDEX Corporation, Mountain View, CA, USA) on the right eye using the parameter settings of power, treatment duration, and spot number. As illustrated in Supplementary Figure S1, for episcleral veins occlusion, the setting is 300 mW × 0.5 seconds × 70 to 80 spots; for combined laser photocoagulation with 270° limbal vessels (sparing nasal 90° aspect and long posterior ciliary artery), the setting is 300 mW × 0.5 seconds × 110 to 120 spots. The left eye was used as control. Intraocular pressure was measured pre- and post-laser treatment for 7 consecutive days in both eyes. Mice with IOP between 30 and 50 mm Hg in the right eye at day 1 after laser treatment were included in subsequent experiments. Mice of technical failure (i.e., hyphema) with IOP above 50 mm Hg, which occurred rarely (4/153), were excluded from the study.
Anterior and Posterior Segment Optical Coherence Tomography
The analysis was performed as previously reported.21–24 For evaluation of central corneal thickness and peripheral anterior synechiae, an anterior-segment optical coherence tomography (OCT; Visante OCT MODEL 1000; Carl Zeiss Meditec, Dublin, CA, USA) was used. Quadrant-scans along four axes (0°–180°, 45°–225°, 90°–270°, and 135°–315°) were performed to ensure scanning through the central cornea and data along the 0° to 180° axis were used for analysis. For evaluation of RNFL thickness, upon pupil dilation with 1% tropicamide ophthalmic solution (Akorn, Inc., Lake Forest, IL, USA), a posterior segment OCT (Envisu R2300; Bioptigen, Inc., Morrisville, NC, USA) was used to capture retinal cross-section images. A rectangular scanning sequence (3 × 3 mm) produced a single en face image of the retina using a customized mouse lens (50° field of view), which consisted of 100 B-scan images (each B-scan comprised 1000 A-scans). The B-scan images were analyzed with the manufacturer's InVivoVue Clinic software (Bioptigen, Inc.). Retinal nerve fiber layer thickness was measured in 4 quadrants (nasal, temporal, superior, and inferior) of the en face image by masked observers. Measurements at 400 μm from the center of the optic nerve head were performed within each quadrant. Consequently, a total of four readings were averaged to return a single thickness value. For evaluation of inflammatory cells in the anterior chamber, eyes pre- and 7 days after laser treatment were examined by high-resolution OCT and cellular presentation was evaluated as opaque dots that did not adhere to the cornea, iris, or lens, as previously reported.21,23
Hematoxylin and Eosin Stain
The experiment was performed as described previously.23,25–27 Laser-treated eyes at day 7 post-procedure were harvested and embedded in optimal cutting temperature compound (Tissue-Tek; Sakura Finetek, Torrance, CA, USA). Frozen sections (6 μm) were fixed with 4% paraformaldehyde and stained with hematoxylin (Fisher Scientific, Pittsburgh, PA, USA) and eosin (Leica Biosystems, Richmond, IL, USA) (H&E). Five to six sections per animal were evaluated for the presence of inflammatory cells in the anterior chamber.
Assessment of Limbal Vessels
The experiment was performed as described previously.24 Briefly, whole-mount limbal tissues were harvested at day 7 post-procedure, fixed in 4% paraformaldehyde, and immunostained with primary rat-anti-mouse CD31 antibody (BD Pharmingen, San Diego, CA, USA) that was visualized by Cy3-conjugated donkey anti-rat secondary antibody (Jackson-Immuno Research Laboratories, West Grove, PA, USA). Samples were mounted with Vectashield mounting medium (Vector Laboratories, Burlingame, CA, USA) and examined by an AxioImager M1 epifluorescence deconvolution microscope with AxioVision 4.8 software (Carl Zeiss AG, Göttingen, Germany).
Assessment of Retinal Ganglion Cell Density
The experiment was performed as described previously.28 Briefly, whole-mount retinae were harvested at day 7 post-procedure, fixed in methanol, and immunostained with primary goat-anti-mouse Brn3a antibody (Santa Cruz Biotechnology, Santa Cruz, CA, USA), which was recognized by Cy3-conjugated donkey anti-goat secondary antibody (Abcam, Cambridge, MA, USA). Samples were mounted with Vectashield mounting medium (Vector Laboratories) and examined by the AxioImager M1 epifluorescence deconvolution microscope with AxioVision 4.8 software (Carl Zeiss AG). For each retina, eight areas were randomly selected at a distance of 850 μm from the optical disc for data analysis.29 Digital images were analyzed to quantify the density of Brn-3a+ cells in each area (688 × 545 μm) using ImageJ software (http://imagej.nih.gov/ij/; provided in the public domain by the National Institutes of Health, Bethesda, MD, USA). The percentage scores were obtained by normalizing to control condition defined as being 100%.24
Statistical Analysis
Data were reported as mean ± SEM. The statistical significance between two groups was assessed by Student's t-test with Prism software (GraphPad, La Jolla, CA, USA). Mann-Whitney U test was performed for Figures 5 and 6. Fisher' exact test was used for Figure 2C and 3C with R Studio software (R Studio Inc., Boston, MA, USA). P less than 0.05 was considered significant.
Figure 5.
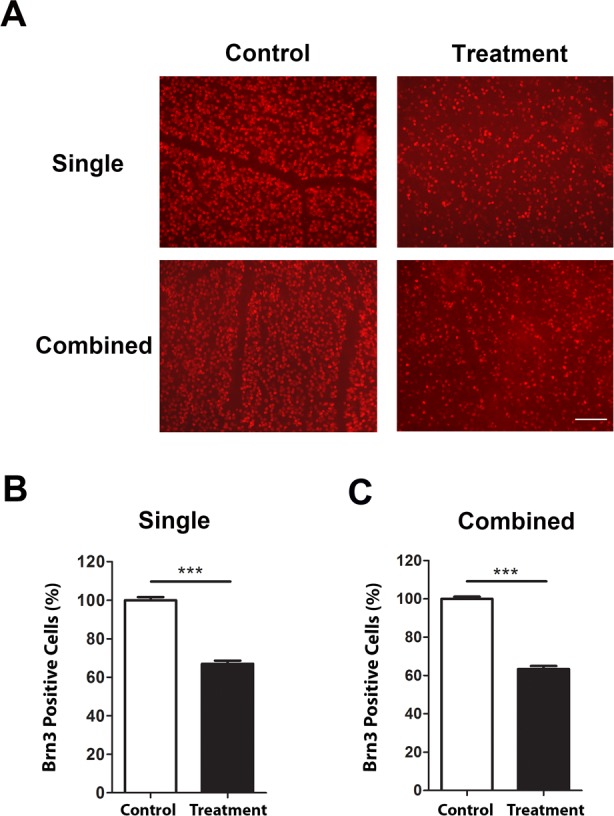
Immunofluorescent microscopic analysis of retinal ganglion cell loss after single or combined treatment in mice aged 5 weeks. (A) Representative images showing reduced Brn3a+ cells (red) in the retina 7 days after single (upper panels) or combined (lower panels) laser treatment, as compared with untreated contralateral retina. Scale bar, 100 μm. Summarized data are presented in (B) and (C) for single and combined treatment, respectively. ***P < 0.001 (n = 9/group).
Figure 6.
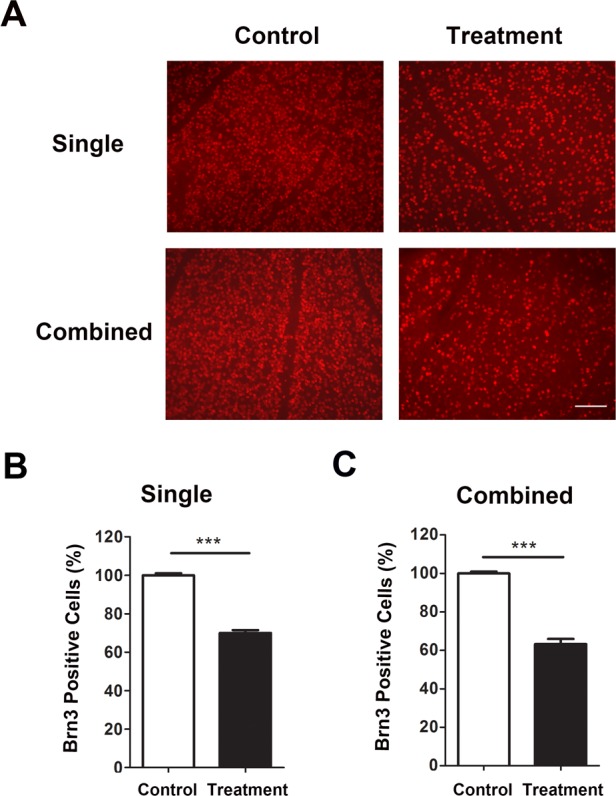
Immunofluorescent microscopic analysis of RGC loss after single or combined treatment in mice aged 8 weeks. (A) Representative images showing reduced Brn3a+ cells (red) in the retina 7 days after single (upper panels) or combined (lower panels) laser treatment, as compared with untreated contralateral retina. Scale bar: 100 μm. Summarized data are presented in (B) and (C) for single and combined treatment, respectively. ***P < 0.001 (n = 9/group).
Figure 2.
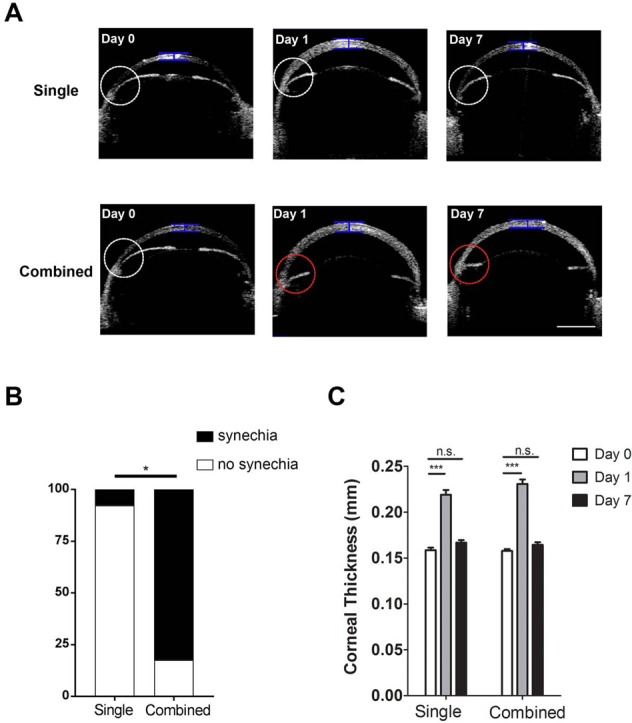
Anterior-segment OCT evaluation of central corneal thickness and anterior chamber angles in mice age 5 weeks. (A) Representative OCT images showing central corneal thickness and anterior chamber angles pre- (Day 0) and post-laser treatment on days 1 and 7 after the single or combined procedure. White circle indicates normal anterior chamber angle; red circle indicates synechiae at the angle with iris flattening; blue bar indicates site of measurement for central corneal thickness. Scale bar: 1 mm. (B) Summarized data showing significantly lower rate of synechiae in single than combined treatment. *P < 0.05 (n = 13–17/group). (C) Summarized and comparative data showing increased central corneal thickness at day 1 after single or combined treatment. No significant difference was found at day 7 after the procedures. ***P < 0.001. n.s., not significant (n = 10–12/group).
Figure 3.
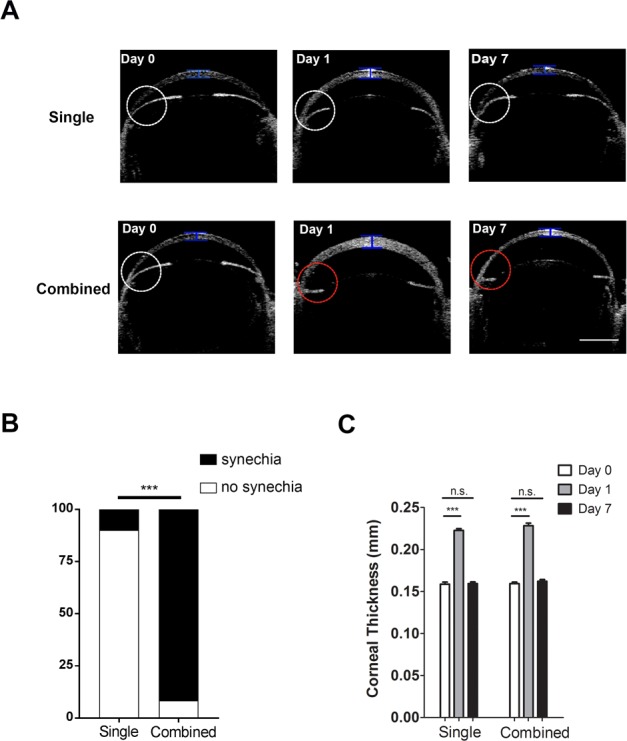
Anterior-segment OCT evaluation on central corneal thickness and anterior chamber angles in mice aged 8 weeks. (A) Representative OCT images showing central corneal thickness and anterior chamber angles pre- (Day 0) and post-laser treatment on days 1 and 7 after the single or combined procedure. White circle indicates normal anterior chamber angle; red circle indicates synechiae at the angle with iris flattening; blue bar indicates site of measurement for central corneal thickness. Scale bar: 1 mm. (B) Summarized data showing significantly lower rate of synechiae in single than combined treatment. *P < 0.001 (n = 10–12/group). (C) Summarized and comparative data showing increased central corneal thickness at day 1 after single or combined treatment. No significant difference was found at day 7 after the procedures. ***P < 0.001. n.s., not significant (n = 10–12/group).
Results
Comparative Analysis of Elevation of Intraocular Pressure Between Single and Combined Laser Treatment and Between Mice Aged 5 and 8 Weeks
Intraocular pressure is an important risk factor of glaucoma. We first set out to assess whether IOP elevation can be induced by laser photocoagulation of the episcleral veins alone, and how it compared with the combined treatment including limbal vessels. Because structures of the iridocorneal angles typically mature by postnatal day 35 to 42,20 we also compared the results between CD1 mice at 5 or 8 weeks of age. Our results on day 1 post-procedure showed that for mice 8 weeks of age, the success rates for mice reaching IOP between 30 and 50 mm Hg after the single and combined treatment are 60% and 63%, respectively, and the corresponding rates for mice 5 weeks of age are 61% and 70%, respectively. The mice with IOP between 30 and 50 mm Hg were included for further analysis.
As presented in Figure 1A, after single or combined laser treatment with mice aged 5 or 8 weeks, IOP was significantly elevated for 5 to 6 days before returning to the baseline by day 7 post-procedure. No significant difference was observed at each time point between mice aged 5 or 8 weeks in single or combined treatment (Fig. 1B). Our further analysis on short-term IOP changes at 4, 10, and 24 hours after laser treatment showed that IOP of the treated eyes was significantly elevated at 4 hours post-procedure and it remained above that of the control eyes at 10 and 24 hours post-procedure. No significant difference was observed between the single or combined treatment (Supplementary Fig. S2).
Figure 1.
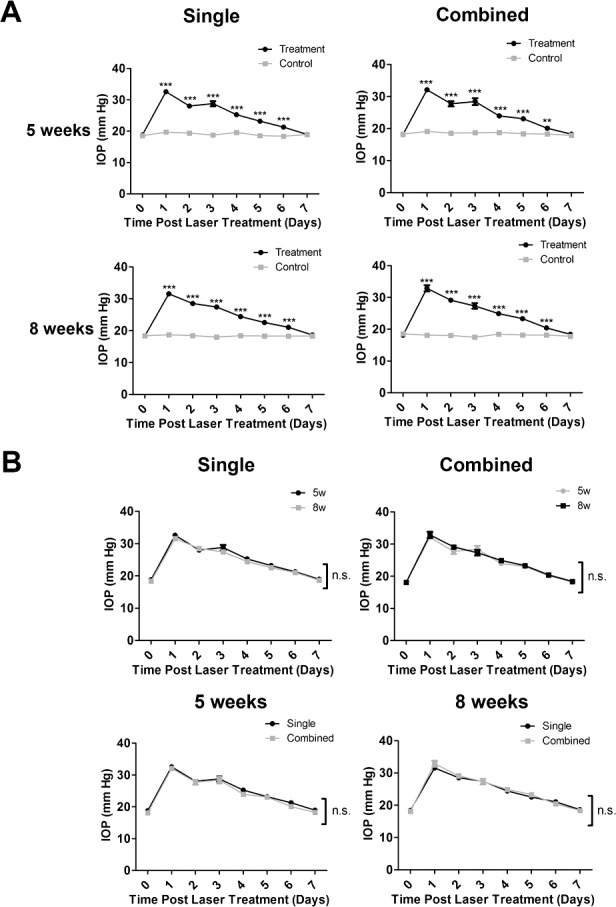
Intraocular pressure measurement with single or combined laser treatment in mice of 5 or 8 weeks of age. (A) Intraocular pressure elevation after single or combined laser treatment, as compared with control contralateral eyes, in mice aged 5 (n = 13–17/group) or 8 (n = 10–12/group) weeks. ***P < 0.001, **P < 0.01. (B) No significant difference was found between 5 (n = 13–17/group) and 8 (n = 10–12/group) weeks of age with single versus combined treatment. n.s., not significant.
Comparative Analysis of Peripheral Anterior Synechiae Between Single and Combined Laser Treatment and Between Mice Aged 5 and 8 Weeks
We next examined peripheral anterior synechiae (PAS) in the anterior chamber angle with anterior segment OCT,17 and compared the results between single and combined laser treatment, and between mice of 5 and 8 weeks of age. The presence of PAS with flattening iris,30 as demonstrated by representative OCT images in Figures 2A and 3A (red circles in lower panels), indicates laser-induced adherence of iris tissue to the nearby angle structures after the insult. As summarized in Figure 2B and 3B, our results from mice aged 5 weeks showed significantly higher incidence of PAS in the combined versus single treatment setting (82.35% vs. 7.69%), and this dramatic difference was also observed in mice aged 8 weeks (91.67% vs. 10.0%). Taken together, these data suggest that single laser treatment results in fewer PAS than the combined treatment.
Comparative Analysis of Central Corneal Thickness Between Single and Combined Laser Treatment and Between Mice Aged 5 and 8 Weeks
We also evaluated the thickness of the central cornea using anterior-segment OCT, an important parameter associated with IOP elevation and corneal edema. Our results in mice of 5 and 8 weeks of age (Figs. 2C and 3C, respectively) showed a similar pattern where corneal thickness was significantly increased with peak IOP at day 1 after single or combined treatment. By day 7 when IOP returned to baseline, no significant difference was detected with corneal thickness between treated and control eyes, in all experimental settings.
Assessment of Inflammatory Cells in the Anterior Chamber
Previously, it was reported that black Swiss mice after laser treatment at the limbus showed no evidence of inflammation in the anterior segment.26 In this study with the CD1 mice, we performed histologic analysis of laser-treated eyes on day 7 post-procedure with H&E staining, as previously reported.23 While our results confirmed the presence of PAS with combined laser treatment, no inflammatory cells were detected in the anterior chamber after single or combined laser treatment in mice aged 5 or 8 weeks (Supplementary Fig. S3). This negative result was also confirmed by high-resolution OCT where no cellular presentation, defined as opaque dots that did not adhere to the cornea, iris, or lens,21,23 was detected in the anterior chamber (Supplementary Fig. S4).
Assessment of Limbal Vessels
To assess the condition of limbal vessels after single or combined laser treatment, we performed immunofluorescent microscopic analysis using specific antibody against CD31, a panendothelial cell marker. As shown in Supplementary Figure S5, compared with combined treatment that resulted in significant loss of limbal vessels upon laser photocoagulation, single treatment better preserved these vessels, and this effect was observed in mice aged 5 and 8 weeks.
Comparative Analysis of Loss of Retinal Nerve Fibers Between Single and Combined Laser Treatment and Between Mice Aged 5 and 8 Weeks
The above data indicate that single laser occlusion of episcleral veins alone is effective in inducing acute IOP elevation and meanwhile preserving the anterior segment. Because glaucoma is a disease associated with optic nerve damage, we next assessed thinning of the RNFL by posterior segment OCT, and compared the results between single and combined laser treatment, and between mice of 5 and 8 weeks of age. As presented in Figure 4, this set of experiments again revealed a similar pattern between single and combined treatment, and between 5 and 8 weeks of age. The RNFL thickness at day 7 post-procedure was significantly reduced compared with day 0 in all experimental groups.
Figure 4.
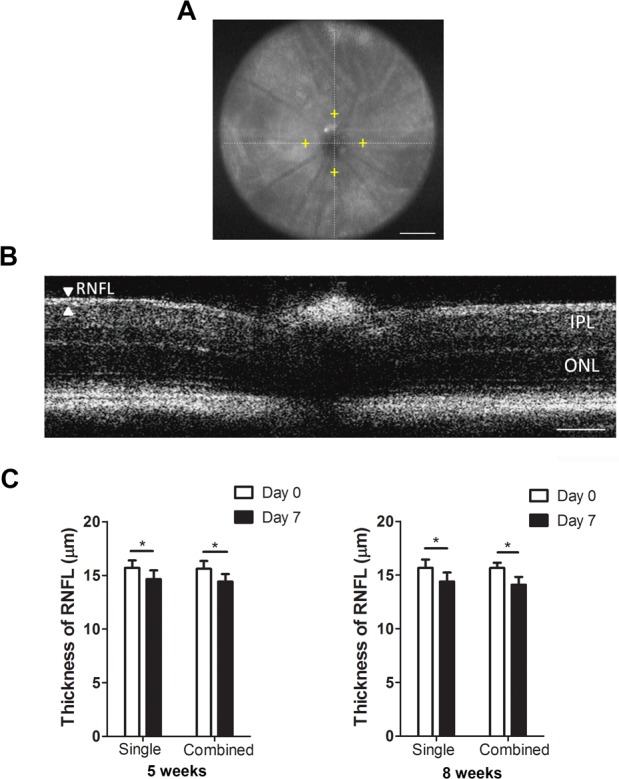
Posterior-segment OCT evaluation on the thickness of RNFL after single or combined laser treatment in mice aged 5 or 8 weeks. (A) Representative OCT image showing a normal retina of a CD1 mouse. Yellow cross shows the measurement location at 400-μm distance from the optic nerve head. Scale bar: 500 μm. (B) Representative posterior-segment OCT image of the RNFL layer and total retina in a normal CD1 mouse. Scale bar: 100 μm. (C) Summarized data showing significant reduced RNFL thickness at day 7 post procedure in mice aged 5 or 8 weeks in both single and combined treatment settings. *P < 0.05 (n = 16–18/group). IPL, inner plexiform layer; ONL, outer nuclear layer.
Comparative Analysis of Loss of Retinal Ganglion Cells Between Single and Combined Laser Treatment and Between Mice Aged 5 and 8 Weeks
Finally, we performed immunofluorescent microscopic assays with whole-mount retina and analyzed RGC loss with single and combined treatment, and with mice of 5 and 8 weeks of age (Figs. 5, 6). As demonstrated in Figures 5A and 6A, our results showed a significant reduction of Brn3a+ cells in all experimental settings. In mice 5 weeks of age, the density of Brn3a+ cells after single or combined treatment was decreased by 33.02% and 36.67%, respectively, compared with control. A similar pattern was observed with mice 8 weeks of age, and the corresponding reduction rates are 30.04% and 36.8%, respectively.
Discussion
In summary, we have presented in this study a new mouse model of laser photocoagulation with occlusion of the episcleral veins alone. This model is effective in the induction of acute intraocular hypertension, RNFL thinning, and RGC loss. Compared with the combined model of laser photocoagulation that requires additional occlusion of the limbal vessels, this single treatment model is of smaller scale and less invasive. More importantly, because this procedure spares the limbal area, it reduces the incidence of PAS and leave the anterior chamber angles open. This study thus offers a new model that permits the study of the anterior segment of the eye in addition to the posterior segment.
In this study, we assessed age as a factor and compared mice 5 and 8 weeks of age. Because structures of iridocorneal angles of mice mature by postnatal day 35 to 42,20 and our results demonstrate elevated IOP in both age groups, the laser model should be effective with mice aged 5 to 8 weeks. Considering a previous study demonstrating that there is no significant difference in IOP between CD1 mice 2- and 10-months old,31 it may be possible to extend the working range of this laser model to 10 months of age, which warrants further investigation.
Our model of single or combined treatment is able to induce IOP elevation within the first day before it returns to baseline levels in 1 week. This week-long period of IOP elevation causes a significant reduction of RGCs by 30% to 40%. Previously, hand-held cautery models were reported in rats and CD1 mice, respectively, by surgical incision through the conjunctiva and Tenon's capsule. Intraocular pressure elevation was achieved within the first day and remained elevated for 2.5 months in rats and 4 weeks in CD1 mice, respectively.14,32 While these models induce sustained IOP elevation, it is a more challenging procedure with invasive surgery that is associated with damage of surrounding tissues. In this study, as suggested by a previous report on combined laser treatment, we spared nasal 90° of the limbal vessels and the long posterior ciliary artery to avoid acute IOP spikes (>70 mm Hg within 12 hours) that could lead to severe ischemic changes, and we did not repeat the laser treatment to extend the period of IOP elevation to avoid ocular inflammation.19 Our model of week-long elevation of IOP is already successful in inducing RGC loss and RNFL thinning. Our week-long duration of IOP elevation is consistent with the previous reports on combined laser treatment in albino CD1 or Swiss mice.19,33 While one study19 reports no significant loss of RGCs at 1 week post-procedure though a trend of decrease is observed, the other study33 shows significant loss of RGCs around 1 week post-procedure. The disparity among the studies may be due to different thresholds used in analysis. We set a threshold value of IOP at 30 mm Hg on day 1 after laser treatment because our preliminary experiments indicate no significant loss of RGCs in mice with IOP below this threshold. Our data on loss of RGCs align well with thinning of the RNFL, which is also apparent at 1 week post-procedure. In this study, we also observed pupil dilation upon IOP elevation, as reported previously.18 This may be due to compromised pupil sphincter upon IOP elevation because iris blood vessels are not autoregulated.34,35 This phenomenon is also seen in patients of acute glaucoma.
Taken together, we have developed a new mouse model of laser coagulation that can be used to study both the anterior and posterior segment of the eye and can be employed in mice aged 5 to 8 weeks, and possibly older. This model recapitulates key parameters associated with acute glaucoma and can potentially be used to study this disease from various aspects.
Supplementary Material
Acknowledgments
The authors thank the Core Translational Module at Vision Science Graduate Program and School of Optometry, University of California at Berkeley, for statistical assistance.
Supported in part by grants from National Institutes of Health and the University of California at Berkeley (LC; Berkeley, CA, USA).
Disclosure: L. Zhang, None; G. Li, None; M. Shi, None; H.-H. Liu, None; S. Ge, None; Y. Ou, None; J.G. Flanagan, None; L. Chen, None
References
- 1.Tham YC, Li X, Wong TY, Quigley HA, Aung T, Cheng CY. Global prevalence of glaucoma and projections of glaucoma burden through 2040: a systematic review and meta-analysis. Ophthalmology. 2014;121:2081–2090. doi: 10.1016/j.ophtha.2014.05.013. [DOI] [PubMed] [Google Scholar]
- 2.Wiggs JL. Glaucoma genes and mechanisms. Prog Mol Biol Transl Sci. 2015;134:315–342. doi: 10.1016/bs.pmbts.2015.04.008. [DOI] [PMC free article] [PubMed] [Google Scholar]
- 3.Wax MB. The case for autoimmunity in glaucoma. Exp Eye Res. 2011;93:187–190. doi: 10.1016/j.exer.2010.08.016. [DOI] [PubMed] [Google Scholar]
- 4.Dibas A, Yorio T. Glucocorticoid therapy and ocular hypertension. Eur J Pharmocol. 2016;787:57–71. doi: 10.1016/j.ejphar.2016.06.018. [DOI] [PMC free article] [PubMed] [Google Scholar]
- 5.Davis BM, Crawley L, Pahlitzsch M, Javaid F, Cordeiro MF. Glaucoma: the retina and beyond. Acta Neuropathol. 2016;132:807–826. doi: 10.1007/s00401-016-1609-2. [DOI] [PMC free article] [PubMed] [Google Scholar]
- 6.Aboobakar IF, Johnson WM, Stamer WD, Hauser MA, Allingham RR. Major review: exfoliation syndrome; advances in disease genetics, molecular biology, and epidemiology. Exp Eye Res. 2017;154:88–103. doi: 10.1016/j.exer.2016.11.011. [DOI] [PubMed] [Google Scholar]
- 7.Quigley HA. The contribution of the sclera and lamina cribrosa to the pathogenesis of glaucoma: diagnostic and treatment implications. Prog Brain Res. 2015;220:59–86. doi: 10.1016/bs.pbr.2015.04.003. [DOI] [PubMed] [Google Scholar]
- 8.Truong TN, Li H, Hong YK, Chen L. Novel characterization and live imaging of Schlemm's canal expressing Prox-1. PLoS One. 2014;9:e98245. doi: 10.1371/journal.pone.0098245. [DOI] [PMC free article] [PubMed] [Google Scholar]
- 9.Aspelund A, Tammela T, Antila S, et al. The Schlemm's canal is a VEGF-C/VEGFR-3-responsive lymphatic-like vessel. J Clin Invest. 2014;124:3975–3986. doi: 10.1172/JCI75395. [DOI] [PMC free article] [PubMed] [Google Scholar]
- 10.Park DY, Lee J, Park I, et al. Lymphatic regulator PROX1 determines Schlemm's canal integrity and identity. J Clin Invest. 2014;124:3960–3974. doi: 10.1172/JCI75392. [DOI] [PMC free article] [PubMed] [Google Scholar]
- 11.Sappington RM, Carlson BJ, Crish SD, Calkins DJ. The microbead occlusion model: a paradigm for induced ocular hypertension in rats and mice. Invest Ophthalmol Vis Sci. 2010;51:207–216. doi: 10.1167/iovs.09-3947. [DOI] [PMC free article] [PubMed] [Google Scholar]
- 12.Chen H, Wei X, Cho KS, et al. Optic neuropathy due to microbead-induced elevated intraocular pressure in the mouse. Invest Ophthalmol Vis Sci. 2011;52:36–44. doi: 10.1167/iovs.09-5115. [DOI] [PMC free article] [PubMed] [Google Scholar]
- 13.Morgan JE, Tribble JR. Microbead models in glaucoma. Exp Eye Res. 2015;141:9–14. doi: 10.1016/j.exer.2015.06.020. [DOI] [PubMed] [Google Scholar]
- 14.Shareef SR, Garcia-Valenzuela E, Salierno A, Walsh J, Sharma SC. Chronic ocular hypertension following episcleral venous occlusion in rats. Exp Eye Res. 1995;61:379–382. doi: 10.1016/s0014-4835(05)80131-9. [DOI] [PubMed] [Google Scholar]
- 15.Gross RL, Ji J, Chang P, et al. A mouse model of elevated intraocular pressure: retina and optic nerve findings. Trans Am Ophthalmol Soc. 2003;101:163–169. discussion 169–171. [PMC free article] [PubMed] [Google Scholar]
- 16.Feng L, Chen H, Suyeoka G, Liu X. A laser-induced mouse model of chronic ocular hypertension to characterize visual defects. J Vis Exp. 2013;78:50440. [DOI] [PMC free article] [PubMed]
- 17.Yun H, Lathrop KL, Yang E, et al. A laser-induced mouse model with long-term intraocular pressure elevation. PLoS One. 2014;9:e107446. doi: 10.1371/journal.pone.0107446. [DOI] [PMC free article] [PubMed] [Google Scholar]
- 18.Grozdanic SD, Betts DM, Sakaguchi DS, Allbaugh RA, Kwon YH, Kardon RH. Laser-induced mouse model of chronic ocular hypertension. Invest Ophthalmol Vis Sci. 2003;44:4337–4346. doi: 10.1167/iovs.03-0015. [DOI] [PubMed] [Google Scholar]
- 19.Fu CT, Sretavan D. Laser-induced ocular hypertension in albino CD-1 mice. Invest Ophthalmol Vis Sci. 2010;51:980–990. doi: 10.1167/iovs.09-4324. [DOI] [PMC free article] [PubMed] [Google Scholar]
- 20.Smith RS, Zabaleta A, Savinova OV, John SW. The mouse anterior chamber angle and trabecular meshwork develop without cell death. BMC Dev Biol. 2001;1:3. doi: 10.1186/1471-213X-1-3. [DOI] [PMC free article] [PubMed] [Google Scholar]
- 21.Downie LE, Stainer MJ, Chinnery HR. Monitoring of strain-dependent responsiveness to TLR activation in the mouse anterior segment using SD-OCT. Invest Ophthalmol Vis Sci. 2014;55:8189–8199. doi: 10.1167/iovs.14-15595. [DOI] [PubMed] [Google Scholar]
- 22.Liu HH, Flanagan JG. A mouse model of chronic ocular hypertension induced by circumlimbal suture. Invest Ophthalmol Vis Sci. 2017;58:353–361. doi: 10.1167/iovs.16-20576. [DOI] [PubMed] [Google Scholar]
- 23.Pepple KL, Choi WJ, Wilson L, Van Gelder RN, Wang RK. Quantitative assessment of anterior segment inflammation in a rat model of uveitis using spectral-domain optical coherence tomography. Invest Ophthalmol Vis Sci. 2016;57:3567–3575. doi: 10.1167/iovs.16-19276. [DOI] [PMC free article] [PubMed] [Google Scholar]
- 24.Zhang L, Li G, Sessa R, et al. Angiopoietin-2 blockade promotes survival of corneal transplants. Invest Ophthalmol Vis Sci. 2017;58:79–86. doi: 10.1167/iovs.16-20485. [DOI] [PMC free article] [PubMed] [Google Scholar]
- 25.Joos KM, Li C, Sappington RM. Morphometric changes in the rat optic nerve following short-term intermittent elevations in intraocular pressure. Invest Ophthalmol Vis Sci. 2010;51:6431–6440. doi: 10.1167/iovs.10-5212. [DOI] [PMC free article] [PubMed] [Google Scholar]
- 26.Aihara M, Lindsey JD, Weinreb RN. Experimental mouse ocular hypertension: establishment of the model. Invest Ophthalmol Vis Sci. 2003;44:4314–4320. doi: 10.1167/iovs.03-0137. [DOI] [PubMed] [Google Scholar]
- 27.Manuguerra-Gagne R, Boulos PR, Ammar A, et al. Transplantation of mesenchymal stem cells promotes tissue regeneration in a glaucoma model through laser-induced paracrine factor secretion and progenitor cell recruitment. Stem Cells. 2013;31:1136–1148. doi: 10.1002/stem.1364. [DOI] [PubMed] [Google Scholar]
- 28.Tual-Chalot S, Allinson KR, Fruttiger M, Arthur HM. Whole mount immunofluorescent staining of the neonatal mouse retina to investigate angiogenesis in vivo. J Vis Exp. 2013. e50546. [DOI] [PMC free article] [PubMed]
- 29.Chintala SK, Putris N, Geno M. Activation of TLR3 promotes the degeneration of retinal ganglion cells by upregulating the protein levels of JNK3. Invest Ophthalmol Vis Sci. 2015;56:505–514. doi: 10.1167/iovs.14-15539. [DOI] [PMC free article] [PubMed] [Google Scholar]
- 30.Nissirios N, Chanis R, Johnson E, et al. Comparison of anterior segment structures in two rat glaucoma models: an ultrasound biomicroscopic study. Invest Ophthalmol Vis Sci. 2008;49:2478–2482. doi: 10.1167/iovs.07-0965. [DOI] [PMC free article] [PubMed] [Google Scholar]
- 31.Cone FE, Steinhart MR, Oglesby EN, Kalesnykas G, Pease ME, Quigley HA. The effects of anesthesia, mouse strain and age on intraocular pressure and an improved murine model of experimental glaucoma. Exp Eye Res. 2012;99:27–35. doi: 10.1016/j.exer.2012.04.006. [DOI] [PMC free article] [PubMed] [Google Scholar]
- 32.Ruiz-Ederra J, Verkman AS. Mouse model of sustained elevation in intraocular pressure produced by episcleral vein occlusion. Exp Eye Res. 2006;82:879–884. doi: 10.1016/j.exer.2005.10.019. [DOI] [PubMed] [Google Scholar]
- 33.Salinas-Navarro M, Alarcon-Martinez L, Valiente-Soriano FJ, et al. Functional and morphological effects of laser-induced ocular hypertension in retinas of adult albino Swiss mice. Mol Vis. 2009;15:2578–2598. [PMC free article] [PubMed] [Google Scholar]
- 34.Charles ST, Hamasaki DI. The effect of intraocular pressure on the pupil size. Arch ophthalmol. 1970;83:729–733. doi: 10.1001/archopht.1970.00990030729011. [DOI] [PubMed] [Google Scholar]
- 35.Chamot SR, Movaffaghy A, Petrig BL, Riva CE. Iris blood flow response to acute decreases in ocular perfusion pressure: a laser Doppler flowmetry study in humans. Exp Eye Res. 2000;70:107–112. doi: 10.1006/exer.1999.0759. [DOI] [PubMed] [Google Scholar]
Associated Data
This section collects any data citations, data availability statements, or supplementary materials included in this article.


