Abstract
We implemented and began to evaluate an alternative convection parameterization for the NASA Goddard Earth Observing System (GEOS) general circulation model (GCM). The proposed parameterization follows the mass flux approach with several closures, for equilibrium and nonequilibrium convection, and includes scale and aerosol aware functionalities. Recently, we extended the scheme to a trimodal spectral size distribution of allowed convective plumes to simulate the transition among shallow, congestus, and deep convection regimes. In addition, the inclusion of a new closure for nonequilibrium convection resulted in a substantial gain of realism in the model representation of the diurnal cycle of convection over the land. We demonstrated the scale‐dependence functionality with a cascade of global‐scale simulations from a nominal horizontal resolution of 50 km down to 6 km. The ability to realistically simulate the diurnal cycle of precipitation over various regions of the earth was verified against several remote sensing‐derived intradiurnal precipitation estimates. We extended the model performance evaluation for weather‐scale applications by bringing together some available operational short‐range weather forecast models and global atmospheric reanalyses. Our results demonstrate that the GEOS GCM with the alternative convective parameterization has good properties and competitive skill in comparison with state‐of‐the‐art observations and numerical simulations.
Keywords: convection parameterization, scale‐aware parameterizations, weather forecast, diurnal cycle of precipitation
Key Points
A scale and aerosol aware convection parameterization in the NASA GEOS GCM
The trimodal approach and the diurnal cycle in the GF convection parameterization
Multimodels and remote sensing data applied for assessment of the NASA GEOS GCM with the GF scheme
1. Introduction
Convection parameterizations (CPs) are submodel components of atmospheric models aiming to represent the statistical effects of a subgrid‐scale ensemble of convective clouds. CPs are required for models in which the spatial resolution is not sufficient to resolve the associated convective circulations. In those models, CPs attempt to compute the net subgrid‐scale vertical transport of energy, momentum, mass, water, and tracers, including the resulting rainfall from the water vapor condensation and autoconversion in convective updrafts, and the associated wet removal of aerosols and gases. With a myriad of physical and chemical processes handled inside them, CPs directly or indirectly interact with every other component of an earth system model, and they are a key ingredient for model realism and skill.
The primary framework for the moist convection parameterization used in this study dates from the 1970s, and the main reference is the paper of Arakawa and Schubert (1974, hereafter AS74). One of the central hypotheses of the scheme was that active convective clouds occupy a small fraction (σ) of each model grid cell area. Presently, with increasing computational power, most atmospheric models, even the global‐scale ones, are nearing spatial resolutions that break this hypothesis. Therefore, there is a need for scale‐aware CPs in which the scheme can self‐adjust in situations where convective circulations are being explicitly resolved totally or in part, leaving the cloud microphysics to take over the production of the convective rainfall and the vertical distribution of mass, momentum, and energy.
A seamless approach for conventional CPs to become scale aware was proposed by Arakawa et al. (2011). The authors rederived the equation for the vertical eddy transport by eliminating the assumption that and requiring that the parameterization must converge to an explicit simulation of cloud processes as . In this formulation, separate equations for σ and the in‐cloud vertical velocity are necessary to close the parameterization. Following Arakawa et al. (2011), Grell and Freitas (2014) converted the conventional Grell and Devenyi (2002) CP into a scale‐aware CP (hereafter GF), by choosing a simple formulation for σ. Grell and Freitas (2014) tested this CP in the INPE BRAMS regional model (Freitas et al., 2017). The scheme behaved as expected, simulating a relatively smooth transition from a model grid spacing of 20 km with the fraction of the resolved precipitation ∼55% down to ∼20% at 5 km. Fowler et al. (2016) implemented the GF scheme into a global model with variable resolution and tested it in a variable mesh configuration with grid spacing varying from 3 to 50 km. The authors also found a smooth transition between parameterized and grid‐scale precipitation, with the GF scheme giving way to the microphysics to resolve the precipitation associated with the convective circulations embedded in the more refined region of the mesh. More recently, Kwon and Hong (2017) introduced a comprehensive method for seamless CPs in the context of the Simplified Arakawa‐Schubert scheme (SAS; Han & Pan, 2011; Pan & Wu, 1995) following a previous work done by Lim et al. (2014). In their work, the authors proposed a resolution dependence in the three basic aspects of the SAS scheme: convective inhibition, mass flux at cloud base, and the detrainment of cloud condensate. All these quantities are modulated by two cloud fractions, which are determined as a function of the model grid spacing and the ratio between the vertical average of grid‐scale and subgrid‐scale vertical velocities.
Other approaches for scale‐dependence exist. The G3d convection parameterization (based on Grell and Devenyi (2002)) does not concentrate the vertical eddy transports to just one grid cell but simply distributes the environmental subsidence over the neighboring grid cells. Kuell et al. (2007) developed a hybrid approach where, while the mass and energy transports by the convective scale updrafts and downdrafts are parameterized in the conventional sense, the grid‐scale equations explicitly handle the environmental subsidence response to the cumulus updrafts and downdrafts. Gerard (2007) proposed an integrated set of parameterizations merging grid‐scale and subgrid‐scale treatments of moist processes in a continuous range (10–2 km) of resolution. The author advocates that his framework prevents double counting potentially existent in formulations of the moist processes in traditional NWP models. Further work (Gerard et al., 2009) showed that the application of this framework in an operational NWP model resulted in higher skill scores in comparison with the use of a traditional convection parameterization. In the Goddard Earth Observing System atmospheric general circulation model (hereafter GEOS; Molod et al., 2015), the resolution dependence in its standard convection parameterization (i.e., the Relaxed Arakawa‐Schubert [RAS]; Moorthi & Suarez, 1992), follows a user‐specified parameter depending on the employed horizontal‐grid spacing. This parameter sets a lower bound for the range of entrainment which specifies the spectrum of plumes in RAS scheme. The lower bound increases with the resolution, forging a shallower spectrum, and allows the cloud microphysics to have a more dominant role in producing the convective rainfall associated with the wider and deeper cumulus.
Another fundamental hypothesis of the AS74 scheme was that dynamical and physical forcing, which acts on the environment where the ensemble of clouds develops, fluctuates slowly enough to allow the associated convective response to be in quasi‐equilibrium (hereafter, Q‐E) with it. However, a situation of weak upper tropospheric forcing and fast varying strong surface heat fluxes might result in convective activity which is not necessarily in equilibrium. The diurnal cycle of convection over land is an example of nonequilibrium convection in response to the surface fluxes and boundary layer transports, and it is still a challenge for most convection parameterizations to simulate this process adequately. AS74 proposed the Q‐E hypothesis mostly based on observations gathered over tropical ocean environments. Since that work was published, efforts were made to examine this hypothesis in varying conditions, mainly in situations in which the large‐scale destabilization is not dominant. Zhang (2002) applied summertime observations in the Southern Great Plains (SGP) of the United States to test the Q‐E assumption in a midlatitude continental environment. The author advocated that the large‐scale forcing and the resulting convection do not follow the Q‐E assumption. Instead, he found that the free tropospheric large‐scale forcing (i.e., associated with the advection and radiation above the boundary layer) is in balance with the observed convective activity. Based on his findings, the author formulated a modified concept of Q‐E, applicable for midlatitude continental environments. In a subsequent paper, Zhang (2003a) extended this analysis to the western tropical Pacific region and found that the modified Q‐E is also supported by observations over that region, collected during the TOGA‐COARE experiment. Zhang (2003b) applied his modified Q‐E assumption to study its applicability to the diurnal cycle of convection over the SGP. Using a single‐column model and a fully 3‐D global model, the author demonstrated that the modified Q‐E, applied in the Zhang and McFarlane (1995) convection parameterization, substantially improved not only the phase of the diurnal cycle of precipitation but also its amplitude in comparison with the simulation employing the original closure following AS74 Q‐E. Donner and Phillips (2003) analyzed observations from field campaigns over the contiguous United States and tropical oceans to understand how the boundary layer controls the convective available potential energy (CAPE). Their findings confirmed that, in these environments, CAPE evolution is primarily controlled by the surface fluxes and boundary layer transports, and the Q‐E assumption is not well satisfied for these intradiurnal variations. The authors also found that the Zhang (2002) modified Q‐E assumption explains the observations fairly well.
More recently, Bechtold et al. (2014) extended the original convective parameterization closure adopted by the Integrated Forecast System (IFS) global model of the European Centre for Medium‐Range Weather Forecasts (ECMWF; Gregory et al., 2000). In an attempt to better represent the diurnal cycle of precipitation by this model, the closure was modified to account for the imbalance between deep convection and the boundary layer forcing. Essentially, the extended closure proposed that only a fraction of the boundary layer production of total CAPE is available for the deep convection overturning. The impact of this extended closure was remarkable, bringing the IFS simulations of the diurnal cycle of the precipitation much closer to the observations.
This work advances the capabilities of the NASA GEOS GCM by including a scale‐aware convection parameterization, the GF scheme (Grell & Freitas, 2014) with recent developments and extensions. Here we describe the most recent version of the GF scheme, report its implementation and preliminary results in the NASA GEOS GCM, focusing on the aspects discussed above. Finally, we also provide a quantitative evaluation of the GEOS GCM with the GF scheme on weather time scales.
This paper is organized as follows. Section 2 briefly describes recent developments in GF scheme applied in this work. We then demonstrate results with the GEOS GCM in section 3. In section 4, we discuss the model performance in comparison with remote sensing and numerical model products. Section 5 introduces quantitative evaluation of the GEOS GCM with the GF scheme in the context of short to medium‐range weather prediction. The main findings are discussed and perspectives for future work are provided in the last section.
2. Brief Description of the GF Scheme and Recent Developments
The GF scheme as described in Grell and Freitas (2014) follows the mass flux approach from earlier versions described in Grell and Devenyi (2002) and references therein. The main differences between GF from the convection parameterization described in Grell and Devenyi (2002) are the inclusion of the scale awareness through Arakawa et al. (2011) approach, and the aerosol dependence through rain generation and evaporation formulations depending on the cloud concentration nuclei at cloud base.
More recently, the GF scheme evolved in several ways. Here we briefly introduce the new features applied in this work. The unimodal deep plume was replaced by a trimodal formulation, which allows up to three plumes to represent the main convective modes existing in a tropical environment: shallow, congestus, and deep (Johnson et al., 1999). The three plumes might coexist in a given model grid column. The parameterization is performed over the entire spectrum calling the shallow scheme first, the congestus next, and then the deep plume. Each of the modes is distinguished by different lateral entrainment rates that strongly control its vertical depth and, consequently, the height of the main detrainment layers. The entrainment rates at cloud base are given by 1.4, 0.9, and 0.25 km−1 for shallow, congestus, and deep plumes, respectively. These values vary with the resolution only once a critical threshold value of the updraft coverage is reached (currently 0.9). The entrainment rate is not constant in the vertical but depends on the normalized mass flux profile, which is prescribed by a Beta probability density function. The application of Beta PDF to emulate the vertical mass flux profiles provides an effective method to set the vertical distribution of heat and mass, which is very useful for fine‐tuning the model. The condensate is split into ice and liquid amounts by a simple temperature profile, and the in‐cloud moist static energy is corrected by the energy released during the transformation of liquid water to ice particles. The three modes transport momentum, tracers, water, and moist static energy. For mass and energy, the spatial discretization of the tendency equation is conservative to machine precision. A set of closures associated with each mode is available to determine the mass flux at the cloud base to adequately account for the diverse regimes of convection in a given grid cell.
Lastly, GF scheme adopted a closure for nonequilibrium convection developed by Bechtold et al. (2014, hereafter B2014), aiming to improve its representation of the diurnal cycle of convection. B2014 proposed the following equation for the convective tendency for deep convection that represents the stabilization response in the closure equation for the mass flux at cloud base:
| (1) |
where Π is the so‐called density‐weighted buoyancy integral, τ and τBL are appropriate time scales. The second term on the right‐hand side of equation (2) is the total boundary layer production given by
here the virtual temperature tendency includes tendencies from grid‐scale advection, diffusive transport and radiation. Furthermore, is a scale temperature parameter, p is pressure and the integral is performed from the surface to the cloud base. The justification for subtracting a fraction of the boundary layer production in determining the mass flux at cloud base is that, although the diagnostic of Π already contains all the boundary layer heating, it is not totally available for deep convection. In GF, the boundary layer production is obtained separately, in a way that it can be used in conjunction with any of the closures for deep convection available in the scheme.
3. Results With the GEOS GCM
3.1. Scale Dependence
As implemented in the GEOS GCM, the GF scale dependence for deep convection was designed using the method described by Arakawa et al. (2011). In their paper, the authors derive the equation for the vertical eddy transport ( ) of a quantity in terms of the fractional area covered by the active cloud draft (σ) and the vertical eddy transport term given by a conventional, nonscale‐aware CP (second term on RHS) calculated for a full adjustment to a quasi‐equilibrium:
In GF, the ratio between the entrainment rate (converted to an effective radius size of the updraft) and the local grid cell area determines the σ. In this way, at low resolution ( ), the conventional parameterization built into the GF scheme dominates in the convection prone regions. However, at high resolution ( ), the parameterization gives way to the cloud microphysics scheme, assuring a smooth transition from the nonresolved to the resolved scales.
In the GEOS GCM, we explored the GF scale‐dependence approach by performing a cascade of global‐scale simulations with uniform spatial resolution, varying from approximately 50 km down to 6 km. The simulations used the nonhydrostatic dynamical core FV3 (Putman & Lin, 2007) and the single‐moment version of the microphysics scheme (Bacmeister et al., 2006). The long‐wave radiative processes are represented following Chou and Suarez (1994), and the short‐wave radiative processes are from Chou and Suarez (1999). The turbulence parameterization is a nonlocal scheme primarily based on Lock et al. (2000), acting together with the local first‐order scheme of Louis and Geleyn (1982). The GEOS GCM also includes the Relaxed Arakawa‐Schubert convection parameterization (Moorthi & Suarez, 1992). Comparison between GEOS GCM simulations with GF and RAS schemes are discussed later in this paper. The reforecasts extend up to a 3 day lead time and were performed using the Modern‐Era Retrospective Analysis for Research and Applications, Version 2 (MERRA‐2; Gelaro et al., 2017) reanalysis to provide the initial conditions. The sea surface temperatures are prescribed following Reynolds et al. (2002). Model resolutions were c180, c360, c720, c1000, and c1440 (see Table 1 for the correspondent nominal grid spacing).
Table 1.
Summary of the GF Scale Dependence Within NASA GEOS Global Model
| Global mean | Tropical belt (20°S–20°N) | |||
|---|---|---|---|---|
| Precipitation (mm d−1) | Fraction | Fraction | ||
| GEOS GCM resolution | Parameterized | Total | (parameterized/total, %) | (parameterized/total, %) |
| c180, ∼50 km | 2.04 | 3.19 | 64 | 88 |
| c360, ∼25 km | 1.80 | 3.20 | 56 | 79 |
| c720, ∼12 km | 1.33 | 3.17 | 42 | 59 |
| c1000, ∼9 km | 0.99 | 3.23 | 31 | 38 |
| c1440, ∼6 km | 0.69 | 3.28 | 21 | 27 |
Figure 1 displays the resulting simulated total precipitation (from the convection parameterization and from the cloud microphysics scheme, left column) and from the CP only (right column). These results correspond to a 3 day average in mm d−1. From top to bottom, model resolution increases from c180 to c1440. On the left side of Figure 1, the total precipitation field becomes richer in details with filamentary structures, as convective clouds become explicitly resolved, while preserving the broader pattern and spatial distribution. Precipitation forms will be showing more detail with increased local maxima and minima as the resolution increases, as demonstrated also in Grell and Freitas (2014) and Fowler et al. (2016). The global mean precipitation oscillates between 3.17 and 3.28 mm d−1. On the right side of Figure 1, at low resolution (top plots), the CP dominates the generation of rainfall, mainly over the tropical region, but gradually reduces its participation as the model resolution increases and deep vertical convective circulations begin to develop. The CP precipitation global mean shows a monotonic decrease from 2.04 mm d−1 at c180 to 0.69 mm d−1 at c1440, the highest resolution applied in this work. As shown in Table 1, the fraction of the parameterized precipitation decreases from 64% at ∼50 km to 21% at ∼6 km in a global mean. Regarding this fraction in the tropical belt (limited by 20°S and 20°N), the numbers are higher: 88% at ∼50 km to 27% at ∼6 km. In particular, at the upper limit of the so‐called “grey‐zone” (∼9 to ∼12 km), the fraction of the parameterized precipitation is about 38%–59% in the tropical belt. These results demonstrate the GF scheme capability of shutting itself down as the resolution increases, thus allowing the cloud microphysics scheme to take over.
Figure 1.
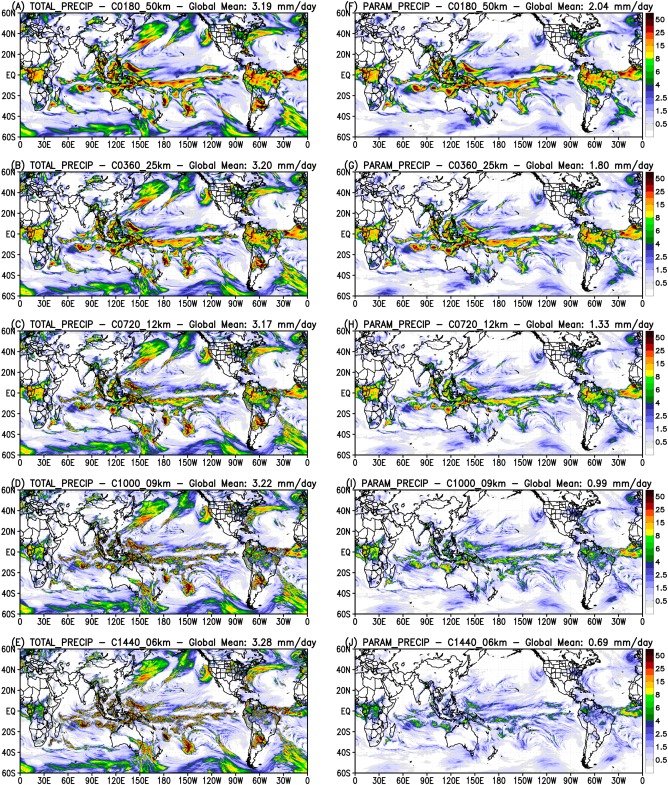
(left) Total precipitation and (right) from the convective parameterization only averaged over 3 day run. From up to down, model resolution increases from c180 (∼50 km) to c1440 (∼6 km). The global mean in mm d−1 appears on top of each plot.
Figure 2 shows the zonal mean of cloud fraction. The cloud fraction associated with the detrained cloud condensate from the CP appears in the top row, while the total cloud fraction, including the grid‐scale cloud fields, is in the bottom row. As before, the results are shown as 3 day averages. From low to high spatial resolution (∼50 km, ∼25 km, and ∼6 km), the cloud fraction associated with the deep convection was reduced selectively in the upper levels but did not substantially alter in the lower levels, which are mostly associated with the shallow and congestus plumes. In this way, the scale‐dependence approach also acts as a filter, first barring the larger convective systems associated with the deep convection. On the other hand, the total cloud fraction (i.e., including the resolved part) increases in upper levels in the tropical region but decreases in the extratropical areas.
Figure 2.
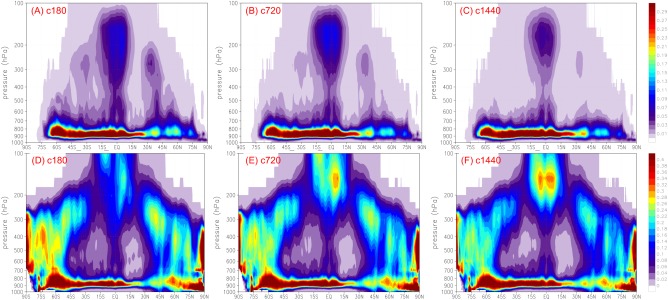
Zonal mean of the cloud fraction from (top row) the convective parameterization only and the total, i.e., (bottom row) including the grid‐scale, averaged over the 3 day run. From left to right, model resolution increases from c180 (∼50 km), c720 (∼12 km), and to c1440 (∼6 km). The top and bottom color bars have different range of values.
3.2. Simulating the Diurnal Cycle of Convection
We performed global‐scale simulations with the GEOS GCM to evaluate the GF scheme with the B2014 diurnal cycle closure. Model results were compared against several observational in situ and remote sensing‐derived estimates, as shown in this section. The GEOS GCM was configured at its c360 spatial resolution (∼25 km) and ran in straight forecast mode, initialized each day for the entire months of July 2015 and January 2016. Each forecast comprised a 120 h time integration, with output every 1 h. The monthly averages discussed in this section are produced with only the first 24 h of each forecast series.
The in situ and remote sensing‐derived precipitation estimates we used here to evaluate GEOS with GF are the Global Precipitation Climatology Project (GPCP v2.1; Adler et al., 2003), the Precipitation Estimation from Remotely Sensed Information using Artificial Neural Networks (PERSIANN; Sorooshian et al., 2014), the NOAA CPC Morphing Technique (CMORPH; Joyce et al., 2004), the TRMM Multisatellite Precipitation Analysis (TMPA version 3B42; Huffman et al., 2007), the Global Precipitation Measurement (GPM) with the Integrated Multisatellite Retrievals for GPM (IMERG, version 4), and a combination of TRMM‐TMPA product with surface observations over the South American continent (MERGE; Rozante et al., 2010, routinely produced by the Brazilian Institute for Space Research ‐ INPE). Table 2 describes the spatial and temporal resolution of these data sets. Only GPCP and MERGE do not have intradiurnal information of the precipitation rate. However, since they are robust estimates, they will be used to anchor the other data sets. We explore the intradiurnal estimates from TRMM, GPM, PERSIANN, and CMORPH to provide information about the diurnal cycle of the precipitation rate.
Table 2.
Precipitation Data Sets Applied for GEOS GCM With GF Convective Parameterization Evaluation
| Precipitation data sets | Spatial/temporal resolution and domain |
|---|---|
| GPM (IMERG v04) | 0.10°/30 min, 60°S–60°N |
| CMORPH | 0.07°/30 min, 60°S–60°N |
| TRMM (TMPA, 3B42) | 0.25°/3 h, 60°S–60°N |
| PERSIANN | 0.25°/1 h, 60°S–60°N |
| MERGE | 0.25°/daily, South America |
| GPCP v2.1 | 2.5°/daily, Global |
We discuss the performance of the GEOS GCM with GF (hereafter GEOS GF) as regards the precipitation rate for the two different time periods on a global scale and also by evaluate it separately over the oceans and continental areas. Figure 3 presents the model performance in comparison with the observations for both time periods. On the right side of each plot, the daily mean (AVE) and standard deviation (STD) of the precipitation rate in mm h−1 are also shown. The global domain average of the precipitation rate (Figure 3a) as estimated by GPCP for July 2015 is 0.113 mm h−1 with zero STD as the data is available only in terms of daily accumulation. On the other side, the global mean of PERSIANN, TRMM, GPM and CMORPH are 0.125, 0.126, 0.122, and 0.117 mm h−1, respectively. They are relatively close to GPCP, with TRMM, e.g., showing ∼11% higher rate. TRMM, PERSIANN and CMORPH data have two well‐defined peaks: a nocturnal one around 3 A.M. and another one in late afternoon around 3 and 6 P.M. The version 04 of the GPM retrieval algorithm shows more flat precipitation rate on diurnal times. Both versions of GEOS GF simulate 0.125 mm h−1, in close agreement with TRMM and about 10% higher than GPCP. In terms of the precipitation rate from only CP, they are also close with amounts of 0.049 mm h−1 for the configuration not including the diurnal cycle of closure (hereafter DC0) and 0.048 mm h−1 for the case where this closure is fully applied (hereafter DC1). The largest difference appears at the simulated phases. Both simulations are in phase at nighttime and agree relatively well with the observations; however, model DC0 peaks around noon, about 3 h earlier than observations. Model DC1 performs better, peaking much closer with the observations. Looking at the curves of the simulated precipitation rates from CP only, it is clear that the shift in the phase of the total precipitation comes primarily from the CP itself.
Figure 3.
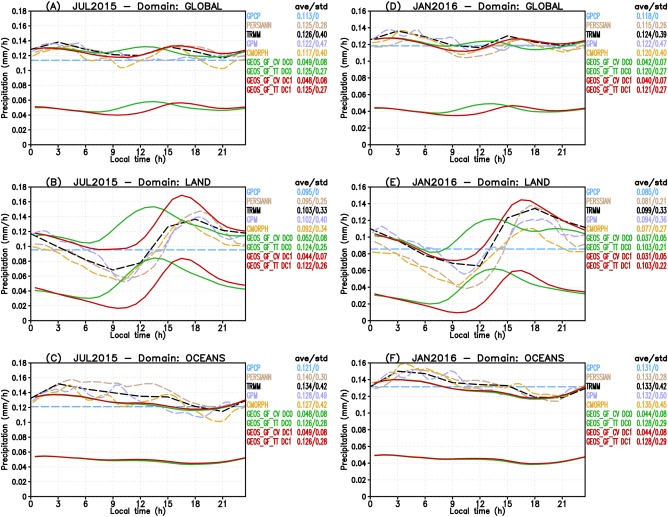
Diurnal cycle of precipitation from remote sensing‐derived observations and NASA GEOS GCM with the GF scheme. (a–c) July 2015 monthly averaged results for the global, land and ocean domains, respectively. (d–f) As before but for January 2016. Observations are shown in dashed lines. Model results are shown regarding total precipitation (GEOS GF TT) and only from GF convection parameterization (GEOS GF CV) with both using continuous lines. Models results in red and green colors correspond to simulations including (DC1) or not (DC0) the diurnal cycle closure, respectively.
Figures 3b and 3c present the results discussed above but shows calculations for the precipitation rate averages grouping over land and ocean domains separately. In these cases, the TRMM overestimations relative to GPCP amounts are ∼8% and ∼11% over land and oceans, respectively. As expected, the continental amplitude of the precipitation rate is considerably larger than the ocean one. Also, the origin of the two peaks of the precipitation rate is evident: the nocturnal one occurs over ocean and the late afternoon one over land. Further, over land, the observed precipitation rates show a monotonic decrease starting at about midnight and ending between 9 A.M. and noon, with the daily minimum amount occurring during this time interval. TRMM shows an earlier rise (about 9 A.M.), but this is probably an artifact due to the temporal resolution of its precipitation accumulation (i.e., 3 h). All other remote sensing‐derived estimates show an increase of the precipitation rates that occurs slightly later. GEOS GF DC1 results over land are remarkably improved, with a phase shift of ∼3 h in comparison with DC0 and much closer to observations. In terms of the precipitation amount, GEOS GF over/underestimate the precipitation by ∼18%/∼6% over land/oceans regions, with DC1 slightly better over land.
As shown in Figure 3d–3f, GEOS GF seems to perform better for January 2016 than for July 2015. The global averages of model DC1 and DC0 (Figure 3d) are 0.121 and 0.120 mm h−1, respectively, lying in the interval between GPCP (0.118 mm h−1) and TRMM (0.124 mm h−1). Over land (Figure 3e), model DC1 more closely matches the observations than in July 2015 (Figure 3b), and the overestimation relative to TRMM is now much smaller (∼4%). The shift of the phase is also remarkable in comparison with the case DC0. Over ocean, GEOS GF DC1 and DC0 perform similarly, underestimating the precipitation by about 4% but retaining a realistic phase.
We now proceed with the evaluation by grouping the data and model results in the subdomains indicated in Figure 4. Figure 5 shows the diurnal cycle of the precipitation averaged over July 2015 and sampling over the six subdomains reported in blue in Figure 4: CONUS, ITCZ2, EUR, SAHEL, INDIA, and PACIFIC1, which are associated with the regions with the most substantial accumulated rainfall as observed by TRMM (see Figure 8). Looking first at the land areas (plots a and c–e), PERSIANN, TRMM, GPM, and CMORPH diurnal cycles vary reasonably well around the GPCP daily mean estimate, all showing daily amounts that are very close amounts to GPCP (variations less than 10%). The four estimates show similar phases, all peaking in late afternoon and having a minimum between 9 A.M. and noon. Both model simulations, DC1 and DC0, show similar daily mean amounts of the precipitation (variations less than 5%).They also present a diurnal cycle of precipitation rate which varies around a daily mean close to the GPCP estimate. However, as before when analyzing the model results for much larger spatial domains, vast differences in the phase of the diurnal cycle of the precipitation rate are noted between the two simulations DC1 and DC0. DC1 presents a much more realistic phase in comparison with DC0, with a timing of the minimum and maximum much closer to the observations. In the four subdomains over land, the DC0 precipitation rate starts to increase hours before and peaks earlier than observations. Here again, the improvement in the phase of the total precipitation is due to the improvement in the phase of the convective precipitation associated with GF parameterization, as shown by the pair of curves denoted by GEOS GF CV DC1 and DC0. For the subdomains over ocean (plots b and f), the diurnal cycle of precipitation is much smoother, with a maximum between midnight and early morning. In both subdomains and on a daily basis, GPCP estimates a somewhat lower amount in comparison with the other observations, while TRMM shows larger values, mainly over the subdomain denoted by PACIFIC1 (about 30% greater than GPCP). Models DC0 and DC1 simulate pretty much the same precipitation rate, both for phase and amplitude. In comparison with observations, the model phase seems to be acceptable, with the amount being slightly lower but close to GPCP.
Figure 4.
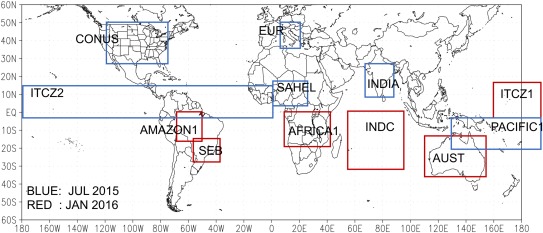
Selected subdomains for evaluation of the GEOS GF model. Subdomains delimited by blue (red) colors are employed for the time period July 2015 (January 2016).
Figure 5.
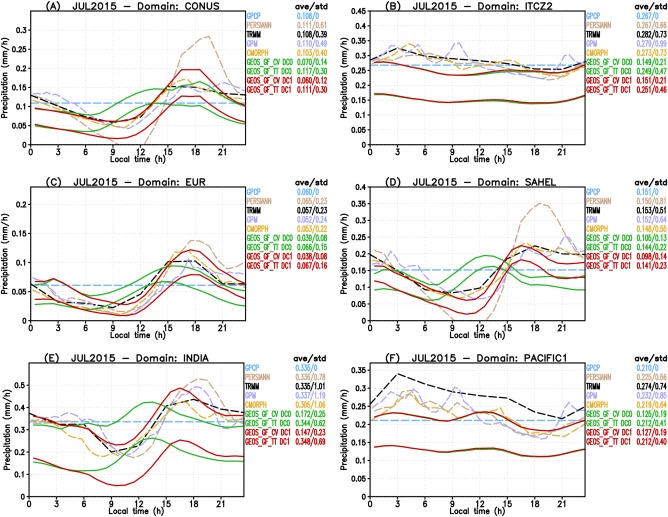
Diurnal cycle of precipitation from remote sensing‐derived observations and NASA GEOS GCM with the GF scheme including (DC1) or not (DC0) the diurnal cycle of closure. The plots show July 2015 monthly averaged results for the subdomains (a) CONUS, (b) ITCZ2, (c) EUR, (d) Sahel, (e) India, and (f) Pacific1 regions. See Figure 4 for definitions of these regions. Observations are shown in dashed lines. Model results are shown regarding total precipitation (GEOS GF TT) and the amount only associated with the GF convection parameterization (GEOS GF CV), with both using continuous lines. Models results in red and green colors correspond to simulations including (DC1) or not (DC0) the diurnal cycle closure, respectively.
Figure 8.
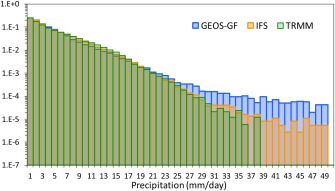
Histogram of the precipitation amounts of TRMM, and the GCMs IFS and GEOS‐GF binned in 1 mm d−1. Note that the vertical axis applies a log scale.
For January 2016, we selected the six subdomains depicted in red in Figure 4, which represent a portion of the Amazon Basin (AMAZON1), Southeast part of Brazil (SEB), part of Africa (AFRICA1), a domain over the India ocean (INDC), Australia (AUST), and over the Pacific Ocean (ITCZ1). As before, the selection of the sampled regions was based on the amount of monthly accumulated precipitation by TRMM (see Figure 8). The results for this time period are depicted in Figure 6. Focusing over the Amazon Basin subdomain (Figure 6a), the observations show a discrepancy for the monthly mean between 0.308 (CMORPH) and 0.389 (MERGE) mm h−1. GPCP and TRMM estimates are 0.349 and 0.344 mm h−1, respectively, in the middle of the range of the other estimates. The intradiurnal observations agree as to the phase, with the minimum precipitation rate taking place between 10 AM and noon and the maximum occurring between 3 and 6 P.M. Model results with GEOS GF are again shown, including (DC1, red color) or not including (DC0, green color) the diurnal cycle closure, and have monthly average precipitation rates of 0.359 and 0.372 mm h−1, respectively, within the range of the observations. Note that the model precipitation DC1 stands closer to the GPCP and TRMM estimates than to the others. Regarding the phase of the modeled diurnal cycle, good agreement with the available observations is attained with DC1. Model precipitation for DC0 starts to increase just around 9 h LT, a few hours after sunrise, and peaks about noon. The inclusion of the diurnal closure (case DC1) causes a delay of about 3 h, with the rainfall rate peaking between 3 and 6 P.M., much closer to the observations. For the other three land‐dominated subdomains (plots b, c, and e), the observations relatively agree to within a range smaller than 10% for the monthly mean precipitation rate as well as regarding the phase, all showing peaks late in the afternoon, and the lowest values occurring between 9 A.M. and noon. In the case of the Amazon Basin, the shifts in the phases of the cycle of precipitation rate caused by the nonequilibrium closure are noticeable, with good improvement of the model performance. In general, both models overestimate the precipitation amount by ∼10% to ∼20%. In the ocean subdomains (plots d and f), the diurnal cycle of observations and models are relatively flat. In comparison with GPCP and TRMM, the model underestimates the monthly mean by about ∼10%.
Figure 6.
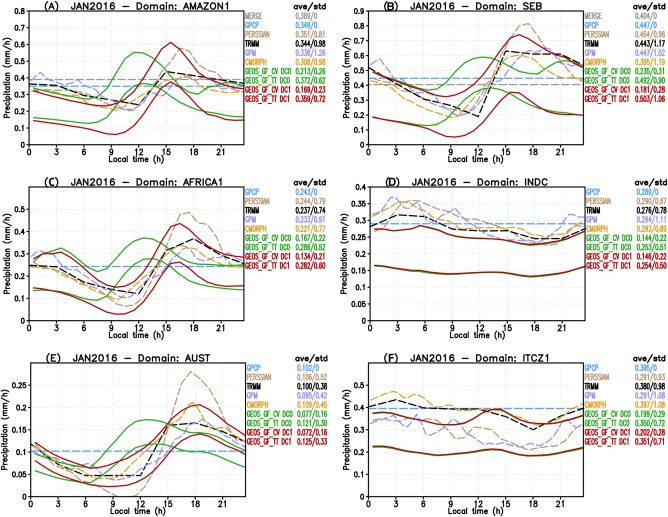
Diurnal cycle of precipitation from remote sensing‐derived observations and NASA GEOS GCM with the GF scheme including (DC1) or not (DC0) the diurnal cycle of closure. The plots show results for January 2016 monthly averaged results for the subdomains (a) AMAZON1, (b) SEB, (c) AFRICA1, (d) INDC, (e) AUST, and (f) ITCZ1. See Figure 4 for definitions of these subdomains. Observations are shown in dashed lines. Model results are shown regarding total precipitation (GEOS GF TT) and only from GF convection parameterization (GEOS GF CV), with both using continuous lines. Models results in red and green colors correspond to simulations including or not the diurnal cycle closure, respectively.
4. Evaluation of NASA GEOS GCM and Intercomparison With Other Models and Reanalysis Products
This section provides a more comprehensive evaluation of GEOS with the GF convection parameterization using the remote sensing‐derived precipitation observations described in the previous section, as well as with available state‐of‐the‐art real‐time weather forecasts and global atmospheric reanalysis products. Here model forecasts include the Global Forecast System (GFS, 2016), the Integrated Forecast System (IFS, release CY41R1) as well as the GEOS GCM configured with the RAS convection parameterization (GEOS RAS). The reanalysis products are the European Reanalysis named ERA‐Interim (ERAINT; Dee et al., 2011), which is based on a 2006 release of the IFS (CY31R2), the Japanese 55 year Reanalysis (JRA55; Kobayashi et al., 2015), the NCEP Climate Forecast System Version 2 (CFSv2; Saha et al., 2014) and the Modern‐Era Retrospective Analysis for Research and Applications, Version 2 (MERRA‐2; Gelaro et al., 2017). Table 3 presents the spatial and temporal resolutions of the reanalysis and model weather forecasts mentioned above.
Table 3.
Spatial and Temporal Resolution of Reanalysis and Model Weather Forecasts Applied in This Evaluation
| Reanalysis and model forecasts | Spatial/temporal resolution |
|---|---|
| ERA‐Interim | 0.75°/3 h |
| JRA55 | 1.25°/3 h |
| CFSv2 | 0.2°/1 h |
| MERRA‐2 | 0.625° × 0.5°/1 h |
| GFS | 0.5°/3 h |
| IFS | 0.25°/daily |
| GEOS | 0.25°/1 h |
We analyze here the averaged monthly mean precipitation for July 2015 and January 2016 (Figure 7) of GEOS GF in comparison with two sources of information of similar spatial resolution, i.e., the TRMM remote sensing estimation and the IFS model forecast. For both models, the monthly mean was obtained combining the first 24 h forecast of each day. From TRMM (Figures 8a and 8d) the movement of the ITCZ from north latitudes (July) to south latitudes (January) is evident. For example, over Africa, in July 2015, the precipitation is mostly located between the Equator and 15°N, while in January 2016, it is between 15°S and the Equator. Over South America, the meridional displacement of the precipitation associated with the ITCZ movement is also evident. In July, the precipitation is located in two distinct areas: north of the Equator, associated with the ITCZ, and south of ∼30°S associated with the midlatitude cold front excursions. In between these two regions, a large portion of South America becomes very dry, getting around 1–2 mm d−1 of rain. In January, the situation is reversed with that portion becoming much wetter associated with the development of the South Atlantic Convergence Zone. In July, the easterly and westerly trade winds converge over the Indian continent, establishing the ITCZ and producing a large amount of precipitation in this area (over the 20 mm d−1). January is much drier with an average of 1 mm d−1. In the Southern Hemisphere, a large area of intense precipitation associated with the Pacific warm pool is seen close to the Northeast part of Australia in July. In January, this feature has migrated to the West, lying around longitude 150°W. Picaut et al. (1996) discuss the mechanism of the zonal migration of this warm pool on interannual time scales, as associated with the advection of the Pacific's warm pool and less saline water mass.
Figure 7.
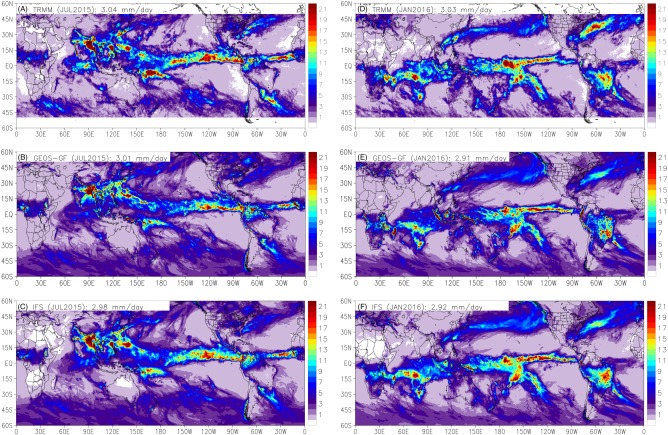
Averaged monthly mean precipitation (mm d−1) for (left column) July 2015 and (right column) January 2016. (top row) The TRMM estimate. Models (middle row) GEOS GF and (bottom row) IFS.
Both models forecasts seem to capture the TRMM precipitation patterns very well, mainly regarding their distribution. They capture well the meridional displacement of the ITCZ and the zonal migration of the rainfall associated with the Pacific warm pool. In particular, over South America, both are remarkably good at capturing the observed rainfall location and shape. Notable disagreement concerning precipitation amounts appears in several regions. Off the East Coast of North America, both models have similar results but they significantly underestimate the TRMM precipitation amount. In July, both models produce a weaker ITCZ over the Atlantic and the western part of the Pacific Ocean, and they also largely underestimate the precipitation over the Pacific warm pool. In January, the two models seem to reproduce fairly well both the ITCZ and the Pacific warm pool precipitation amounts. In South America, GEOS GF largely underestimates the TRMM rainfall over the central part of Brazil and overestimates it over the Southeast region. The IFS model results are more realistic than GEOS GF. GEOS GF produces large and localized precipitation amounts over mountainous regions (e.g., over the Andes) and also over islands (e.g., in the summer of Madagascar and some Asian Islands), which are unrealistic in comparison with TRMM data. These undesirable features might result from two sources. The sigma‐type vertical coordinate used in the vertical discretization of the GEOS GCM can generate numerical noise over steep mountains, building excessive CAPE in that region. Over the relatively flat Asian islands, the most probable source of this behavior is the two trigger built‐in functions of GF associated with the moist convergence and the low‐level grid‐scale vertical velocity, see Grell and Devenyi (2002) for further details. The ocean‐land‐ocean contrast, in conjunction with the coarse model resolution, might artificially enhance the upward vertical motion over the islands. The IFS model also applies a sigma‐type vertical coordinate, but its simulation is superior in those regions. Table 4 introduces the spatial correlation parameter, RMSE, and bias of the GEOS‐GF and IFS models precipitation simulation using TRMM rainfall product as a reference. The IFS model presents better larger spatial correlation and smaller RMSE in comparison with GEOS‐GF, but both models have comparable bias. Figure 8 shows the histogram of the precipitation amounts as observed by TRMM and simulated by IFS and GEOS‐GF. The amounts were binned in 1 mm d−1. For this period, the maximum quantity found in TRMM data was 39 mm d−1, while the IFS and GEOS‐GF simulated amounts up to 49 mm d−1. Both GCMs fairly represent the observed occurrence frequency in the range of 1 to approximately 30 mm d−1, but do not in the upper range. However, the occurrence frequency of the simulated extreme precipitation events not reported in the TRMM observation is not substantial, being less than 0.1% for GEOS‐GF and even smaller for IFS.
Table 4.
Skill Scores of the GEOS‐GF and IFS Models Precipitation in Comparison With TRMM Rainfall Data
| July 2015 | January 2016 | |||
|---|---|---|---|---|
| GEOS‐GF | IFS | GEOS‐GF | IFS | |
| CORR parameter | 0.79 | 0.88 | 0.78 | 0.89 |
| RMSE (mm d−1) | 2.55 | 1.97 | 2.64 | 1.85 |
| BIAS (mm d−1) | 0.16 | 0.16 | 0.22 | 0.25 |
Figure 9 depicts the zonally averaged monthly mean of precipitation for the two periods as informed by the observations and models introduced above. Looking at the remote sensing‐derived observations (plots a and c), the meridional migration of the ITCZ from July to January is clear. In July, the ITCZ is confined in a narrow region between the Equator and latitude 15°N, with zonal mean up to 9 mm d−1 by TRMM and CMORPH, and 8 mm d−1 by the other observational estimates. In January, the ITCZ is located from the Equator to 15 S, occupying a relatively broader area and the precipitation zonal mean lies between 5 and 6 mm d−1, and all the observational estimates are close to each other. The observational estimates, however, mostly disagree in the extratropical latitudes. For example, in January, GPM and TRMM have relatively large discrepancies around latitudes 40°S and 20°S with GPCP lying between them. In both time periods, the simulated precipitation with GEOS GF seems to be very reliable, closely following GPCP. The main exceptions are in July where GEOS GF overestimates the precipitation over latitudes between 15°S and 25°S and 45°N and 75°N.
Figure 9.
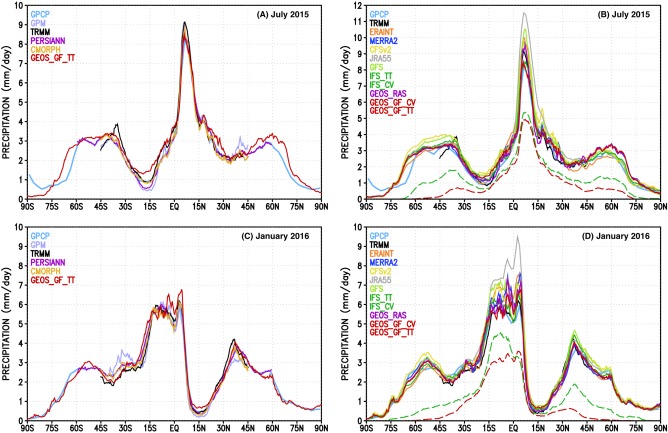
Zonally averaged monthly mean of precipitation (mm d−1) for July 2015 and January 2016. Data (left column) from remote sensing based observations and (right column) by models weather forecasts and global atmospheric reanalysis are shown with continuous lines. Model GEOS GF total precipitation appears in both columns. On the right side, dashed lines represent the precipitation amount associated with the convection parameterizations of GEOS GF and IFS.
In contrast to the remote sensing‐derived estimates, the model‐based estimates (reanalysis and simulations) disagree to a larger extent. In July (plot b), a large overestimation is seen over the ITCZ region, with JRA55 and GFS being the largest, with maxima above 11 and 10 mm d−1, respectively. ERAINT, CFSv2, MERRA‐2, and GEOS RAS are just above the TRMM amount (∼9 mm d−1). IFS and GEOS GF have similar peaks, and are close to GPCP. The other regions of large discrepancy are in the high latitudes. In the region limited by 45°N and 75°N, ERAINT, IFS, GFS, and CFSv2 are close to GPCP. MERRA‐2, GEOS RAS, and GEOS GF are very close and slightly overestimate the precipitation in comparison with GPCP, but this feature might be associated with the large‐scale precipitation from the single‐moment microphysics scheme that the three models share. In the region limited by 35°S and 60°S, ERAINT, IFS, MERRA‐2, GEOS RAS, and GEOS GF are very close to GPCP, while GFS and CFSv2 overestimate the precipitation. Dashed lines in plot b represent the precipitation from the convective parameterizations of IFS and GEOS GF. In the ITCZ region, both convective parameterizations participate with ∼60% of the total precipitation. In high‐latitude areas, the IFS convective precipitation has a larger contribution to the total. For January (plot d), the precipitation simulated by JRA55 is also in contrast with the others, showing a relatively large overestimation in comparison to GPCP over the ITCZ region. Most of the other models also overestimate the precipitation to some degree, with IFS and GEOS GF being closer to GPCP and TRMM.
A general view of the model forecast and reanalysis estimates of the global mean precipitation is shown in Table 5. In addition to the global mean precipitation from GPCP, the table also includes the CPC Merged Analysis of Precipitation (CMAP; Xie & Arkin, 1997), which estimates the global mean as 2.64 and 2.69 mm d−1, in contrast with GPCP values of 2.71 and 2.83 mm d−1, for July 2015 and January 2016, respectively. All model forecasts and reanalyses employed in this study overestimate the global mean precipitation relative to the GPCP and CPC amounts. GEOS RAS is the closest one and is followed by IFS. JRA55, CFSv2, and GFS largely overestimate the global precipitation with values above ∼3.20 mm d−1. GEOS GF simulates values of 3.01 and 2.91 mm d−1, and is in the lower end of the simulated range of values.
Table 5.
Global Mean Precipitation Rate by Observations and Model Weather Forecasts and Reanalysis for July 2015 and January 2016
| Observations/models (mm d−1) | July 2015 | January 2016 |
|---|---|---|
| JRA55 | 3.38 | 3.36 |
| CFSv2 | 3.34 | 3.19 |
| GFS | 3.29 | 3.19 |
| MERRA‐2 | 3.05 | 2.95 |
| GEOS_GF | 3.01 | 2.91 |
| ERAINT | 3.00 | 2.93 |
| IFS | 2.98 | 2.92 |
| GEOS_RAS | 2.93 | 2.88 |
| GPCP | 2.71 | 2.83 |
| CMAP | 2.64 | 2.69 |
We shall now focus our discussion on the intradiurnal variability of the precipitation simulated by the model weather forecasts and reanalyses. As before, we start by showing the monthly average of the diurnal cycle of the precipitation on a global scale as well as grouped over only land and only ocean areas. Figure 10 depicts the results for July 2015 (left column) and January 2016 (right column). Here we only retain the observation‐based estimations from GPCP and TRMM to evaluate the amplitude and phase of the simulated diurnal cycles of precipitation by the models. Reinforcing the early discussion, JRA55, CFSv2, and GFS overestimate the precipitation amount in comparison with both TRMM and GPCP on a global scale and for July 2015 (see plot a). Additionally, MERRA‐2, GEOS RAS, GEOS GF, and ERAINT also simulated higher precipitation rate values than GPCP, but those lie very close to the TRMM amount. Regarding the simulated phase of the precipitation, all models captured well the nocturnal peak over ocean with a further decline in the daytime, as seen in plot c as well. Over land, the contrasts between the models are much more pronounced (plot b). TRMM shows a very well‐defined diurnal cycle with a minimum precipitation rate around 9 A.M. and a peak in late afternoon (∼6 P.M.). MERRA‐2 has a flatter cycle, while the others are more pronounced, having relatively larger amplitudes. ERAINT, CFSv2, GFS, and JRA55 show an earlier increase of the precipitation rate, all before 9 A.M., a few hours before TRMM. On the other hand, GEOS GF and GEOS RAS seem to reproduce the TRMM diurnal cycle better, with the precipitation rate increasing around ∼11 A.M. and peaking much closer to the time of TRMM. However, GEOS GF has a better phase than GEOS RAS, with both peaks (nocturnal and diurnal) close to the TRMM, as demonstrated in plots a and d. The early peaking of some of the models and reanalyses is also accompanied by an earlier shutdown of the nighttime precipitation over land, which is very clear for ERAINT and CFSv2, and somewhat also for GFS and JRA55. GEOS GF and GEOS RAS also seem to better represent the nighttime precipitation. A discussion similar to the above holds for the January 2016 case, as shown in Figures 10d–10f.
Figure 10.
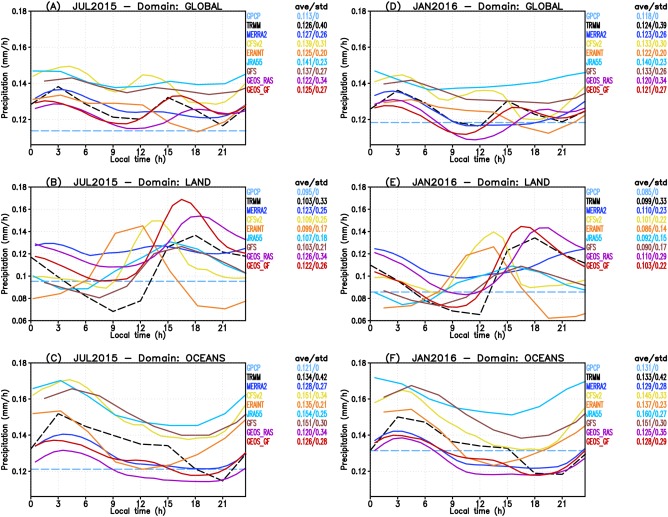
Diurnal cycle of precipitation from remote sensing‐derived observations and several models forecast and reanalysis. (a–c) July 2015 monthly averaged results for the global, only land and only ocean domains, respectively. (d–f) The correspondent results for January 2016. Observations (model results) are shown in dashed (continuous) lines.
The performance of the model forecasts and reanalysis in the representation of the diurnal cycle can be mostly explained by the closures employed in their respective convection parameterizations to determine the mass flux at cloud base. CFSv2 and GFS share the Simplified Arakawa‐Schubert (Han & Pan, 2011; Pan & Wu, 1995) convection parameterization, in which the closure follows Grell (1993). This closure is based on an instantaneous removal of instability measured in terms of the cloud work function, which is diagnosed for an air parcel with source level in the boundary layer. In this case, the diurnal cycle of the convection is tightly connected with the surface buoyancy flux. The JRA55 convection parameterization is mainly based on a prognostic version of the Arakawa‐Schubert scheme described in Onogi et al. (2007) but with the inclusion of a trigger function based on Xie and Zhang (2000). As before, its closure also applies the concept of instability removal related to the cloud work function, which is diagnosed using air parcels that originate in the boundary layer. The inclusion of the trigger function described in Xie and Zhang (2000) might be mainly responsible for producing peaks of precipitation around late afternoon as in the TRMM data, as seen in Figures 10b and 10e. The ERA‐Interim reanalysis employs the IFS model version CY31R2, which does not include the nonequilibrium closure described in Bechtold et al. (2014), and this absence mostly explains its performance discussed here. As stated before, the model GEOS RAS employs the Relaxed Arakawa‐Schubert convection parameterization. RAS is also based on the concept of the cloud work function as a measure of the energy available for the convection, which is diagnosed using air parcels originating in the boundary layer. Even so, it simulates a reliable diurnal cycle. The most probable explanation for its performance in terms of the diurnal cycle timing is its multiple plume interaction approach. However, MERRA‐2 reanalysis also employs the GEOS GCM with RAS scheme but shows poorer performance; the reasons for this result remain unclear. Finally, the relatively good performance of GEOS GF is mostly attributed to the extension of its original closures by including the nonequilibrium approach from Bechtold et al. (2014).
For the sake of conciseness, we refer to Appendix A for the readers interested in the regionalization of the present analysis over the subdomains introduced in Figure 4.
5. Quantitative Evaluation From Short‐Range Weather Forecasts
In this section, we provide a quantitative evaluation of atmospheric forecasts of the GEOS GCM with three configurations already introduced: GEOS, with its usual convection parameterization (the RAS scheme); and GEOS employing the GF scheme in two different configurations. For GEOS with the GF scheme, we discuss the results of forecasts with and without the impact of the diurnal cycle closure on model performance. The evaluation encompasses the temperature (T), water vapor mixing ratio (Q) and the horizontal wind components (U,V). The skill of the model forecasts is measured in terms of the root‐mean‐square error (RMSE) and the mean error (BIAS) as compared to the atmospheric analysis routinely produced at the Global Modeling and Assimilation Office using the 4‐D ensemble variational technique. It is also noteworthy that the analysis files used as the reference solution for calculating the performance indicators above were produced with the usual physics configuration of GEOS GCM (i.e., employing the RAS scheme). That represents some disadvantage for the GEOS GF forecast quantitative evaluation.
Figure 11 shows the monthly mean BIAS and RMSE of the four quantities mentioned above for January 2016 (column at left) and July 2015 (column at right). The skill scores are shown as a vertical profile from 1,000 to 100 hPa of the global mean. Also, only the skill scores after 120 h of time integration (forecast day 5) are presented. The top row of Figures 11a and 11e shows the skill score of the temperature. GEOS RAS has a cold bias almost throughout the surface to 100 hPa for the two time periods. GEOS GF improves the model forecast by reducing the bias from surface to ∼250 hPa but makes it slightly worse from that level to 100 hPa. For January, the vertical mean of the RMSE decreases from 1.835 K with RAS to 1.812 K with GF without the diurnal cycle closure (DC0). A further RMSE decrease is achieved (1.802 K) when the diurnal cycle closure is employed in the forecast simulation. In July (plot e) similar findings are present. Regarding Q, the BIAS is not substantially altered in absolute value for January (plot b) with the GF scheme, but it is strongly ameliorated in July (plot f), becoming nearly zero. Similar to the temperature behavior, the zonal wind component U (plots c and g) has a worse bias in upper levels, with a slight improvement from surface to 300 hPa in both months, for the forecasts with the GF scheme. These forecasts have smaller RMSE, in a vertical average sense, and, as before, the RMSE is even smaller with the diurnal cycle closure. For the meridional wind component (plots d and h), GF has a quasi‐neutral impact on the BIAS, showing very similar results as for the RAS scheme. But, as with the zonal wind case, the GF scheme with or without the diurnal cycle closure results in smaller RMSEs.
Figure 11.
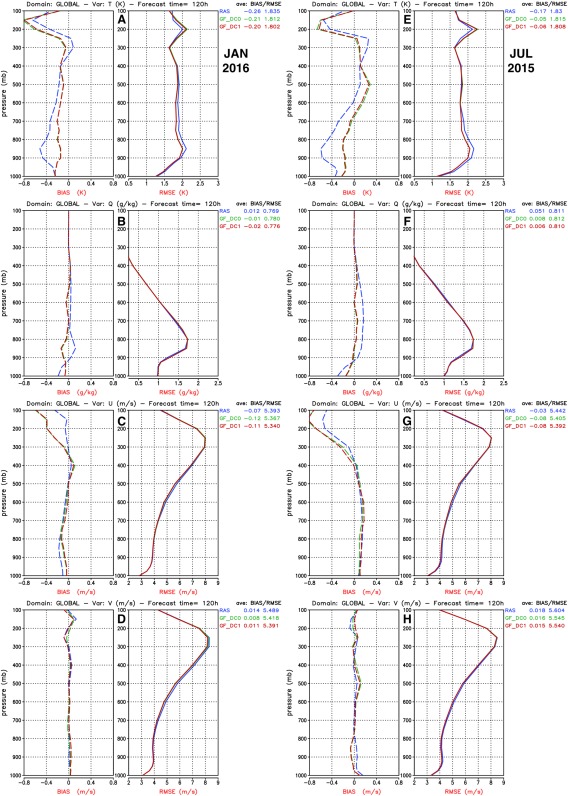
Skill scores of GEOS GCM short‐range weather forecasts for (left) January 2016 and (right) July 2015. The skill scores are the root‐mean‐square error (RMSE) and the mean error (BIAS) of (a, e) temperature (T), (b, f) water vapor mixing ratio (Q), and (c, d, g, and h) the horizontal wind components (U, V). The results are shown in terms of the vertical profile of the global mean of RMSE and BIAS after 120 h of time integration. Three GEOS GCM configurations are shown: GEOS with RAS scheme (blue), GEOS with GF including (red), or not (green) the diurnal cycle closure.
The time evolution of the anomaly correlation (ACORR) of the geopotential height at 500 hPa is shown in Figure 12. The results represent the global mean from forecast day 0 to day 5. For July 2015 (plot a), forecasts with GEOS GF are marginally better than the control run (GEOS RAS). On the other hand, for January 2016 (plot b), the GEOS GF's ACCOR is distinctly better, with the difference from the control run being higher than the statistical significance interval. The simulation with GEOS GF discussed here applied the diurnal cycle of closure, and the results are nearly indistinguishable in comparison to a simulation without it (not shown).
Figure 12.
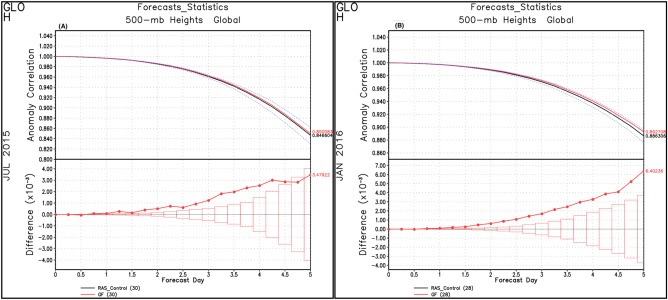
Global mean of the anomaly correlation of the geopotential height at 500 hPa from forecast day 0 to day 5 for (a) July 2015 and (b) January 2016. GEOS RAS is the control simulation. GEOS GF results are shown in red. The bottom plots in each plot denote the difference between GEOS GF and the control run and the vertical boxes delimit the statistical significance interval.
The same time evolution, but now for the RMSE of the Q, T, U, and V, are shown in Figure 13 and, as before, they represent the time evolution of the global mean from forecast day 0 to day 5. For July 2015 (at right), the RMSE of Q (plot a), T (plot b), U (plot c), and V (plot d) demonstrates that the simulation GEOS GF, if not better (as for Q, U, and V with an RMSE smaller than the control run), is nearly neutral (as for T, plot b). For January 2016 (at left), similar behavior is seen. In particular, it is observed that GEOS GF forecasts have larger RMSE than the control run at the beginning of the forecast. However, the difference between them becomes eventually smaller, and even negative after forecast day 1 or so, indicating that GEOS GF forecasts outperform GEOS RAS after that time period.
Figure 13.
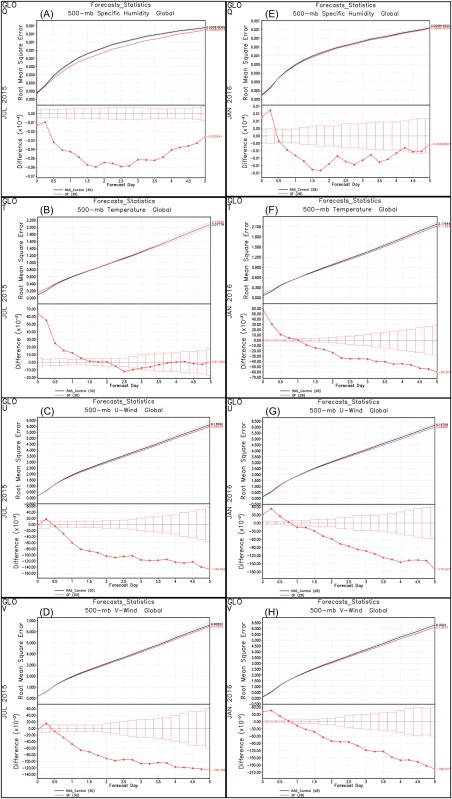
Global mean of root‐mean‐square error at 500 hPa from forecast day 0 to day 5 for (at right) July 2015 and (at left) January 2016. GEOS RAS is the control simulation. GEOS GF with the diurnal cycle closure results are shown in red. From top to bottom, the RMSE of (a, e) specific humidity (Q), (b, f) temperature (T), and (c, g, d, and h) the horizontal wind components (U, V) are depicted. The bottom plots in each plot denote the difference of the RMSE between GEOS GF and the control run (GEOS RAS), and the vertical boxes delimit the statistical significance interval.
6. Conclusions
We implemented an alternative convection parameterization, originally described in Grell and Freitas (2014), along with recent developments and extensions, in the NASA GEOS modeling and assimilation system. In this paper, we focused two important features of GF, which we expect will be useful in applications of this global‐scale model:
the scale‐dependence approach, which seems to work as expected for a cascade of simulations with increasing uniform grid resolution, as it provides a smooth transition from nonresolved to resolved cloud scales and
the trimodal plume design with a diurnal cycle closure, which appears to be a consistent route to addressing the problem of simulating the transition from shallow to deep and precipitating convection regimes over the land, in the context of subgrid‐scale parameterizations.
The runs we were able to make were limited to 72 h forecast, and quantification of the model performance across the resolutions from 50 to 6 km was not possible at this time. However, as entrainment varies with resolution, model biases are likely to get different at different resolutions, as we already presented in Grell and Freitas (2014).
The discussion then focused on the evaluation of GEOS GCM with GF scheme for weather time scale applications. GEOS with GF showed both reliable spatial distribution and amount of precipitation in comparison with two state‐of‐the‐art products: TRMM, from the observational point of view, and IFS/ECMWF short‐range weather forecasts, from the modeling one. The rainfall associated with the meridional migration of the ITCZ and the zonal displacement of the Pacific warm pool are well captured, as well as the precipitation over continental areas.
In a global mean, the GEOS GF simulated precipitation amounts were 3.0 and 2.9 mm d−1 which are ∼11% and ∼3% larger than the respective GPCP estimates. To give perspective to these overestimates, the GPCP‐estimated bias error is about ±7%, with a upper bound of 9%, as reported by Adler et al. (2012) using a 10 year data set. Wang et al. (2014) provide an updated climatology of TRMM rainfall estimates using a 15 year data set, which is confined between latitudes 36°S and 36°N. Their analysis for the tropical region, bounded in between 10°N and 10°S, resulted in a mean value of 4.4 mm d−1, close to the value reported by GPCP of 4.5 mm d−1. The simulations with GEOS GF resulted in values in this latitude range of 4.7 and 5.2 mm d−1 for July 2015 and January 2016, respectively. Those values are somewhat higher than the climatologies mentioned earlier. However, the standard deviation of the TRMM climatology can be as high as 1.2–1.4 mm d−1 as shown by Figure 1b in their paper. Indeed, the actual TRMM average values for these specifics months are both close to 4.9 mm d−1, and demonstrate that GEOS GF simulated a precipitation rate that is within the range ∼±5% of TRMM.
Regarding the phase of the precipitation rate, GEOS GF showed reliable skill, both on global as well as regional scales. On global scales, the intradiurnal variations observed by TRMM are appropriately reproduced, as shown in Figures 10a and 10d. On regional scales (Figures A1 and A2), GEOS GF also shows good performance, mainly over the subdomains of the Northern Hemisphere in July 2015.
The global‐scale evaluation of the RMSE, BIAS and anomaly correlation of up to day 5 of the GEOS GF weather forecasts showed some improvement. Perhaps the only exception is the cold bias in upper levels already present in the GEOS RAS weather forecasts. This shortcoming will require a further detailed evaluation of the coupling between GF, cloud microphysics, and radiation schemes in the GEOS GCM.
It is worthwhile to note that the short‐range weather forecasts with the GF scheme employed initial conditions and verification from atmospheric analyses data that were generated using the RAS scheme in its regular production cycle. How the GF scheme will perform by employing an assimilation cycle that applies the convection parameterization itself, is a question that remains for future work.
Future applications of the GF scheme in NASA GEOS GCM will address how the trimodal design impacts the scale‐interaction between the different convection regimes, and how it improves the NASA GEOS GCM simulation of large‐scale structures as the Madden‐Julian Oscillation and tropical cyclones. From the point of view of biogeochemical cycles, the trimodal design and the diurnal cycle capability would allow more realistic vertical redistribution of tracers by convection, in particular the elements of the carbon cycle, by better representing the so‐called rectifier effect. Lastly, the GF scheme brings to NASA GEOS GCM with the FV3 dynamic core the capability of running with uniform or variable horizontal‐grid resolutions across the grey‐zone, which has several useful features for application to both weather and seasonal time scales, as well as operational and research foci.
Acknowledgments
Resources supporting this work were provided by the NASA High‐End Computing (HEC) Program through the NASA Center for Climate Simulation (NCCS) at Goddard Space Flight Center. The authors also acknowledge the Research Data Archive of the Computational and Information Systems Laboratory at the National Center for Atmospheric Research for providing data applied in this work.
Appendix A. Intradiurnal Variability of the Precipitation Simulated by the Models Weather Forecast and Reanalysis: Study Over Subdomains
This appendix supplements the results discussed in the section “Intradiurnal variability of the precipitation simulated by the models weather forecast and reanalysis” by grouping the data and model results in the subdomains indicated in Figure 4. Figure A1 shows the diurnal cycle of the precipitation averaged over July 2015 and grouped over the subdomains named CONUS, ITCZ2, EUR, SAHEL, INDIA, and PACIFIC1. Figure A2 shows the correspondent results for January 2016 averaged over the subdomains Amazon Basin (AMAZON1), Southeast part of Brazil (SEB), part of Africa (AFRICA1), a domain over the Indian Ocean (INDC), Australia (AUST), and over the Pacific Ocean (ITCZ1).
Figure A1.
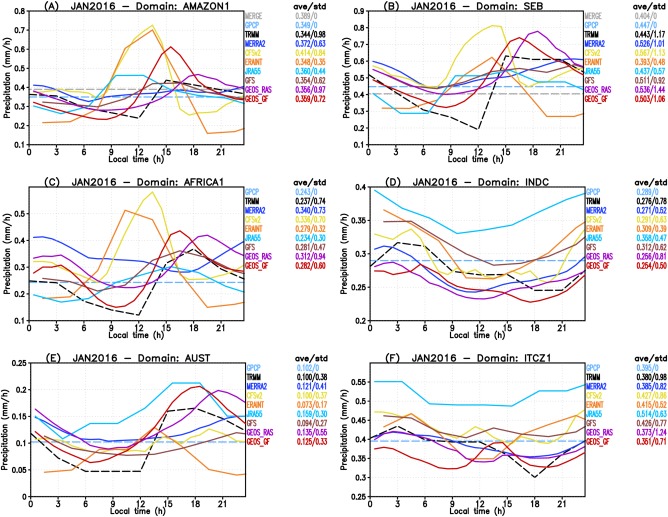
Diurnal cycle of precipitation from remote sensing‐derived observations and several models forecast and reanalysis. The plots show January 2016 monthly averaged results for the subdomains (a) AMAZON1, (b) SEB, (c) AFRICA1, (d) INDC, (e) AUST, and (f) ITCZ1. See Figure 4 for definitions of these regions. Observations (model results) are shown in dashed (continuous) lines.
Figure A2.
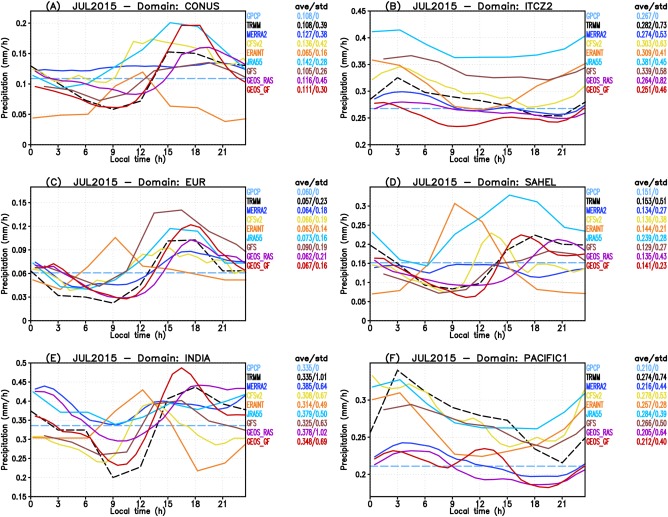
Diurnal cycle of precipitation from remote sensing‐derived observations and several models forecast and reanalysis. The plots show July 2015 monthly averaged results for the subdomains (a) CONUS, (b) ITCZ2, (c) EUR, (d) Sahel, (e) India, and (f) Pacific1 regions. See Figure 4 for definitions of these regions. Observations (model results) are shown in dashed (continuous) lines.
Appendix B. Availability of the Data Sets Applied in This Work
Tables B1 and B2 contain information about how the data sets applied in this work can be accessed.
Table B1.
Precipitation Data Sets Applied in This Work
| Data set | URL |
|---|---|
| GPM (IMERGv04) | http://giovanni.sci.gsfc.nasa.gov |
| CMORPH | http://www.cpc.ncep.noaa.gov |
| TRMM (TMPA, 3B42) | http://giovanni.sci.gsfc.nasa.gov |
| PERSIANN | http://chrsdata.eng.uci.edu |
| MERGE | ftp://ftp1.cptec.inpe.br/modelos/io/produtos/MERGE |
| GPCP v2.1 | https://www.esrl.noaa.gov/psd/data/gridded/data.gpcp.html |
Table B2.
Reanalysis and Model Weather Forecasts Applied in This Work
| Data set | URL | DOI |
|---|---|---|
| ERA‐Interim | https://rda.ucar.edu/datasets/ds627.2 | 10.5065/D64747WN |
| JRA55 | https://rda.ucar.edu/datasets/ds628.0 | 10.5065/D6HH6H41 |
| CFSv2 | https://rda.ucar.edu/datasets/ds094.1 | 10.5065/D6N877VB |
| MERRA‐2 | https://rda.ucar.edu/datasets/ds313.3 | N/A |
| GFS | http://www.nco.ncep.noaa.gov/pmb/products/gfs | N/A |
| IFS | https://www.ecmwf.int/en/forecasts/datasets | N/A |
| GEOS | https://gmao.gsfc.nasa.gov/gmaoftp/srfreita/JAMES-2017MS001251 | N/A |
Freitas, S. R. , Grell, G. A. , Molod, A. , Thompson, M. A. , Putman, W. M. , Santos e Silva, C. M. , & Souza, E. P. (2018). Assessing the Grell‐Freitas convection parameterization in the NASA GEOS modeling system. Journal of Advances in Modeling Earth Systems, 10, 1266–1289. 10.1029/2017MS001251
References
- Adler, R. F. , Gu, G. , & Huffman, G. J. (2012). Estimating climatological bias errors for the Global Precipitation Climatology Project (GPCP). Journal of Applied Meteorology and Climatology, 51, 84–99. 10.1175/JAMC-D-11-052.1 [DOI] [Google Scholar]
- Adler, R. F. , Huffman, G. J. , Chang, A. , Ferraro, R. , Xie, P. , Janowiak, J. , et al. (2003). The version‐2 Global Precipitation Climatology Project (GPCP) monthly precipitation analysis (1979–present). Journal of Hydrometeorology, 4, 1147–1167. [Google Scholar]
- Arakawa, A. , Jung, J.‐H. , & Wu, C.‐M. (2011). Toward unification of the multiscale modeling of the atmosphere. Atmospheric Chemistry and Physics, 11, 3731–3742. 10.5194/acp-11-3731-2011 [DOI] [Google Scholar]
- Arakawa, A. , & Schubert, W. H. (1974). Interaction of a cumulus cloud ensemble with the large‐scale environment, Part I. Journal of the Atmospheric Sciences, 31, 674–701. 10.1175/1520-0469(1974)031-0674:IOACCE-2.0.CO;2 [DOI] [Google Scholar]
- Bacmeister, J. T. , Suarez, M. J. , & Robertson, F. R. (2006). Rain reevaporation, boundary layer‐convection interactions, and Pacific rainfall patterns in a AGCM. Journal of the Atmospheric Sciences, 63, 3383–3403. [Google Scholar]
- Bechtold, P. , Semane, N. , Lopez, P. , Chaboureau, J. , Beljaars, A. , & Bormann, N. (2014). Representing equilibrium and non‐equilibrium convection in large‐scale models. Journal of the Atmospheric Sciences, 71, 734–753. 10.1175/JAS-D-13-0163.1 [DOI] [Google Scholar]
- Chou, M.‐D. , & Suarez, M. J. (1994). An efficient thermal infrared radiation parameterization for use in general circulation models. NASA Tech. Memo. 104606 (Vol. 3). Greenbelt, MD: Goddard Space Flight Center, NASA. [Google Scholar]
- Chou, M.‐D. , & Suarez, M. J. (1999). A solar radiation parameterization for atmospheric studies. NASA Tech. Memo. 104606 (Vol. 15). Greenbelt, MD: Goddard Space Flight Center, NASA. [Google Scholar]
- Dee, D. P. , Uppala, S. M. , Simmons, A. J. , Berrisford, P. , Poli, P. , Kobayashi, S. , et al. (2011). The ERA‐Interim reanalysis: Configuration and performance of the data assimilation system. Quarterly Journal of the Royal Meteorological Society, 137, 553–597. 10.1002/qj.828 [DOI] [Google Scholar]
- Donner, L. J. , & Phillips, V. T. (2003). Boundary layer control on convective available potential energy: Implications for cumulus parameterization. Journal of Geophysical Research, 108(D22), 4701. 10.1029/2003JD003773 [DOI] [Google Scholar]
- Fowler, L. D. , Skamarock, W. C. , Grell, G. A. , Freitas, S. R. , & Duda, M. G. (2016). Analyzing the Grell‐Freitas convection scheme from hydrostatic to nonhydrostatic scales within a global model. Monthly Weather Review, 144, 2285–2306. 10.1175/MWR-D-15-0311.1 [DOI] [Google Scholar]
- Freitas, S. R. , Panetta, J. , Longo, K. M. , Rodrigues, L. F. , Moreira, D. S. , Rosario, N. E. , et al. (2017). The Brazilian developments on the Regional Atmospheric Modeling System (BRAMS 5.2): An integrated environmental model tuned for tropical areas. Geoscientific Model Development, 10, 189–222. 10.5194/gmd-10-189-2017 [DOI] [PMC free article] [PubMed] [Google Scholar]
- Gelaro, R. , McCarty, W. , Suarez, M. J. , Todling, R. , Molod, A. , Takacs, L. , et al. (2017). The Modern‐Era Retrospective Analysis for Research and Applications, Version 2 (MERRA‐2). Journal of Climate, 30, 5419–5454. 10.1175/JCLI-D-16-0758.1 [DOI] [PMC free article] [PubMed] [Google Scholar]
- Gerard, L. (2007). An integrated package for subgrid convection, clouds and precipitation compatible with meso‐gamma scales. Quarterly Journal of the Royal Meteorological Society, 133, 711–730. 10.1002/qj.58 [DOI] [Google Scholar]
- Gerard, L. , Piriou, J. , Brozkova, R. , Geleyn, J. , & Banciu, D. (2009). Cloud and precipitation parameterization in a meso‐gamma‐scale operational weather prediction model. Monthly Weather Review, 137, 3960–3977. 10.1175/2009MWR2750.1 [DOI] [Google Scholar]
- GFS . (2016). The Global Forecast System (GFS) – Global Spectral Model (GSM) version 13.0.2. College Park, MD: Global Climate and Weather Modeling Branch, NOAA Center for Weather and Climate Prediction; Retrieved from http://www.emc.ncep.noaa.gov/GFS/doc.php [Google Scholar]
- Grant, A. L. M. (2001). Cloud‐base fluxes in the cumulus‐capped boundary layer. Quarterly Journal of the Royal Meteorological Society, 127(572), 407–421. [Google Scholar]
- Gregory, D. , Morcrette, J.‐J. , Jakob, C. , Beljaars, A. C. M. , & Stockdale, T. (2000). Revision of convection, radiation and cloud schemes in the ECMWF integrated forecasting system. Quarterly Journal of the Royal Meteorological Society, 126, 1685–1710. 10.1002/qj.49712656607 [DOI] [Google Scholar]
- Grell, G. A. (1993). Prognostic evaluation of assumptions used by cumulus parameterizations. Monthly Weather Review, 121, 764–787. 10.1175/1520-0493(1993)121-0764:PEOAUB-2.0.CO;2 [DOI] [Google Scholar]
- Grell, G. A. , & Devenyi, D. (2002). A generalized approach to parameterizing convection combining ensemble and data assimilation techniques. Geophysical Research Letters, 29(14), 1693. 10.1029/2002GL015311 [DOI] [Google Scholar]
- Grell, G. A. , & Freitas, S. R. (2014). A scale and aerosol aware stochastic convective parameterization for weather and air quality modeling. Atmospheric Chemistry and Physics, 14, 5233–5250. 10.5194/acp-14-5233-2014 [DOI] [Google Scholar]
- Han, J. , & Pan, H. (2011). Revision of convection and vertical diffusion schemes in the NCEP global forecast system. Weather and Forecasting, 26, 520–533. 10.1175/WAF-D-10-05038.1 [DOI] [Google Scholar]
- Huffman, G. J. , Adler, R. F. , Bolvin, D. T. , Gu, G. J. , Nelkin, E. J. , Bowman, K. P. , et al. (2007). The TRMM multi‐satellite precipitation analysis (TMPA): Quasi‐global, multiyear, combined‐sensor precipitation estimates at fine scales. Journal of Hydrometeorology, 8, 38–55. [Google Scholar]
- Johnson, R. H. , Rickenbach, T. M. , Rutledge, S. A. , Ciesielski, P. E. , & Schubert, W. H. (1999). Trimodal characteristics of tropical convection. Journal of Climate, 12, 2397–2418. 10.1175/1520-0442(1999)012-2397:TCOTC-2.0.CO;2 [DOI] [Google Scholar]
- Joyce, R. J. , Janowiak, J. E. , Arkin, P. A. , & Xie, P. (2004). CMORPH: A method that produces global precipitation estimates from passive microwave and infrared data at high spatial and temporal resolution. Journal of Hydrometeorology, 5, 487–503. [Google Scholar]
- Kobayashi, S. , Ota, Y. , Harada, Y. , Ebita, A. , Moriya, M. , Onoda, H. , et al. (2015). The JRA‐55 reanalysis: General specifications and basic characteristics. Journal of the Meteorological Society of Japan, 93(1), 5–48. 10.2151/jmsj.2015-001 [DOI] [Google Scholar]
- Kuell, V. , Gassmann, A. , & Bott, A. (2007). Towards a new hybrid cumulus parametrization scheme for use in non‐hydrostatic weather prediction models. Quarterly Journal of the Royal Meteorological Society, 133, 479–490. 10.1002/qj.28 [DOI] [Google Scholar]
- Kwon, Y. C. , & Hong, S.‐Y. (2017). A Mass‐Flux cumulus parameterization scheme across gray‐zone resolutions. Monthly Weather Review, 145, 583–598. 10.1175/MWR-D-16-0034.1 [DOI] [Google Scholar]
- Lim, K.‐S. , Hong, S.‐Y. , Yoon, J.‐H. , & Han, J. (2014). Simulation of the summer monsoon rainfall over East Asia using the NCEP GFS cumulus parameterization at different horizontal resolutions. Weather and Forecasting, 29, 1143–1154. 10.1175/WAF-D-13-00143.1 [DOI] [Google Scholar]
- Lock, A. P. , Brown, A. R. , Bush, M. R. , Martin, G. M. , & Smith, R. N. B. (2000). A new boundary layer mixing scheme. Part I: Scheme description and single‐column model tests. Monthly Weather Review, 138, 3187–3199. [Google Scholar]
- Louis, J. , & Geleyn, J. (1982). A short history of the PBL parameterization at ECMWF. Paper presented at the Proceedings of the ECMWF Workshop on Planetary Boundary Layer Parameterization (ECMWF, 5980), Reading, UK.
- Molod, A. , Takacs, L. , Suarez, M. , & Bacmeister, J. (2015). Development of the GEOS‐5 atmospheric general circulation model: Evolution from MERRA to MERRA2. Geoscientific Model Development, 8, 1339–1356. 10.5194/gmd-8-1339-2015 [DOI] [Google Scholar]
- Moorthi, S. , & Suarez, M. J. (1992). Relaxed Arakawa Schubert: A parameterization of moist convection for general circulation models. Monthly Weather Review, 120, 978–1002. [Google Scholar]
- Onogi, K. , Tsutsui, J. , Koide, H. , Sakamoto, M. , Kobayashi, S. , Hatsushika, H. , et al. (2007). The JRA‐25 reanalysis. Journal of the Meteorological Society of Japan, 85, 369–432. [Google Scholar]
- Pan, H.‐L. , & Wu, W.‐S. (1995). Implementing a mass flux convective parameterization package for the NMC medium‐range forecast model (NMC Office Note 409, 40 pp.).
- Picaut, J. , Ioualalen, M. , Menkes, C. , Delcroix, T. , & Mcphaden, M. J. (1996). Mechanism of the zonal displacements of the Pacific warm pool: Implications for ENSO. Science, 29, 1486–1489. [DOI] [PubMed] [Google Scholar]
- Putman, W. , & Lin, S.‐J. (2007). Finite volume transport on various cubed sphere grids. Journal of Computational Physics, 227, 55–78. 10.1016/j.jcp.2007.07.022 [DOI] [Google Scholar]
- Reynolds, R. W. , Rayner, N. A. , Smith, T. M. , Stokes, D. C. , & Wang, W. (2002). An improved in situ and satellite SST analysis for climate. Journal of Climate, 15, 1609–1625. [Google Scholar]
- Rozante, J. R. , Moreira, D. S. , de Goncalves, L. G. , & Vila, D. A. (2010). Combining TRMM and surface observations of precipitation: Technique and validation over South America. Weather and Forecasting, 25, 885–894. 10.1175/2010WAF2222325.1 [DOI] [Google Scholar]
- Saha, S. , Moorthi, S. , Wu, X. , Wang, J. , Nadiga, S. , Tripp, P. , et al. (2014). The NCEP climate Forecast system version 2. Journal of Climate, 27, 2185–2208. 10.1175/JCLI-D-12-00823.1 [DOI] [Google Scholar]
- Sorooshian, S. , Nguyen, P. , Sellars, S. , Braithwaite, D. , AghaKouchak, A. , & Hsu, K. (2014). Satellite‐based remote sensing estimation of precipitation for early warning systems In Ismail‐Zadeh A. et al. (Eds.), Extreme natural hazards, disaster risks and societal implications (special publications of the International Union of Geodesy and Geophysics) (pp. 99–112). Cambridge, UK: Cambridge University Press; 10.1017/CBO9781139523905.011 [DOI] [Google Scholar]
- Wang, J. , Adler, R. F. , Huffman, G. J. , & Bolvin, D. (2014). An updated TRMM composite climatology of tropical rainfall and its validation. Journal of Climate, 27, 273–284. 10.1175/JCLI-D-13-00331.1 [DOI] [Google Scholar]
- Xie, P. , & Arkin, P. A. (1997). Global precipitation: A 17‐year monthly analysis based on gauge observations, satellite estimates, and numerical model outputs. Bulletin of the American Meteorological Society, 78, 2539–2558. [Google Scholar]
- Xie, S. , & Zhang, M. (2000). Impact of the convection triggering function on single‐column model simulations. Journal of Geophysical Research, 105, 14983–14996. [Google Scholar]
- Yang, S. , Kuo, K. S. , & Smith, E. A. (2008). Persistent nature of secondary diurnal modes of precipitation over oceanic and continental regimes. Journal of Climate, 21, 4115–4413. 10.1175/2008JCLI2140.1 [DOI] [Google Scholar]
- Zhang, G. J. (2002). Convective quasi‐equilibrium in midlatitude continental environment and its effect on convective parameterization. Journal of Geophysical Research, 107(D14), 4220. 10.1029/2001JD001005 [DOI] [Google Scholar]
- Zhang, G. J. (2003a). Convective quasi‐equilibrium in the tropical western Pacific: Comparison with midlatitude continental environment. Journal of Geophysical Research, 108(D19), 4592. 10.1029/2003JD003520 [DOI] [Google Scholar]
- Zhang, G. J. (2003b). Roles of tropospheric and boundary layer forcing in the diurnal cycle of convection in the U.S. Southern Great Plains. Geophysical Research Letters, 30(24), 2281. 10.1029/2003GL018554 [DOI] [Google Scholar]
- Zhang, G. J. , & McFarlane, N. A. (1995). Sensitivity of climate simulations to the parameterization of cumulus convection in the Canadian climate centre general circulation model. Atmosphere‐Ocean, 33, 407–446. [Google Scholar]


