

Abstract
Climate models have consistently projected a drying trend in the southwestern United States, aiding speculation of increasing dust storms in this region. Long‐term climatology is essential to documenting the dust trend and its response to climate variability. We have reconstructed long‐term dust climatology in the western United States, based on a comprehensive dust identification method and continuous aerosol observations from the Interagency Monitoring of Protected Visual Environments (IMPROVE) network. We report here direct evidence of rapid intensification of dust storm activity over American deserts in the past decades (1988–2011), in contrast to reported decreasing trends in Asia and Africa. The frequency of windblown dust storms has increased 240% from 1990s to 2000s. This dust trend is associated with large‐scale variations of sea surface temperature in the Pacific Ocean, with the strongest correlation with the Pacific Decadal Oscillation. We further investigate the relationship between dust and Valley fever, a fast‐rising infectious disease caused by inhaling soil‐dwelling fungus (Coccidioides immitis and C. posadasii) in the southwestern United States. The frequency of dust storms is found to be correlated with Valley fever incidences, with a coefficient (r) comparable to or stronger than that with other factors believed to control the disease in two endemic centers (Maricopa and Pima County, Arizona).
Keywords: dust, Valley fever, climate, air quality, aerosol, health
Key Points
The frequency of locally originated windblown dust storms has increased 240% in 1990‐2011 in the Southwest United States
The dust trends are likely driven by large‐scale variations of sea surface temperature in the Pacific Ocean
The dust trend is spatially and temporally correlated with incidences of valley fever, an infectious disease caused by soil‐dwelling fungus
1. Background
Suspended dust particles affect regional and global climate directly through scattering and absorption of solar radiation [Tegen and Lacis, 1996; Sokolik and Toon, 1996; Chin et al., 2002], and indirectly through serving as ice and cloud condensation nuclei, and through supplying bioavailable iron that increases primary productivity and hence sink carbon dioxide [DeMott et al., 2003; Zhuang et al., 1992]. In addition, dust aerosols act at times as a powerful vehicle to cascade the impacts of global climate variations onto the environment and society at local scale. In the 1930s, an extended drought in the United States, coupled with high winds, economic depression, and poor land management, led to numerous large dust storms—collectively producing an environmental catastrophe known as the “Dust Bowl” [Lee and Gill, 2015]. These storms devastated the land and forced millions of farmers to migrate into Valley fever‐infested areas and risky agricultural occupations [Worster, 1979; Sarafoglou et al., 2016]. Although the 1930s drought is severe, reconstructed paleoclimatic records indicate that the southwestern United States has experienced far more extreme and long‐lasting “megadroughts” multiple times in the past ~1000 years [Cook et al., 2010].
Climate model projections suggest a consistent trend toward an increasingly arid climate in the subtropics, including the southwestern United States [Schubert et al., 2004; Seager et al., 2007; Cook et al., 2015; Prein et al., 2016]. The predicted drying trend over arid and semiarid regions aids speculation of more frequent dust storms and even another “Dust Bowl” in the coming decades. For instance, Romm [2011] has argued that the combination of precipitation shift from subtropics, greater evaporation, less snow/ice, and earlier onset of spring can amplify the effects of natural climatic variations (e.g., the El Niño–Southern Oscillation, ENSO). The amplified climatic effects may in turn intensify droughts and lead to “dust‐bowlification” rather than desertification in the Americas [Romm, 2011]. While Dust Bowl‐scale prolonged soil erosion is unlikely, thanks to numerous soil conservation measures implemented after last Dust Bowl [Lee and Gill, 2015], it is important to monitor the long‐term variability of dust storm activity in regions impacted by drought.
There are multiple lines of evidence suggesting that the western United States has become dustier in recent decades [Brahney et al., 2013; Hand et al., 2016; Clow et al., 2016]. Despite decreased anthropogenic emissions, ambient aerosol concentration, and transported dust from Asia and Africa, the frequency and amount of soil dust in dry deposition, rainwater, and snowpack are rising in western North America, and the dust season is peaking earlier [United States Environmental Protection Agency (U.S. EPA), 2016; Sorooshian et al., 2011; Hand et al., 2016; Clow et al., 2016]. A significant increase in rainwater calcium (Ca2+) has been detected by the National Atmospheric Deposition Network from 1994 to 2010 in the western United States, where soil dust is the major source of airborne Ca2+ [Brahney et al., 2013]. This upward trend is a reversal of the decline in the Ca2+ deposition reported in the 1980s [Hedin et al., 1994]. Using snowpack Ca2+ as a surrogate, Clow et al. [2016] show that aeolian dust deposition to snow has increased 80% in the southern Rockies during 1993–2014. Another trend analysis based on ground aerosol monitoring indicates that springtime mean soil concentrations have increased from 1995 to 2014, especially during March (5.4% yr−1) [Hand et al., 2016].
This study provides direct evidence that dust storms in the southwestern United States have become more frequent in the past decades. We examine the dust trend with a newly developed data set of windblown dust storms originating in the Southwest. Dust trends have been investigated with a variety of methods, such as aerosol optical depth monitored from satellites [Ginoux et al., 2012; Lei et al., 2016], visibility‐based weather records [Shao et al., 2013], wet deposition of mineral elements [Brahney et al., 2013], and ground measurements of fine soil [Hand et al., 2016]. Depending on the employed methods, the derived data sets represent various aspects of dust particles. Here we reconstruct the records of historic dust storms from the dust identification approach developed by Tong et al. [2012] and the continuous aerosol ground observations from the Interagency Monitoring of Protected Visual Environments (IMPROVE) monitoring network. The combination of a rigorous dust identification approach and a rich aerosol data set from IMPROVE allows pinpointing dust storm events from local sources and providing reliable dust data including dust frequency, PM10 (particles ≤10 μm in diameter) and PM2.5 (particles ≤2.5 μm in diameter) concentrations, and PM2.5 chemical composition during local dust storms. With this new dust data set, we analyze the variations and trends of dust storm activity. We further investigate linkages between the trend and large‐scale climate variations. Finally, we explore the potential impacts of increasing dust activity on human health by examining the relationship between dust frequency and Valley fever, a fast‐rising infectious disease in the Southwestern United States.
2. Intensification of Dust Storm Activity
The dust identification method separates aerosol samples representing dust storms from nondusty events using five criteria: (1) high PM10 and PM2.5 concentrations, (2) a low ratio of PM2.5 to PM10, (3) high concentrations of crustal elements (Si, Ca, K, Fe, and Ti), (4) low concentrations of anthropogenic components (As, Zn, Cu, Pb, sulfate, nitrate, organic carbon, and elemental carbon), and (5) low enrichment factors of anthropogenic pollution elements (Cu, Zn, Pb, and K). These criteria are selected based on the distinct chemical and physical characteristics of aerosol samples during satellite‐detected dust storms [Tong et al., 2012] (see more information in section S1 in the supporting information or SI). The rationale for choosing these parameters is as follows. PM2.5 and PM10 concentrations during dust events are considerably higher than typical levels [Malm et al., 1994]. A low PM2.5/PM10 ratio is used to exclude high PM events owing to long‐range dust transport or biomass burning, which are dominated by fine particles. The remaining criteria are imposed to distinguish natural dust events from human activities that emit fugitive dust such as agricultural tilling and unpaved road emissions. This approach is then applied to process the ground‐level aerosol observations collected by the IMPROVE network [Malm et al., 1994] to develop a 24 year (1988–2011) dust storm climatology in the western United States. During this period, there have been changes in analytical methods used by the IMPROVE network for some chemical elements in aerosol samples, resulting in changes in detection limits for these species [Hyslop et al., 2015]. However, it is expected that the change of IMPROVE analytic methods has little effect on the trend data derived from the five‐criteria method, which does not rely solely on elemental concentrations. IMPROVE monitors collect aerosol samples for 24 h every third day at predominantly rural, remote sites, generally far from urban sources. Therefore, the dust records represent the daily aerosol samples dominated by soil dust particles. Among the 187 IMPROVE sites, data from a subset of 29 sites are used in this study based on the continuity and quality of the aerosol data. These sites are located in all major dust source regions in the western United States as identified in Tong et al. [2012].
The new dust climatology reveals a rapid increase in dust storms in the southwestern United States. A total of 2260 dust events were recorded from 1988 to 2011 at 23 sites (Figure 1a). On average, there are approximately 20 dust storms per year recorded at these sites in the 1990s, and 48 storms per year in the 2000s, representing an increase of 240% in two decades. Although not monotonic, the increasing trend is significant with 95% confidence. The least dusty year in the 2000s sees a comparable number of dust storms to that in the dustiest year in the 1990s. This trend stays almost the same when dust frequency, defined as the percentage of dusty days among all days with valid measurements, is used instead. Meanwhile, there is no noticeable trend in the mean PM10 concentration during these dust storms in this same period. There is a downward trend in PM10 on nondusty days, which is not shown here. This finding suggests that ambient PM10 concentration alone is not a reliable indicator of dust activity or variability in this region.
Figure 1.
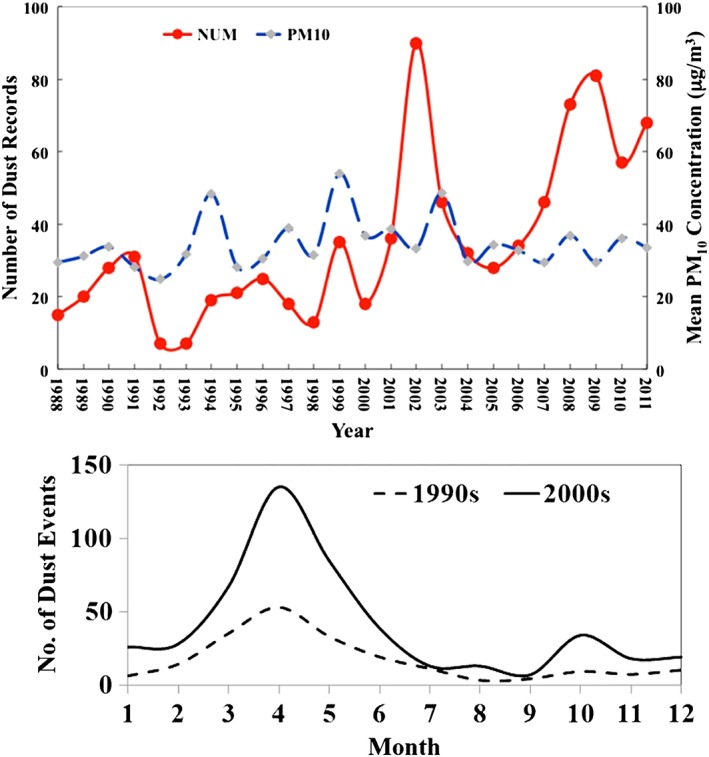
Long‐term variations of dust storm activity over the western United States observed by the IMPROVE network from 1988 to 2011: (a) Numbers of local dust storms (red) and annual means of PM10 concentrations during dusty days recorded from 23 sites from 1988 to 2011. (b) Monthly distribution of dust events in the 1990s and 2000s.
Our results show that dust storms have become more frequent in all seasons except summer, with the increase in spring outnumbering that in other seasons (Figure 1b). The weak dust increase in summer is related to higher soil moisture and vegetation cover, increased monsoon (rainy season) precipitation, and lower incidence of synoptic‐scale dust‐inducing weather phenomena (fronts and cyclones) in the southwestern United States. In addition, the dust season, defined by the length between the first and last events detected at these sites, has become longer (see section S2 for details), consistent with an earlier onset of dust events reported by Hand et al. [2016]. Climate models have robustly predicted an incipient spring drying trend in this region [Seager et al., 2007; Cook et al., 2015; Dai, 2013; Gao et al., 2014], and the observed dust trend could thus be an early signal of its development.
3. Climate Conditions for Enhanced Dust Activity
The increasing trend in dust activity in the western United States is intriguing. Although there are inconsistent reports over different time scales [e.g., Mahowald et al., 2007; Ginoux et al., 2012; Shao et al., 2013; Shepherd et al., 2016], a decreasing dust trend has been reported in major dust regions of the world during the past decades. For instance, a decreasing dust trend has been observed by satellite and ground monitoring in the Saharan region [Evan et al., 2006], where a negative correlation between dust and tropical cyclone activity is linked to the trend of North Atlantic sea surface temperature (SST) [Foltz and McPhaden, 2008]. Long‐term observations of dust frequency show a remarkable declining trend in northern China [Zhu et al., 2008; Guan et al., 2015]. A recent assessment of the global dust trend shows that mean dust concentration has decreased by 1.2% yr−1 between 1974 and 2012 [Shao et al., 2013], due largely to reduced dust activities in Africa, northeastern Asia, and South America that outweigh increases in other source regions (e.g., Middle East [Notaro et al., 2015; Pu and Ginoux, 2016]).
What climate conditions are driving the enhanced dust activity in the southwestern U.S.? Springtime dust storms in this region are primarily driven by the passage of Pacific cold fronts and troughs, causing strong regional pressure gradients and dust‐entraining winds [Westerling et al., 2006; Lawrence et al., 2010; Steenburgh et al., 2012]. Figures 2a and 2b show the decadal differences in the soil moisture field in the United States and the sea surface temperature (SST) of the Pacific Ocean, respectively. In general, soil moisture in the southwestern United States is lower in the 2000s than in the 1990s, which favors the drought conditions needed for enhanced dust storm activity [Prospero and Lamb, 2003; Gao et al., 2014]. In turn, the persistent and/or frequent droughts in the southwestern United States have been upheld by Pacific SST distributions. Figure 2b shows that the North Pacific height was much stronger in the 2000s, maintaining an anomalous SST gradient from north of Hawaii to the Californian coast. Such a SST pattern enhances northerly winds off the Californian coast, which in turn reduces moisture transport from the equatorial Pacific toward California and the southwestern United States, thus promoting drought conditions [Hoerling and Kumar, 2003].
Figure 2.
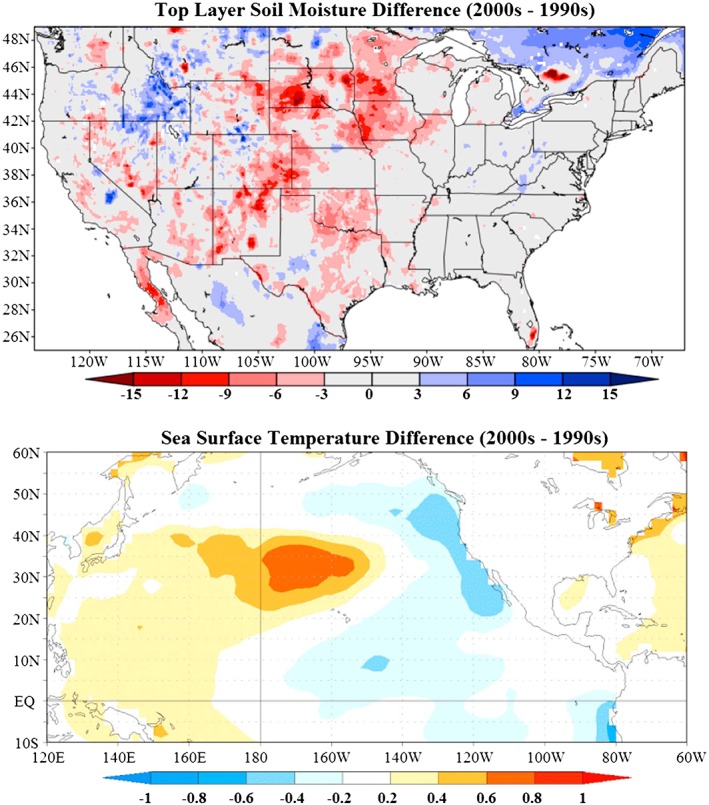
Decadal differences in (a) top layer (0–10 cm) soil moisture in the United States and (b) sea surface temperature (SST) between the 1990s and the 2000s.
Next, we examine which climate indicators are associated with dust storm variability. At an interannual time scale, dust storm activity in drylands such as the southwestern United States is influenced by major climate systems, primarily through their forcing of drought, which modulates many factors related to wind erosion, including soil moisture, soil stability, and land cover [Brazel and Nickling, 1986; Ravi et al., 2010]. A number of climate indices are thus chosen to examine the relationships between dust storms and climate variations. These climate indices include El Niño–Southern Oscillation (ENSO), Pacific Decadal Oscillation (PDO), North Atlantic Oscillation (NAO), Pacific/North American Oscillation (PNA), and Arctic Oscillation (AO). Furthermore, dust records are categorized into two groups: high‐latitude dust (HL dust) region and low‐latitude dust (LL dust) region. The LL dust region includes the low‐latitude North American deserts (Chihuahuan, Mojave, and Sonoran deserts with lower altitudes), while the HL dust region covers the northern high‐latitude North American dust source region including the Great Basin desert and Colorado Plateau (with higher altitudes) that is more frequently and directly impacted by midlatitude westerly circulations such as Pacific cold fronts and cyclones [Steenburgh et al., 2012; Hahnenberger and Nicoll, 2012]. The results presented in Table 1 show that the dust frequency in the southwestern United States is better correlated with PDO, ENSO, and AO than with the other climate indices (see SI for a detailed analysis). The strongest correlation is found between PDO and dust storm frequency, with a negative correlation coefficient of −0.73 in the HL dust region and −0.63 in the LL dust region, both of which are statistically significant at the 1% confidence level. The teleconnection between SST anomalies and dust trend is likely to be realized through a similar mechanism to that for droughts and increased wildfires in the Southwest [Crimmins, 2010; Williams et al., 2014]. During the cold phase of PDO, the sea surface pressure gradient between the North Pacific high and North America low intensifies, driving northerly winds down toward the North American coast. This divergence suppresses atmospheric moisture across large spatial scales (Figure 2a), exposing the dust‐prone region to anomalously dry and high‐momentum air from the north and from above through subsidence. This reinforces the configuration backed by the decadal SST differences as seen in Figure 2b and is conducive to droughts and dust storms in the southwestern United States [Williams et al., 2014].
Table 1.
Correlation Between the Climate Indices (ENSO, PDO, NAO, PNA, and AO) and Dust Storm Frequency in the Low‐Latitude (LL) and High‐Latitude (HL) Dust Regions in the Western United States Over All Months From 1988 to 2011a
| ENSO | PDO | NAO | PNA | AO | |
|---|---|---|---|---|---|
| LL dust | −0.44 | −0.62 | −0.41 | −0.33 | 0.38 |
| HL dust | −0.32 | −0.73 | −0.40 | −0.56 | 0.33 |
Sources of the data used here are provided in Table S3 in the supporting information.
4. Dust Storms and Valley Fever
Exposure to dust particles has been associated with various detrimental effects on human health [e.g., Chen et al., 2004; Perez et al., 2008; Grineski et al., 2011; Rodopoulou et al., 2014]. The U.S. Centers for Disease Control and Prevention (CDC) [2013] reports a sharp increase of coccidioidomycosis incidences from 1998 to 2011 in the same regions where dust storms have increased. Coccidioidomycosis, commonly known as Valley fever, is an infectious disease caused by inhaling the spores of soil‐dwelling fungus such as Coccidioides immitis and C. posadasii. The incidence of Valley fever has increased eightfold from 1998 to 2011 in the endemic areas (Arizona, California, Nevada, New Mexico, and Utah) [CDC, 2013]. Although little is known of the underlying forces, previous studies have concluded that the overall increasing trend in Valley fever incidence is not explainable through changes in medical practice, disease surveillance, land use, climate, or weather variability alone [Zender and Talamantes, 2006; Comrie, 2005; Park et al., 2005; Sprigg et al., 2014].
Is the increasing infection rate of Valley fever related to the dust trend? We compare the spatial distribution of dust storms and reported Valley fever cases (Figure S2) in Arizona. State‐level incidence data were obtained from CDC [2013] and county‐level data from Arizona Department of Health Service (ADHS) [Sunenshine et al., 2007] (see section S4 for details). The majority of infections were reported in the areas where increased dust activity was detected. The similarity in the spatial distribution of dust storms and Valley fever incidences points to a potential connection between the two. Among the endemic states, Arizona is associated with by far the highest incidence rate, frequently tenfold higher than in California, which ranks the second in the United States [CDC, 2013]. Indeed, half to two thirds of Valley fever cases in the United States are reported from Arizona [Sunenshine et al., 2007]. Therefore, subsequent analysis of the relationship between dust and Valley fever focuses on the data in Arizona between 2000 and 2011. This time period is selected for two reasons. First, a large number of the IMPROVE sites were set up in Arizona after 2000, providing more monitoring locations for the analysis of dust data. Second, the mandatory laboratory reporting of coccidioidomycosis in Arizona has been established since 1997. The data before and immediately after 1997 are excluded from this study to minimize the effect of procedure changes in case reporting. An earlier analysis conducted by Arizona Department of Health Services (ADHS) argues that these changes are unlikely to explain the increases after 1999. The rules for laboratory reporting have not changed since 1997, and there is no evidence suggesting drastic improvement in physician reporting after 1999 that could contribute to the large increase [Sunenshine et al., 2007].
Figure S3 shows the correlation between state‐level Valley fever incidence rate and dust frequency at each site in Arizona from 2000 to 2011. A typical dust plume in the southwestern United States extends from a few to more than hundreds of kilometers. We first test the hypothesis if dust storms from all IMPROVE dust sites (red circles in Figure S3) affect the population across the state. The results show that at the sites far away from population centers, there is a very weak or no correlation (−0.2 < r < 0.2) between dust frequency and Valley fever incidence. In Arizona, the majority of reported Valley fever cases occur in the two most densely populated urban counties, Maricopa and Pima. Interestingly, the correlation becomes stronger at sites closer to population centers. The strongest correlation is found between dust and incidence rate at the two sites in Maricopa County, which contains Arizona's largest city, Phoenix. This spatial pattern suggests that only the dust storms that originate near or can reach population centers are relevant to the widespread infection in Arizona. This is due likely to either the fungus abundance in the dust source areas, or the large size of Coccidioide spores, which are often bound to soil particles that fall out before reaching a population center if emitted at a distance away. Another hypothesis is that Coccidioide spores will be killed when exposed to solar ultraviolet radiation during long‐range transport (W. Sprigg, personal communication, 2017).
Recognizing the localized effect of dust storms, we further examine the relationship between Valley fever and other factors frequently used in statistical models to predict the disease in the Maricopa and Pima counties in Arizona. Both counties have reported the largest numbers of cases during the study period. Valley fever has been found to be associated with several controlling factors, including precipitation, temperature, and dust [Zender and Talamantes, 2006; Comrie, 2005; Park et al., 2005]. In Arizona, precipitation and dust are found to be the most useful predicting factors to Valley fever incidences [Comrie, 2005; Park et al., 2005; Tamerius and Comrie, 2011]. Table 2 shows the correlations between Valley fever incidence rate and five potential factors (precipitation, PM2.5, PM10, and dust number and frequency) in Maricopa and Pima counties from 2001 to 2011. The PM2.5, PM10, and dust data are taken from IMPROVE and the precipitation data from NASA Phase 2 of the North American Land Data Assimilation System (NLDAS‐2) [Xia et al., 2012]. Precipitation anomaly is calculated using the mean between 1990 and 2010 for each county. In both counties, PM10 concentration is negatively correlated with Valley fever incidence rate, with a stronger coefficient in Pima than in Maricopa. PM10 concentration has been previously introduced to serve as a direct measure of airborne dust, assuming that its concentration is proportionally related to hypothesized airborne Coccidioide spore concentration [Comrie, 2005]. The negative correlation suggests that PM10 concentration is not always related to airborne dust or spores, especially in urban areas. In fact, an even stronger correlation is found between the incidences of Valley fever and the concentration of PM2.5, which is mostly controlled by transported dust or nondust sources (anthropogenic emissions). In contrast, a positive correlation is found between Valley fever incidence rate and dust number or frequency. Both dust number and frequency are positively related to the Valley fever incidence rate, with a coefficient of 0.51 in Maricopa and 0.36 to 0.41 in Pima, respectively. The incidence rate is negatively related to precipitation anomaly and the correlation is weaker than that with PM10 or dust. Clearly, the number and frequency of dust storms can serve as a more relevant factor than PM10 concentration in Coccidioidomycosis‐Climate models used to predict Valley fever incidence.
Table 2.
Correlations Between Coccidioidomycosis Incidence Rate and Controlling Factors in Two Endemic Counties in Arizona From 2001 to 2011a
| Factors | Correlation (r) With Cocci. Incidence Rate | |
|---|---|---|
| Maricopa | Pima | |
| PM10 (μg/m3) | −0.39 | −0.53 |
| PM2.5 (μg/m3) | −0.35 | −0.60 |
| Dust number | 0.51 | 0.36 |
| Dust frequency | 0.51 | 0.41 |
| Precipitation anomaly (mm/mon) | ||
| Annual | −0.25 | −0.18 |
| Spring (MAM) | −0.28 | −0.45 |
| Early spring (JF) | −0.12 | −0.12 |
| Prior winter (NDJ) | −0.10 | −0.19 |
MAM: March–May, JF: January to February, and NDJ: November–January.
5. Discussion and Conclusion
While there is widespread perception and modeling evidence that southwestern North America is becoming drier, our results provide direct evidence that this region has become dustier in recent decades. This finding confirms earlier observations of the dust trends using rainfall and snow deposition, surface fine soil, and aerosol optical depth data [Brahney et al., 2013; Clow et al., 2016; Sorooshian et al., 2011; Hand et al., 2016]. The climate analysis further links the dust trend with large‐scale climate variations, particularly the SST oscillation in the Northern Pacific, as described by PDO variability. Therefore, it is expected that the projected global warming, rendering a drier subtropic, can trigger stronger dust activity in the coming decades. Our results suggest that infectious diseases, such as Valley fever and other dust related infectious diseases (e.g., meningitis [Martiny and Chiapello, 2013] and Kawasaki disease [Rodó et al., 2011]), may be another layer of response that can magnify the effect of climate change through dust storms. This dust frequency is more strongly correlated with Valley fever incidence in Arizona than other known factors. While this study is limited by time and location, it is evident that dust frequency alone is insufficient to fully explain the variability of Valley fever infection in the area where the disease is most prevalent. Contracting Valley fever is a complicated process, controlled by a variety of environmental factors to which dust cannot be a sole indicator [Sprigg et al., 2014]. Hence, further studies are warranted to confirm that there is more than a casual relationship between dust storms and Valley fever.
Beyond increases in airborne particulate matter concentrations but short of the extreme of another Dust Bowl [Lee and Gill, 2015; Sterk et al., 2016], dust storms in the Southwest are known to be linked with numerous environmental impacts, including other respiratory diseases such as asthma and bronchitis [Grineski et al., 2011; Rodopoulou et al., 2014], highway safety [Hyers and Marcus, 1981], loss of efficiency of solar energy generation systems [Sinha et al., 2014], increased mountain snowmelt [Skiles et al., 2015; Clow et al., 2016], changes to alpine ecosystems [Steltzer et al., 2009], loss of soil fertility/nutrients/carbon [Alvarez et al., 2012], and breakdown of soil structure [Belnap and Gillette, 1998]. Thus, signs of an increase in dust storm activity also serve as warnings that numerous other environmental hazards will surely increase and act as a call for careful management and attention to these hazards. Considering the large stakes associated with these hazards, it is therefore important to establish and maintain long‐term dust climatology to monitor the trend from both ground and space.
Supporting information
Supporting Information S1
Acknowledgments
We thank the IMPROVE program for the ground aerosol data, the CDC, Arizona Department of Health Service (ADHS), Rebecca Sunenshine of Maricopa County Department of Public Health for the Valley fever data, and NASA GES DISC for satellite and reanalysis data. IMPROVE is a collaborative association of state, tribal, and federal agencies, and international partners (http://views.cira.colostate.edu/fed/DataWizard/Default.aspx). U.S. Environmental Protection Agency is the primary funding source, with contracting and research support from the National Park Service. The Air Quality Group at the University of California, Davis, is the central analytical laboratory, with ion analysis provided by Research Triangle Institute, and carbon analysis provided by Desert Research Institute. Climate data are provided by NOAA (http://www.cpc.ncep.noaa.gov/products/), University of Washington at Seattle (http://research.jisao.washington.edu/pdo/), and University of Nebraska‐Lincoln (http://droughtmonitor.unl.edu). We thank William Sprigg, Russell Dickerson, and four anonymous reviewers for their constructive comments. This work was supported by NASA (grants NNX13AO45G and NNX16AQ19G) and NOAA (NOAA‐NFA‐NFAPO‐2012‐2003133, NA16OAR4590120, and cooperative agreement NA17AE1625). The authors declare no competing financial interests.
Tong, D. Q. , Wang J. X. L., Gill T. E., Lei H., and Wang B. (2017), Intensified dust storm activity and Valley fever infection in the southwestern United States, Geophys. Res. Lett., 44, 4304–4312, doi: 10.1002/2017GL073524.
The copyright line for this article was changed on 1 AUG 2018 after original online publication.
References
- Alvarez, L. J. , Epstein H. E., Li J., and Okin G. S. (2012), Aeolian process effects on vegetation communities in an arid grassland ecosystem, Ecol. Evol., 2, 809–821. [DOI] [PMC free article] [PubMed] [Google Scholar]
- Belnap, J. , and Gillette D. A. (1998), Vulnerability of desert biological soil crusts to wind erosion: The influences of crust development, soil texture, and disturbance, J. Arid Environ., 39, 133–142. [Google Scholar]
- Brazel, A. J. , and Nickling W. G. (1986), The relationship of weather types to dust storm generation in Arizona, J. Climatol., 6, 255–275. [Google Scholar]
- Brahney, J. , Ballantyne A. P., Sievers S., and Neff J. C. (2013), Increasing Ca2+ deposition in the western US: The role of mineral aerosols, Aeolian Res., 10, 77–87. [Google Scholar]
- Centers for Disease Control and Prevention (CDC) (2013), Increase in reported coccidioidomycosis—United States, 1998–2011, MMWR (Morbidity and mortality weekly report), 62(12), 217. [PMC free article] [PubMed]
- Chen, Y.‐S. , Sheen P.‐C., Chen E.‐R., Liu Y.‐K., Wu T.‐N., and Yang C.‐Y. (2004), Effects of Asian dust storm events on daily mortality in Taipei, Taiwan, Environ. Res., 95(2), 151–155. [DOI] [PubMed] [Google Scholar]
- Chin, M. , Ginoux P., Kinne S., Holben B. N., Duncan B. N., Martin R. V., Logan J. A., Higurashi A., and Nakajima T. (2002), Tropospheric aerosol optical thickness from the GOCART model and comparisons with satellite and sunphotometer measurements, J. Atmos. Sci., 59, 461–483. [Google Scholar]
- Clow, D. W. , Williams M. W., and Schuster P. F. (2016), Increasing aeolian dust deposition to snowpacks in the Rocky Mountains inferred from snowpack, wet deposition, and aerosol chemistry, Atmos. Environ., 146, 183–194. [Google Scholar]
- Comrie, A. C. (2005), Climate factors influencing coccidioidomycosis seasonality and outbreaks, Environ. Health Perspect., 113, 688–692. [DOI] [PMC free article] [PubMed] [Google Scholar]
- Cook, B. I. , Ault T. R., and Smerdon J. E. (2015), Unprecedented 21st century drought risk in the American Southwest and Central Plains, Sci. Adv. 1(1), e1400082. [DOI] [PMC free article] [PubMed] [Google Scholar]
- Cook, E. R. , Seager R., Heim R. R. Jr., Vose R. S., Herweijer C., and Woodhouse C. (2010), Megadroughts in North America: Placing IPCC projections of hydroclimatic change in a long‐term palaeoclimate context, J. Quat. Sci., 25(1), 48–61. [Google Scholar]
- Crimmins, M. A. (2010), Interannual to decadal changes in extreme fire weather event frequencies across the southwestern United States, Int. J. Climatol., 31, 1573–1583. [Google Scholar]
- Dai, A. (2013), Increasing drought under global warming in observations and models, Nat. Clim. Chang., 3(1), 52–58. [Google Scholar]
- DeMott, P. J. , Sassen K., Poellot M. R., Baumgardner D., Rogers D. C., Brooks S. D., Prenni A. J., and Kreidenweis S. M. (2003), African dust aerosols as atmospheric ice nuclei, Geophys. Res. Lett., 30(14), 1732, doi: 10.1029/2003GL017410. [DOI] [Google Scholar]
- Evan, A. T. , Dunion J., Foley J. A., Heidinger A. K., and Velden C. S. (2006), New evidence for a relationship between Atlantic tropical cyclone activity and African dust outbreaks, Geophys. Res. Lett., 33, L19813, doi: 10.1029/2006GL026408. [DOI] [Google Scholar]
- Foltz, G. R. , and McPhaden M. J. (2008), Trends in Saharan dust and tropical Atlantic climate during 1980–2006, Geophys. Res. Lett., 35, L20706, doi: 10.1029/2008GL035042. [DOI] [Google Scholar]
- Gao, Y. , Leung L. R., Lu J., Liu Y., Huang M., and Qian Y. (2014), Robust spring drying in the southwestern US and seasonal migration of wet/dry patterns in a warmer climate, Geophys. Res. Lett., 41, 1745–1751, doi: 10.1002/2014GL059562. [DOI] [Google Scholar]
- Grineski, S. E. , Staniswalis J. G., Bulathsinhala P., Peng Y., and Gill T. E. (2011), Hospital admissions for asthma and acute bronchitis in El Paso, Texas: Do age, sex, and insurance status modify the effects of dust and low wind events?, Environ. Res., 111(8), 1148–1155. [DOI] [PMC free article] [PubMed] [Google Scholar]
- Ginoux, P. , Prospero J. M., Gill T. E., Hsu N. C., and Zhao M. (2012), Global‐scale attribution of anthropogenic and natural dust sources and their emission rates based on MODIS Deep Blue aerosol products, Rev. Geophys., 50, RG3005, doi: 10.1029/2012RG000388. [DOI] [Google Scholar]
- Guan, Q. , Yang J., Zhao S., Pan B., Liu C., Zhang D., and Wu T. (2015), Climatological analysis of dust storms in the area surrounding the Tengger Desert during 1960–2007, Clim. Dyn., 45(3–4), 903–913. [Google Scholar]
- Hahnenberger, M. , and Nicoll K. (2012), Meteorological characteristics of dust storm events in the eastern Great Basin of Utah, USA, Atmos. Environ., 60, 601–612. [Google Scholar]
- Hand, J. L. , White W. H., Gebhart K. A., Hyslop N. P., Gill T. E., and Schichtel B. A. (2016), Earlier onset of the spring fine dust season in the southwestern United States, Geophys. Res. Lett., 43, 4001–4009, doi: 10.1002/2016GL068519. [DOI] [Google Scholar]
- Hedin, L. O. , Lennart G., Likens G. E., Adri Buishand T., Galloway J. N., Butler T. J., and Rodhe H. (1994), Steep declines in atmospheric base cations in regions of Europe and North America, Nature, 367, 351–354. [Google Scholar]
- Hoerling, M. , and Kumar A. (2003), The perfect ocean for drought, Science, 299(5607), 691–694. [DOI] [PubMed] [Google Scholar]
- Hyers, A. D. , and Marcus M. (1981), Land use and desert dust hazards in central Arizona, Geol. Soc. Am. Spec. Pap., 186, 267–280. [Google Scholar]
- Hyslop, N. P. , Trzepla K., and White W. H. (2015), Assessing the suitability of historical PM2.5 element measurements for trend analysis, Environ. Sci. Technol., 49, 9247–9255, doi: 10.1021/acs.est.5b01572. [DOI] [PubMed] [Google Scholar]
- Lawrence, C. R. , Neff J. C., Painter T. H., and Landry C. C. (2010), Contemporary geochemical composition and flux of aeolian dust to the San Juan Mountains, Colorado, United States, J. Geophys. Res., 115, G03007, doi: 10.1029/2009JG001077. [DOI] [Google Scholar]
- Lee, J. A. , and Gill T. E. (2015), Multiple causes of wind erosion in the Dust Bowl, Aeolian Res., 19, 15–36. [Google Scholar]
- Lei, H. , Wang J. X., Tong D. Q., and Lee P. (2016), Merged dust climatology in Phoenix, Arizona based on satellite and station data, Clim. Dyn., 47(9–10), 2785–2799. [Google Scholar]
- Mahowald, N. M. , Ballantine J. A., Feddema J., and Ramankutty N. (2007), Global trends in visibility: Implications for dust sources, Atmos. Chem. Phys., 7, 3309–3339, doi: 10.5194/acp-7-3309-2007. [DOI] [Google Scholar]
- Malm, W. C. , Sisler J. F., Huffman D., Eldred R. A., and Cahill T. A. (1994), Spatial and seasonal trends in particle concentration and optical extinction in the United States, J. Geophys. Res., 99, 1347–1347, doi: 10.1029/93JD02916. [DOI] [Google Scholar]
- Martiny, N. , and Chiapello I. (2013), Assessments for the impact of mineral dust on the meningitis incidence in West Africa, Atmos. Environ., 70, 245–253. [Google Scholar]
- Notaro, M. , Yu Y., and Kalashnivkova O. V. (2015), Regime shift in Arabian dust activity, triggered by persistent Fertile Crescent drought, J. Geophys. Res. Atmos., 120, 10,229–10,249, doi: 10.1002/2015JD023855. [DOI] [Google Scholar]
- Park, B. J. , et al. (2005), An epidemic of coccidioidomycosis in Arizona associated with climatic changes, 1998–2001, J. Infect. Dis., 191(11), 1981–1987. [DOI] [PubMed] [Google Scholar]
- Perez, L. , Tobias A., Querol X., Künzli N., Pey J., Alastuey A., Viana M., Valero N., González‐Cabré M., and Sunyer J. (2008), Coarse particles from Saharan dust and daily mortality, Epidemiology, 19(6), 800–807. [DOI] [PubMed] [Google Scholar]
- Prein, A. F. , Holland G. J., Rasmussen R. M., Clark M. P., and Tye M. R. (2016), Running dry: The U.S. Southwest's drift into a drier climate state, Geophys. Res. Lett., 43, 1272–1279, doi: 10.1002/2015GL066727. [DOI] [Google Scholar]
- Prospero, J. M. , and Lamb P. J. (2003), African droughts and dust transport to the Caribbean: Climate change implications, Science, 302(5647), 1024–1027. [DOI] [PubMed] [Google Scholar]
- Pu, B. , and Ginoux P. (2016), The impact of the Pacific Decadal Oscillation on springtime dust activity in Syria, Atmos. Chem. Phys., 16, 13,431–13,448. [Google Scholar]
- Ravi, S. , Breshears D. D., Huxman T. E., and D'Odorico P. (2010), Land degradation in drylands: Interactions among hydrologic–aeolian erosion and vegetation dynamics, Geomorphology, 116, 236–245. [Google Scholar]
- Rodó, X. , Ballester J., Cayan D., Melish M. E., Nakamura Y., Uehara R., and Burns J. C. (2011), Association of Kawasaki disease with tropospheric wind patterns, Sci. Rep., 1, 152, doi: 10.1038/srep00152. [DOI] [PMC free article] [PubMed] [Google Scholar]
- Rodopoulou, S. , Chalbot M. C., Samoli E., DuBois D. W., San Filippo B. D., and Kavouras I. G. (2014), Air pollution and hospital emergency room and admissions for cardiovascular and respiratory diseases in Doña Ana County, New Mexico, Environ. Res., 129, 39–46. [DOI] [PubMed] [Google Scholar]
- Romm, J. (2011), The next dust bowl, Nature, 478, 450–451. [DOI] [PubMed] [Google Scholar]
- Sarafoglou, N. , Kafatos M., and Sprigg W. A. (2016), Migration, environment and public health: Theory and interdisciplinary research from a regional science perspective, Int. J. Soc. Sci. Studies, 4(4), ISSN 2324‐8033 E‐ISSN 2324‐8041. [Google Scholar]
- Schubert, S. D. , Suarez M. J., Pegion P. J., Koster R. D., and Backmeister J. T. (2004), On the cause of the 1930s Dust Bowl, Science, 303, 1855–1859. [DOI] [PubMed] [Google Scholar]
- Seager, R. , et al. (2007), Model projections of an imminent transition to a more arid climate in southwestern North America, Science, 316(5828), 1181–1184. [DOI] [PubMed] [Google Scholar]
- Shao, Y. , Klose M., and Wyrwoll K. H. (2013), Recent global dust trend and connections to climate forcing, J. Geophys. Res. Atmos., 118, 11,107–11,118, doi: 10.1002/jgrd.50836. [DOI] [Google Scholar]
- Shepherd, G. , et al. (2016), Global assessment of sand and dust storms, UNEP, WMO, UNCCD; United Nations Environment Programme, 123 pp. [Available at http://apps.unep.org/publications/pmtdocuments/Global_assessment_of_sand_and_dust_storms-2016.pdf.]
- Sinha, P. , Hayes W., and Ngan L. (2014), Regional atmosphere‐solar PV interactions, Proc. of the IEEE 40th Photovoltaic Specialist Conf. (PVSC), pp. 1486–1491.
- Skiles, S. M. , Painter T. H., Belnap J., Holland L., Reynolds R. L., Goldstein H. L., and Lin J. (2015), Regional variability in dust‐on‐snow processes and impacts in the Upper Colorado River Basin, Hydrol. Process., 29(26), 5397–5413. [Google Scholar]
- Sokolik, I. N. , and Toon O. B. (1996), Direct radiative forcing by anthropogenic airborne mineral aerosols, Nature, 381, 681–683. [Google Scholar]
- Sorooshian, A. , Wonaschütz A., Jarjour E. G., Hashimoto B. I., Schichtel B. A., and Betterton E. A. (2011), An aerosol climatology for a rapidly growing arid region (southern Arizona): Major aerosol species and remotely sensed aerosol properties, J. Geophys. Res., 116, D19205, doi: 10.1029/2011JD016197. [DOI] [PMC free article] [PubMed] [Google Scholar]
- Sprigg W., Nickovic A. S., Galgiani J. N., Pejanovic G., Petkovic S., Vujadinovic M., Vukovic A., Dacic M., DiBiase S., Prasad A. K. and El‐Askary H. M. (2014), Regional dust storm modeling for health services: The case of Valley fever, Aeolian Res. 14, 53–73, doi: 10.1016/j.aeolia.2014.03.001. [DOI] [Google Scholar]
- Steenburgh, W. J. , Massey J. D., and Painter T. H. (2012), Episodic dust events of Utah's Wasatch front and adjoining region, J. Appl. Meteorol. Climatol., 51, 1654–1669. [Google Scholar]
- Steltzer, H. , Landry C., Painter T. H., Anderson J., and Ayres E. (2009), Biological consequences of earlier snowmelt from desert dust deposition in alpine landscapes, Proc. Natl. Acad. Sci. U.S.A., 106, 11,629–11,634. [DOI] [PMC free article] [PubMed] [Google Scholar]
- Sterk, G. , Boardman J., and Verdoot A. (2016), Desertification: History, causes and options for its control, Land Degrad. Dev., 27(8), 1783–1787. [Google Scholar]
- Sunenshine, R. H. , Anderson S., Erhart L., Vossbrink A., Kelly P. C., Engelthaler D., and Komatsu K. (2007), Public health surveillance for coccidioidomycosis in Arizona, Ann. N. Y. Acad. Sci., 1111(1), 96–102. [DOI] [PubMed] [Google Scholar]
- Tamerius, J. D. , and Comrie A. C. (2011), Coccidioidomycosis incidence in Arizona predicted by seasonal precipitation, PLoS One 6(6), e21009, doi: 10.1371/journal.pone.0021009. [DOI] [PMC free article] [PubMed] [Google Scholar]
- Tegen, I. , and Lacis A. (1996), Modeling of particle size distribution and its influence on the radiative properties of mineral dust aerosol, J. Geophys. Res., 101, 19,237–19,244, doi: 10.1029/95JD03610. [DOI] [Google Scholar]
- Tong, D. Q. , Dan M., Wang T., and Lee P. (2012), Long‐term dust climatology in the western United States reconstructed from routine aerosol ground monitoring, Atmos. Chem. Phys., 12(11), 5189–5205. [Google Scholar]
- United States Environmental Protection Agency (U.S. EPA) (2016), National emission inventories air pollutant emissions trends data. [Available at (http://www3.epa.gov/ttnchie1/trends/) on September 1, 2016.]
- Westerling, A. L. , Hidalgo H. G., Cayan D. R., and Swetnam T. W. (2006), Warming and earlier spring increase western US forest wildfire activity, Science, 313(5789), 940–943. [DOI] [PubMed] [Google Scholar]
- Williams, A. P. , et al. (2014), Causes and implications of extreme atmospheric moisture demand during the record‐breaking 2011 wildfire season in the southwestern United States, J. Appl. Meteorol. Climatol., 53(12), 2671–2684. [Google Scholar]
- Worster, D. (1979), Dust Bowl. The Southern Great Plains in the 1930s, pp. 1–11, Oxford Univ. Press, New York. [Google Scholar]
- Xia, Y. , et al. (2012), Continental‐scale water and energy flux analysis and validation for the North American Land Data Assimilation System project phase 2 (NLDAS‐2): 1. Intercomparison and application of model products, J. Geophys. Res., 117, D03109, doi: 10.1029/2011JD016048. [DOI] [Google Scholar]
- Zender, C. S. , and Talamantes J. (2006), Climate controls on Valley fever incidence in Kern County, California, Int. J. Biometeorol., 50(3), 174–182. [DOI] [PubMed] [Google Scholar]
- Zhu, C. , Wang B., and Qian W. (2008), Why do dust storms decrease in northern China concurrently with the recent global warming?, Geophys. Res. Lett., 35, L18702, doi: 10.1029/2008GL034886. [DOI] [Google Scholar]
- Zhuang, G. S. , Yi Z., Duce R. A., and Brown P. R. (1992), Link between iron and sulfur suggested by the detection of Fe(II) in remote marine aerosols, Nature, 355, 537–539. [Google Scholar]
Associated Data
This section collects any data citations, data availability statements, or supplementary materials included in this article.
Supplementary Materials
Supporting Information S1