

SUMMARY
Ki67 staining is widely used as a proliferation indicator in the clinic, despite poor understanding of this protein’s function or dynamics. Here, we track Ki67 levels under endogenous control in single cells over time and find that Ki67 accumulation occurs only during S, G2, and M phases. Ki67 is degraded continuously in G1 and G0 phases, regardless of the cause of entry into G0/quiescence. Consequently, the level of Ki67 during G0 and G1 in individual cells is highly heterogeneous and depends on how long an individual cell has spent in G0. Thus, Ki67 is a graded rather than a binary marker both for cell-cycle progression and time since entry into quiescence.
In Brief
Ki67 is one of the most widely used markers of proliferation in oncology. Contrary to its canonical use as a binary marker of proliferation versus quiescence, Miller et al. find that Ki67 levels decay steadily in quiescent cells, which may enable more advanced clinical applications.
Graphical Abstract
INTRODUCTION
Ki67 staining is frequently used in oncology to estimate a tumor’s proliferation index. Using immunohistochemistry of a biopsy, cells are scored as Ki67 positive or negative, and the biopsy is assigned a percent Ki67-positive value. Ki67 scores are used prognostically and also have predictive value for potential benefits from chemotherapy in breast cancer (Dowsett and Dunbier, 2008). However, little is known about Ki67 protein function or expression dynamics during proliferation versus quiescence.
Initial studies on Ki67 indicated that the protein is present during every phase of the cell cycle in asynchronously cycling cells and absent in non-dividing cells (Gerdes et al., 1984). More recent studies on Ki67 have indicated that it undergoes proteasome-mediated degradation during G1 phase and upon cell-cycle exit and that depletion of Cdh1, an activator of the Anaphase Promoting Complex (APC/C), stabilizes Ki67 (Sobecki et al., 2016, 2017). Similar tomany cell-cycle genes, Ki67 transcription isdownstream of E2F activation (Ishida et al., 2001), which depends on the inactivation of Rb by CDK4/6 (Sobecki et al., 2017). Ki67 has also been shown to participate in ribosomal biogenesis, heterochromatin organization, and mitotic chromosome separation (Cuylen et al., 2016; Rahmanzadeh et al., 2007; Sobecki et al., 2016).
Although widely used as a proliferation marker, the impact of Ki67 on cell proliferation varies from cell type to cell type. Ki67 depletion results in reduced proliferation in hTERT-RPE1, hTERT-BJ, Swiss-3T3, WI-38, IMR90, MCF7, IM-9, RT-4, and 786–0 cells, but not in others such as MCF10A, DLD-1, HeLa, U2OS, and 293T cells (Cidado et al., 2016; Schlüter et al., 1993; Sobecki et al., 2016; Starborg et al., 1996; Sun et al., 2017; Zheng et al., 2006). Additionally, Ki67 knockout mice develop normally and are fertile (Sobecki et al., 2016). Thus, low Ki67 levels can have cell-type-specific effects on cell-cycle progression.
These prior studies have raised the possibility that more information about cellular proliferation could be obtained from the distribution of Ki67 intensity in immunohistochemistry stains (van Dierendonck et al., 1989; Sobecki et al., 2017). However, current clinical immunohistochemistry staining techniques on Ki67 still operate as if Ki67 protein levels were a simple on-and-off switch: on during cellular proliferation and off during quiescence and senescence.
In this study, we confirm and elaborate on the subtle Ki67 cellcycle dynamics in MCF10A mammary epithelial cells, MCF7 breast cancer cells, OVCAR3 ovarian cancer cells, and A375 melanoma cells using single-cell time-lapse microscopy and show how a snapshot immunostain of Ki67 can be used to estimate cells’ proliferation histories. Our results improve our ability to interpret this traditional biomarker and allow for more advanced clinical applications.
RESULTS
We first examined Ki67 levels by immunofluorescence (IF) in cycling cells. We compared G1 cells with a sub-population that spontaneously enters a state of low CDK2 activity (‘‘CDK2low cells,’’ also termed spontaneous G0 or spontaneous quiescent cells) (Spencer et al., 2013) and found lower levels of Ki67 in spontaneous G0 compared with G1 cells, but with significant overlap in Ki67 expression (Figures S1A and S1B). That is, spontaneous G0 cells did not have distinctively low levels of Ki67, as would be expected if Ki67 was ‘‘off’’ in quiescence. We then examined cells forced into quiescence by mitogen-activated protein kinase (MAPK) pathway inhibition and found that the distribution of Ki67 levels shifted downward in a unimodal fashion with increasing duration of MAPK pathway inhibition. In contrast, phosphorylation of Rb at serine 807/811 showed a bimodal distribution, with an increasing fraction of cells entering a state of low phospho-Rb the longer the MAPK pathway was inhibited (Figure 1A). Thus, while Rb phosphorylation is an on-off switch, Ki67 levels do not appear to be switch-like.
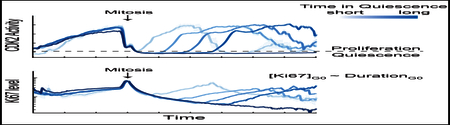
Figure 1. ΚI67 Is a Graded Rather than a Binary Marker of Proliferation.

(A) Probability density of Ki67 and phospho-Rb S807/811 intensity in MCF10A (left) and A375 cells (right) treated with 100 nM MEK inhibitor or 1 μΜ dabrafenib, respectively, for 0, 24, 48, or 72 hr. x-axis units are arbitrary fluorescence units in natural log. n > 1,000 for each condition.
(B) Time-lapse imaging and single-cell tracking of CDK2 activity followed by immunofluorescence for Ki67 in MCF10A, OVCAR3, A375, and MCF7 cells. Top: representative traces were computationally aligned to time of anaphase and classified as CDK2lnc (blue), CDk2emerge (green), and CDK2low (red) (Table S1). Middle: α-Ki67 signal was reconstructed as a function of time since anaphase for CDK2inc and CDK2low cells. n = 200–1000. Bottom: CDk2emergecell traces were aligned to the time of CDK2 activity rise, and α-Ki67 signal was reconstructed as a function of time since CDK2 activity rise as in Gookin et al. (2017). n = 70–200. See also Table S1.
To further investigate the dynamics of Ki67 throughout the cell cycle, we used time-lapse microscopy and single-cell tracking of four cell lines (MCF10A, A375, OVCAR3, and MCF7) stably expressing a fluorescent protein-tagged histone 2B and a CDK2 activity sensor over a 24-hr time interval. As cells complete mitosis, they either immediately re-enter the cell cycle by increasing CDK2 activity (“CDK2inc cells”; blue in Figure 1B, top) or spontaneously turn off CDK2 activity and enter a temporary quiescence (CDK2low/spontaneous G0 cells; red in Figure 1B, top) (Spencer et al., 2013). Cells may emerge from the quiescent CDK2low state and re-enter the cell cycle by increasing their CDK2 activity (“CDK2emerge cells”; green in Figure 1B, top). After 24 hr of imaging, we fixed the cells, performed immunofluorescence for Ki67, and computationally matched each cell’s Ki67 signal to its cell-cycle history using previously reported techniques (Gookin et al., 2017; Spencer et al., 2013). In all four cell lines, aligning each cell’s Ki67 signal as a function of time since anaphase revealed two trajectories of Ki67 levels after mitosis that correlated with the bifurcation in CDK2 activity: cells in the CDK2low state showed continuous decay of Ki67, while cells in the CDK2inc state showed accumulation of Ki67 (Figure 1B, middle). CDK2emerge cells began accumulating Ki67 following cell-cycle re-entry (Figure 1B, bottom).
The subtle Ki67 dynamics throughout the cell cycle, however, remained partially obscured by Ki67 heterogeneity within the population. Therefore, we used CRISPR-based genome editing to tag Ki67 at its endogenous locus with the mCitrine fluorescent protein in MCF10A cells (Figure S2A).Using PCR gene amplification of the MKI67 gene, we confirmed that mCitrine was inserted at both Ki67 alleles (Figure S2B). mCitrine-Ki67 responded to quiescence induced by MEK inhibition in the same way as wild-type Ki67 (Figure S2C), and mCitrine fluorescence in single cells linearly correlated with antibody staining against Ki67 (Figure S2D). The tagged Ki67 showed identical localization as that of the untagged wildtype protein in all cell-cycle phases (Figures S2E and S2F).
To track these cells as they asynchronously progress through the cell cycle, we co-expressed histone 2B-mTurquoise and either the mCherry-tagged CDK2 activity sensor (Spencer et al., 2013) or mCherry-Geminin FUCCI sensor that marks the start of S phase (Sakaue-Sawano et al., 2008). Cells were imaged and tracked over several days, computationally aligned to their first anaphase, and categorized into groups depending on time spent in the CDK2low state following their initial mitosis (Figures 2A–2C). We compared CDK2inc cells with CDK2emerge cells that spent approximately 6, 10, or 14 hr in the CDK2low state before re-entering the cell cycle and with cells that remained CDK2low for the rest of the imaging period. Overlaying the CDK2 activity and Ki67 intensity traces of these groups revealed that Ki67 is degraded uniformly in all cells during G0 and G1 phases (Figure 2C). Ki67 levels began to increase again several hours after CDK2 activity began to increase and concurrently with the initial rise in the Geminin FUCCI sensor (Figure 2C–2E). This result lends significantly increased precision to previous reports noting that Ki67 accumulates in S phase (Sobecki et al., 2017). Ki67 levels rose steadily thereafter, from the start of S phase until mitotic exit (Figures 2C–2E). We also examined Ki67 dynamics in MCF7 cells where Ki67 is endogenously tagged with yellow fluorescent protein (YFP) (Stewart-Ornstein and Lahav, 2016). Consistent with results in MCF10A cells, Ki67 levels in MCF7 cells continuously decreased in spontaneous CDK2low cells and increased a few hours after the rise of CDK2 activity (Figures S3A and S3B).
Figure 2. Ki67 Continuously Decreases in G0/G1 and Rises upon S Phase Entry.

(A) Single-cell traces of CDK2 activity (left) and mCitrine- Ki67 (right) for asynchronously cycling MCF10A cells. Cells were selected based on their time of anaphase and then classified as CDK2inc, CDK2emerge, or CDK2low based on CDK2 activity (STAR Methods). Black dots indicate individual mitosis events. Only CDK2emerge cells re-entering the cell cycle within 12 hr of their previous mitosis are shown here for clarity. CDK2inc, n = 40; CDK2emerge, n = 40; CDK2low, n = 4.
(B) CDK2 activity and mCitrine-Ki67 traces in MCF10A for two individual CDK2inc cells (top), CDK2emerge cells re-entering the cell cycle 14 hr after mitosis (middle), and CDK2low cells (bottom).
(C) Averaged single-cell MCF10A traces of CDK2 activity (top) or mCitrine-Ki67 (middle) computationally aligned to time of anaphase, for each group of cells indicated. Boxplot quantifies Ki67 levels at the time CDK2 activity begins to rise (bottom). CDK2inc, n = 7; CDK2emerge 6hr, n = 66; CDK2emerge 10hr, n = 69; CDK2emerge 14hr, n = 56; and CDK2low, n = 84.
(D) Single-cell traces of MCF10A mCitrine-Ki67 knock-in cells stably expressing mCherry-Geminin are plotted for one rapidly cycling cell (left) and one cell entering S phase 8 hr after anaphase (right). Geminin is rapidly degraded in anaphase. The dashed vertical lines mark the Geminin rise time and start of S phase, which occurs concurrently with the rise in Ki67.
(E) Averaged single-cell traces of Geminin and Ki67 aligned to anaphase for cells entering S phase 4 hr (left; n = 13) or 7–8 hr (right; n = 9) after anaphase. Dashed line denotes the start of S phase based on the Geminin signal.
(F) Rare mCitrine-Ki67 knockin MCF10A cells that escape from 100 nM MEK inhibitor after a long quiescence. Cells were treated with MEK inhibitor for 48 hr prior to live-cell imaging. Left: MCF10A mCitrine-Ki67 knockin cells expressing the CDK2 activity sensor; the black arrow marks the CDK2 activity rise time, and the magenta arrow marks the Ki67 rise time; n = 57. Right: mCitirine-Ki67 knockin cells expressing the Geminin FUCCI sensor; black and magenta arrows mark the Geminin rise time and the Ki67 rise time, respectively, which coincide with the start of S phase. n = 20.
(C, E, and F) Error bars represent standard error of mean (SEM).
Previous studies have reported that Ki67 is absent in G1-phase cells emerging from a long quiescence (Gerdes et al., 1984; Sobecki et al., 2017), and our results explain why: since Ki67 levels fall as a function of time since quiescence entry, quiescent cells re-entering the cell cycle will have varying levels of Ki67 depending on how long the cells have been quiescent (Figures 2B, 2C, S3A, and S3B). Consistent with this, the few cells that manage to escape the effects of MEK inhibition and re-enter the cell cycle after a long quiescence have no detectable Ki67 signal throughout G1 phase (Figure 2F).
Taking advantage of the measured single-cell dynamics of Ki67, we further asked whether we can derive kinetic laws of Ki67 decay in quiescence, and thereby predict time since mitosis of quiescent cells using a snapshot of Ki67 levels. Analysis of the spontaneous CDK2low population revealed that the Ki67 signal decay is better fit with second-order kinetics than first-order kinetics (Figures S4A and S4B). We constructed mathematical models for both first-order kinetics and second-order kinetics in spontaneous CDK2low MCF10A cells using live-cell data from Figure 2B-C. To account for cell-to-cell variability, we built a population average model as well as a Bayesian model for both first-order and second-order kinetics (see STAR Methods). We used these models, which were trained on live-cell MCF10A data, to predict time since mitosis of spontaneous CDK2low MCF10A, MCF7, OVCAR3, or A375 cells, based on their Ki67 intensity measured by an immunofluorescence snapshot (Figures S4B-S4D). We then compared the model prediction with the ground truth time since mitosis measured in Figure 1B by livecell imaging before fixation and immunofluorescence (Figures S4C-S4E). In all of these models, predicted time since mitosis correlated with actual time since mitosis. This suggests that careful quantification of Ki67 antibody staining can reveal more than simply whether a cell is in the proliferative state: it can additionally distinguish a rapidly cycling cell with a very short quiescence from a slowly cycling cell that spends long periods in quiescence prior to re-entering the cell cycle.
How closely do Ki67 levels track exit from and progression through the cell cycle? To answer this question, we acutely arrested cells at various points in the cell cycle and monitored the effect on Ki67 levels. Cells forced into quiescence by MEK inhibitor, CDK4/6 inhibitor, or the p53-stabilizing drug Nutlin degraded Ki67 at the same rate as that of spontaneous CDK2low cells (Figures 3A, 3B, and S3C; Videos S1, S2, S3, and S4). Ki67 was degraded continuously as long as cells remained quiescent, declining steadily for over 36 hr. Thus, Ki67 can serve as a marker for time since entry into quiescence, independent of the quiescence-inducing stimulus. Cells blocked in S phase by hydroxyurea showed an immediate plateauing of Ki67 levels upon entry into S phase, while cells blocked in G2 by CDK1 inhibitor showed a plateauing of Ki67 upon entry into G2, with a higher Ki67 level than that observed with the hydroxyurea block. When nocodazole was added to arrest cells at prometaphase, Ki67 levels plateaued at an even higher level than that of G2 phase-arrested cells (Figure 3C). These results indicate that Ki67 accumulation is directly tied to progression through the cell cycle. Indeed, when we accelerated cell-cycle progression by adding Wee1 inhibitor, accumulation of Ki67 was consequently accelerated relative to control cells (Figure 3D). Thus, Ki67 levels are hard-wired into cell-cycle progression and cell-cycle exit.
Figure 3. Ki67 Levels Are Hardwired into Cell-Cycle Progression and Cell-Cycle Exit.

(A, C, and D) Averaged single-cell MCF10A traces for CDK2 activity (left column) or mCitrine-Ki67 (right column) computationally aligned to time of anaphase. Gray boxes indicate windows of drug addition. Error bars represent SEM.
(A) Averaged traces of all untreated cells (Control All; n = 200); untreated spontaneous CDK2low cells (Control G0; n = 18); or cells exposed to MEK inhibitor(n = 200), CDK4/6 inhibitor (n = 200), or Nutlin (n = 88). The rise of CDK2 acitivity and Ki67 under CDK4/6i treatment results from a few cells escaping drug action.
(B) Distribution of fitted Ki67 decay parameters are similar across different quiescence-inducing conditions. Single-cell Ki67 traces were fit with first-order kinetics (left) or second-order kinetics (right) from 2 hr after mitosis until the end of the traces. PDF, probability density function.
(C) Averaged traces of untreated CDK2inc cells (Control; n = 67); untreated spontaneous CDK2low cells (G0; n = 7); or CDK2inc cells blocked by hydroxyurea in S phase (n = 7), RO3306 in G2 phase (n = 16), or nocodazole in mitosis (n = 6).
(D) CDK2inc cells treated with Wee1 inhibitor (n = 428) or left untreated (n = 25).
We next tested the molecular mechanisms that regulate Ki67 levels at each cell-cycle phase. Inhibiting protein synthesis in G0/G1 phase using cycloheximide had no immediate effect on Ki67 levels, while inhibiting protein degradation in G0/G1 phase using bortezomib resulted in a plateauing of Ki67 levels (Figure 4A). This is consistent with the idea that proteasome-mediated degradation causes the decreasing Ki67 levels in G0 and G1 (Sobecki et al., 2017). In contrast, the addition of cycloheximide to cells in S phase blocked the increase of Ki67, while the addition of bortezomib showed no immediate effect compared to control (Figure 4B), indicating that protein synthesis is responsible for the upregulation of Ki67 in S phase.
Figure 4. Cell-Cycle-Dependent Synthesis and Degradation Regulate Ki67 Dynamics.

(A and B) Averaged CDK2 (left) or mCitrine-Ki67 (right) traces of untreated cells, cells treated with cycloheximide, or cells treated with bortezomib in G0/G1 (A) (top, n = 136, 80, 27, respectively) or S phase (B) (bottom, n = 151, 142, and 28, respectively). Gray boxes indicate windows of drug addition. Error bars represent SEM.
(C-E) Dynamics of mCitrine-Ki67 after FZR1 (C), MYBL2 (D), or FOXM1 (E) knockdown: three randomly selected single cells (top), mean ± SEM of atleast 1,000 single-cell traces (middle), and immunoblots from cells transfected with the indicated siRNAs to confirm knockdown (bottom).
Additionally, we tested three proposed regulators of Ki67 degradation and transcription by single-cell time-lapse imaging. Consistent with the reported role of Cdh1 in Ki67 degradation (Sobecki et al., 2016), we found that knockdown of Cdh1 (FZR1) via small interfering RNA (siRNA) resulted in the reduced degradation of Ki67 in G1 and overall elevated Ki67 levels (Figure 4C), supporting the notion that APC/CCdh1 mediates degradation of Ki67 in G1. The Ki67 gene promoter harbors a CHR motif that binds the MMB (Myb-MuvB) complex (Sadasivam and DeCaprio, 2013), and the Ki67 promoter has been consistently pulled down in several chromatin immunoprecipitation sequencing (ChIP-seq) experiments by multiple components of the MMB complex (Fischer et al., 2016). Therefore, we knocked down two different transcription factors of the MMB complex, MYBL2 (B-Myb) and FOXM1. Knockdown of B-Myb severely impaired the rise of Ki67 in S/G2, whereas knockdown of FOXM1 had minimal effect on the dynamics of Ki67, suggesting that B-Myb, but not FOXM1, is required for Ki67 transcription.
DISCUSSION
In summary, we show that Ki67 protein levels are not binary. Instead, because Ki67 is continuously degraded during G0 and G1 and is continuously produced from the start of S phase until mitotic exit, Ki67 protein levels in a population span a large spectrum. An individual cell’s Ki67 expression level in this spectrum is a function of the current cell-cycle phase as well as its history: the longer a cell has previously spent in quiescence, the lower its Ki67 level will be upon re-entering the cell cycle. These results show that simply scoring Ki67 as positive or negative in a tumor biopsy can be an oversimplification.
Our live-cell analysis reveals that Ki67 levels are at a local minimum at the G1/S transition in actively proliferating cells and that Ki67 is undetectable at the G1/S transition in slowly cycling cells that spent a long time in quiescence before re-entering the cell cycle. Clinically, this means that additional information can be obtained from Ki67 immunohistochemistry beyond just the percentage of Ki67-positive cells in a biopsy. By quantifying Ki67 levels in a tissue biopsy in both mitotic cells (to obtain a value for the initial condition) and late G1/early S (marked, for example, by 2N DNA and high phospho-Rb or low but non-zero levels of cyclin A), one can use the formula described in this work to infer how long ago a cell last divided (see STAR Methods). Although calibration for each tissue type would be ideal, Figure S4 shows that a model trained on MCF10A data still has value for predicting time since mitosis for three other cell lines. Using a similar model, late G1/early S phase tumor cells could then be subcategorized into three groups: rapid-cycling cells with high Ki67, moderately paced cycling cells with low Ki67, and slow-cycling cells with virtually no Ki67 in late G1/early S phase (assuming that slow cycling is a result of these cells spending prolonged periods in G0/G1). At the population level, the distribution of Ki67 levels within a tumor is an indication of how fast the tumor is growing. Rapidly growing tumors would have a distribution of Ki67 levels in 2N DNA cells concentrated toward the levels found in mitotic cells. However, slow-growing tumors would have a distribution of Ki67 levels in 2N DNA cells concentrated toward background Ki67 levels found in adjacent non-cancerous tissue, with tumors growing at intermediate rates in between. With additional validation, placing tumors into these more finely divided categories could inform prognosis and the selection of patient treatments and could provide an additional readout of tumor responses to ongoing treatments.
STAR★METHODS
Detailed methods are provided in the online version of this paper and include the following:
KEY RESOURCES TABLE
CONTACT FOR REAGENT AND RESOURCE SHARING
-
EXPERIMENTAL MODELS AND SUBJECT DETAILS
-
○
Cell Lines
-
○
-
METHOD DETAILS
-
○
Immunofluorescence
-
○
siRNA
-
○
Inhibitors
-
○
Time-lapse Microscopy
-
○
Cell Trace Analysis
-
○
Retrospective Estimation of Quiescence Duration Using IF Images of Ki67
-
○
QUANTIFICATION AND STATISTICAL ANALYSIS
DATA AND SOFTWARE AVAILABILITY
STAR★METHODS
KEY RESOURCES TABLE
| REAGENT or RESOURCE | SOURCE | IDENTIFIER |
|---|---|---|
| Antibodies | ||
| Phospho-Rb (Ser807/811) | Cell Signaling Technology | Cat# 8516P, RRID:AB_11179075 |
| Phospho-Histone H3 (Ser10) | Cell Signaling Technology | Cat# 9706, RRID:AB_331748 |
| Ki67 antibody | Abcam | Cat# ab15580, RRID:AB_443209 |
| FoxM1 (D12D5) XP Rabbit mAb antibody | Cell Signaling Technology | Cat# 5436S, RRID:AB_10693287 |
| Cdh1 Antibody, clone 15A9.1 | Millipore | Cat# MABN1615 |
| B-Myb (C-20) antibody | Santa Cruz Biotechnology | Cat# sc-725, RRID:AB_631986 |
| Chemicals, Peptides, and Recombinant Proteins | ||
| Bortezomib | Cayman Chemical | Cat# 10008822 |
| Cycloheximide | Enzo Life Science | Cat# ALX-380–269-G001 |
| Hydroxyurea | Sigma-Aldrich | Cat# H8627 |
| PD-0325091 | Selleckchem | Cat# S1036 |
| Palbociclib | Selleckchem | Cat# S1116 |
| Nutlin | Cayman Chemical | Cat# 10004372 |
| Nocodazole | Sigma-Aldrich | Cat# M1404 |
| RO3306 | Santa Cruz | Cat# 10004372 |
| MK-1775 | Selleckchem | Cat# S1525 |
| Dabrafenib | Selleckchem | Cat# S2807 |
| Alt-R® S.p. Cas9 Nuclease V3 | IDT | Cat# 1081058 |
| DMEM/F12 | Thermo Fisher | Cat# 11330–032 |
| DMEM/F12 Phenol red free | Thermo Fisher | Cat# 11330–021 |
| horse serum | Thermo Fisher | Cat# 16050–122 |
| cholera toxin | Sigma | Cat# C8052–2mg |
| epidermal growth factor | Peprotech | Cat# AF-100–15 |
| Insulin | Sigma | Cat# I1882–200mg |
| Hydrocortisone | Sigma | Cat# H0888–1g |
| Critical Commercial Assays | ||
| Click-iT EdU Alexa Fluor 647 Imaging Kit | Thermo Fisher | Cat# C10340 |
| Experimental Models: Cell Lines | ||
| MCF-10A cell line | ATCC | Cat# CRL-10317, RRID:CVCL_0598 |
| MCF10A H2B-mTurquoise DHB-mVenus | Laboratory of Tobias Meyer | (Spencer et al., 2013) |
| MCF10A mCitrine-Ki67 | This study | N/A |
| MCF10A mCitrine-Ki67 H2B-mTurquoise DHB-mCherry | This study | N/A |
| MCF10A mCitrine-Ki67 H2B-mTurquoise Geminin-mCherry | This study | N/A |
| MCF7 Ki67-YFP p21-mKate | Laboratory of Galit Lahav | (Stewart-Ornstein and Lahav, 2016) |
| MCF7 Ki67-YFP p21-mKate H2B-mIFP DHB-mTurquoise2 | This study | N/A |
| OVCAR-3 cell line | ATCC | Cat# HTB-161, RRID:CVCL_0465 |
| A375 cell line | ATCC | Cat# CRL-1619, RRID:CVCL_0132 |
| Oligonucleotides | ||
| FZR1 DsiRNA | IDT | Cat# hs.Ri.FZR1.13.2 |
| MYBL2 DsiRNA | IDT | Cat# hs.Ri.MYBL2.13.2 |
| FOXM1 DsiRNA | IDT | Cat# hs.Ri.FOXM1.13.1 |
| Negative Control DsiRNA | IDT | Cat# 51–01-14–04 |
| MKI67 crRNA (AAUGUGGCCCACGAG) | IDT | N/A |
| CRISPR-Cas9 tracrRNA | IDT | Cat# 1072532 |
| REAGENT or RESOURCE | SOURCE | IDENTIFIER |
| Software and Algorithms | ||
| MATLAB | Mathworks | SCR_001622 |
| Other | ||
| 96 well plate | Greiner bio-one | Cat# 655090 |
| 96 well glass bottom plate | Cellvis | Cat# P96–1.5H-N |
CONTACT FOR REAGENT AND RESOURCE SHARING
Further information and requests for reagents may be directed to, and will be fulfilled by, corresponding author Sabrina Spencer (sabrina.spencer@colorado.edu).
EXPERIMENTAL MODELS AND SUBJECT DETAILS
Cell Lines
MCF10A human mammary epithelial cells were maintained in DMEM/F12 supplemented with 5% horse serum, 100 ng/mL cholera toxin, 20 ng/mL epidermal growth factor (EGF), 10 mg/mL insulin, 0.5 mg/mL hydrocortisone, and 1X penicillin/streptomycin. A375 cells were maintained in DMEM supplemented with 10% FBS, 1.5 g/L sodium bicarbonate and 1X penicillin/streptomycin. OVCAR3 and MCF7 cells were maintained in RPMI1640 supplemented with 10% FBS, 1X Glutamax and 1X penicillin/streptomycin. To serum-starve MCF7 cells, FBS was replaced with 0.3% BSA in the full growth medium. All cells were cultured in humidified 37°C incubator at 5% CO2.
The mCitrine-Ki67 knock-in cell line was generated as follows: CRISPR-Cas9 ribonucleoprotein (RNP) was produced using Alt-R CRISPR-Cas9 System from IDT and contained crRNA (AAUGUGGCCCACGAG) annealed to tracrRNA and Cas9 nuclease. The RNP was electroporated into MCF10A cells via the Neon system (Life Technologies) following manufacturer’s instructions, with 2 pulses, 30 ms at 1150 V. mCitrine-Ki67 knock-in single cells were selected by fluorescence-activated cell sorting (FACS), grown into clones, and verified by immunofluorescence, western blot, and PCR. The PCR product bands were excised and sequenced for verification.
MCF10A mCitrine-Ki67 cells were transduced with H2B-mTurquoise and DHB-mCherry or mCherry-Geminin lentivirus, A375 cells with H2B-mTurquoise and DHB-mCherry lentivirus, OVCAR3 cells with H2B-mTurquoise and DHB-mVenus lentivirus, MCF7 Ki67-YFP cells with H2B-miFP and DHB-mTurquoise2 lentivirus. Cells stably expressing transduced sensors were isolated by FACS and used in live-cell imaging experiments.
METHOD DETAILS
Immunofluorescence
Cells were fixed with 4% paraformaldehyde and then washed twice with PBS. Cells were then permeabilized with 0.2% Triton-X100 at 4°C for 15 minutes and subsequently blocked with 3% BSA for 60 minutes at room temperature. Primary antibody staining was performed overnight at 4°C in the presence of 3% BSA and visualized by secondary antibody conjugation to Alexa Fluor- 405, −488, −546, or −647 secondary antibodies. For the timelapse followed by IF experiment in MCF7 cells, H2B-mIFP fluorophore was inactivated using CycIF method (Lin et al., 2015) after live-cell imaging, before staining with Ki67 antibody and Alexa Fluor-647 secondary antibody. For EdU incorporation experiments, cells were treated with media containing 10 mM EdU for 15 minutes, subsequently fixed with 4% paraformaldehyde, and processed according to manufacturer’s instructions. Cells were imaged on an IXMicro microscope (Molecular Devices) or on a Nikon Inverted Microscope Eclipse Ti-E using a 10X 0.45 numerical aperture (NA) objective.
siRNA
siRNA was transfected using Neon Transfection System (Life Technologies) following the manufacturer’s instructions. Live-cell imaging was started 20 hr after transfection. Cell lysate was made 24 hr after transfection to determine knockdown efficiency.
Inhibitors
Compounds and concentrations used: 1 μM Bortezomib, 1 μg/mL Cycloheximide, 2 mM Hydroxyurea, 100 nM MEK inhibitor (PD-0325091), 1 μM Dabrafenib, 10 μM Nocodazole, 4 μM Nutlin, 1 μM CDK4/6 inhibitor (Palbociclib), 9 μM CDK1 inhibitor (RO3306), and 1 μM Wee1 inhibitor (MK-1775).
Time-lapse Microscopy
Cells were plated on a 96-well plate in phenol red-free full-growth media at least 24 hr prior to the start of imaging and at a density such that cells were sub-confluent throughout the imaging period. Cells were imaged every 12 min (for MCF10A), 15 min (OVCAR3, A375, MCF7) or 20 min (MCF7, Figure S3C) on either an ImageXpress Micro XLS wide-field microscope (Molecular Devices) with a 10X 0.45 NA objective or on a Nikon Inverted Microscope Eclipse Ti-E PFS (Nikon) with a 10X 0.45 NA objective. Cells were imaged in a humidified, 37°C chamber at 5% CO2. Total light exposure time for each time point was kept under 750 ms. For experiments involving drug treatments, cells were first imaged without drug for approximately 24 hr; the video was then paused and drugs were added by exchanging 50% of the media in each well with media containing a 2X drug concentration. Cells were then imaged for an additional 24 to 48 hr. Images were processed as described previously (Cappell et al., 2016). The tracking code is available for download here: https://github.com/scappell/Cell_tracking
Cell Trace Analysis
Asynchronously cycling cells that did not receive drug treatments during the imaging period were computationally aligned to the time of their first anaphase and then were additionally segmented into categories based on specific post-mitotic CDK2 or Geminin FUCCI sensor behavior indicating re-entry into the cell cycle. The mean of all single-cell traces in a given category was taken to create an averaged trace representative of the cell traces in the category. Asynchronously cycling cells that divided and received drug treatments during the imaging period were initially segmented into two-hour categories based on the cells’ time of mitosis relative to the time of drug addition. These cells were then additionally subcategorized based on their CDK2 activity after the mitotic event. The mean of the single-cell traces in a subcategory was then used to create an averaged trace representative of the particular subcategory. All cell trace analysis was done using custom MATLAB scripts and code is available upon request. See Table S1 −2 on definition of cell populations.
Retrospective Estimation of Quiescence Duration Using IF Images of Ki67
Averaged Ki67 traces of CDK2low cells in Figure 3A-B were well-fit by either 1st or 2nd order degradation laws (Figure S4A-B). It is possible to use a snapshot of Ki67 signals to estimate time since last anaphase of a cell. For this analysis, we restricted our analysis to spontaneous CDK2low cells and measured the Ki67 signal snapshots by IF. The time since last anaphase was therefore equivalent to quiescence duration. We assumed that Ki67 degradation followed either 1st or 2nd order degradation laws and constructed two types of models, a population model and a Bayesian model, for each degradation law respectively.
1st Order Degradation
If Ki67 degradation follows a 1st order degradation law, the Ki67 signal in a quiescent cell satisfies
| (1) |
where [Ki67](0) and [Ki67](t) are the Ki67 signals of the cell at mitosis and at time t respectively, both measured by IF. K1 denotes the rate constant of the 1st order degradation and t is the quiescence duration of the cell.
In the population model, we assumed that all cells shared the same values of [Ki67](0) and k1. With Equation 1, the quiescence duration of a CDK2low cell with Ki67 signal [Ki67](t) in the IF images could be predicted by
| (2) |
The value of [Ki67](0) can be estimated from all mitotic cells in the IF images. Due to cell rounding and chromosome condensation, mitotic cells display a reduction in nuclear area and the Ki67 signal appears artificially high. Therefore, measured mitotic Ki67 signals were divided by a ‘‘cell rounding factor’’ to be comparable to the measured Ki67 signals of cells in other cell-cycle phases. We computed the cell rounding factor by normalizing its H2B signal at mitosis to its average H2B signal across all time points (Figure S4D), and defined the rounding factor of a cell line as the average rounding factors of all measured cells in the cell line. The measured cell rounding factors are: MCF10A, 2.05; MCF7, 1.37; OVCAR3, 1.49; A375, 1.50. We further divided the mean of measured Ki67 signals of mitotic cells in the IF images by the cell rounding factor of the cell line, and used this as the value of [Ki67](0) for the population model.
To compute the value of k1, we performed timelapse imaging of cells with Ki67 fluorescence markers and fit the Ki67 signals of every single spontaneous CDK2low cell. To be specific, we considered the Ki67 signals of every CDK2low cell from 2 hr after its anaphase to the end of the video, and fit the traces with a 1st order degradation law using the cell’s Ki67 signal at 2 hr after anaphase as the initial condition. In other words, the only parameter to fit was the rate constant k1. We did not include Ki67 signals from mitosis to 2 hr after anaphase for fitting, because these signals were affected by cell rounding and chromosome condensation to various extents at different time points, and estimation of cell rounding factors at each time point can bring substantial uncertainty to the fitting. All single-cell fit values of k1 were then collected and the upper and lower 5% were removed to account for possible suboptimal fittings. The mean of the remaining values was used as the value of k1 for population model.
To demonstrate the predictive power of the model, we inferred the values of k1 by processing the timelapse imaging data in Figure 2A-C as described above. We then used this k1 value, the [Ki67](0) from mitotic cells in the IF images from Figure 1B, and Equation 2 to predict the quiescence durations of CDK2low cells in the IF images (Figure 1B) based on their measured Ki67 signals. The predicted values were then compared with the true quiescence durations measured in the time-lapse video that immediately preceded the IF (Figure 1B, S4C). Overall, the prediction showed a good agreement with the measurements.
We next examined whether our model with parameter values inferred from MCF10A cells could be used to predict quiescence duration based on Ki67 IF in other cell lines. We performed time-lapse imaging of MCF7, OVCAR3 and A375 cell lines followed by IF for Ki67 (Figure 1B). For each cell line, we computed the cell rounding factor as described above (Figure S4D), and used the average Ki67 signals of mitotic cells in the IF images divided by the cell rounding factor as the value of [Ki67](0) in Equation 2 while still using the value of k1 inferred from the MCF10A cell line. We predicted the quiescence durations of CDK2low cells in the IF images with Equation 2 (Figure S4C), and the predicted values correlated with the measured ones, suggesting that this model has predictive power across other cell lines.
In the Bayesian model, we assumed that the values of [Ki67](0) and k1 were drawn from probability distributions to account for possible heterogeneity of cells. We estimated the distributions of [Ki67](0) and k1 by performing nonparametric density estimation to Ki67 signals of mitotic cells in the IF images normalized by the cell rounding factors, and single-cell fitted values of k1 (with the upper and lower 5% values removed), respectively. We assumed that the two distributions were independent. We therefore expressed the probability distribution of quiescence duration t for a given Ki67 signal in the IF image as
| (3) |
where we use X0 and Xt to denote [Ki67](0) and [Ki67](t) for convenience, and δ(•) is the Dirac delta function.
We applied Equation 3 to MCF10A cells and predicted quiescence durations at various quantiles given Ki67 IF values in spontaneous CDK2low cells (Figure S4E). Comparison with measured true quiescence durations of CDK2low cells in the IF images showed that most measured durations fell between 0.1 and 0.9 quantiles of prediction, though our model tended to over-estimate the quiescence duration for cells that have short quiescence.
2nd Order Degradation
With a 2nd order degradation law, the Ki67 signal in a quiescent cell satisfies
| (4) |
where [Ki67](0) and [Ki67](t) denote the concentrations of Ki67 at mitosis and at time t respectively, and k2 is the rate constant of 2nd order degradation.
In contrast to 1st order models, the value of k2 could not be inferred from the measured Ki67 traces directly. To demonstrate this, we assumed that the concentration of Ki67 and the measured Ki67 signals M(t) differed by an unknown scaling factor C, i.e.
| (5) |
If we fit M(t) to a 2nd order degradation law, the inferred degradation rate constant would be Ck2 which could not be converted to k2. In addition, since the value of C was dependent on measurement conditions, this inferred value could not be used in other experiments.
To construct a relation which is independent of measurement conditions, we made use of the fact that the scaling factor C was a constant in an experiment. We considered a special time point (called ‘‘initial half-life,’’ denoted by t1/2(0)) where Ki67 concentrations dropped to half of their mitotic values. Based on Equation 4, we have
| (6) |
Multiplying both sides of Equation 4 by [Ki67](0) and making use of Equation 6, we arrived at the relation
| (7) |
and
| (8) |
when expressed in measured Ki67 signals M(t). Since Equation 8 contained no terms of C, this relation was independent of measurement conditions and we could use it to analyze both timelapse imaging and IF data.
In a population model, we assumed that all cells share the same Ki67 signal at mitosis measured by both timelapse imaging and IF, as well as the same value of t1/2(0). If we denote the Ki67 signal at mitosis measured by IF by M(0), the quiescence duration for a CDK2low cell with Ki67 signal M(t) in the IF images could then be estimated by
| (9) |
We estimated the value of M(0) as described for 1st order models and estimated t1/2(0) using the following procedure: We first fit the Ki67 signals of each CDK2low cell from 2 hr after anaphase to the end of video with the 2nd order degradation law, while fixing the Ki67 signal at 2 hr after mitosis as the initial condition. The fitted value (i.e., Ck2) was then multiplied by its Ki67 signals at mitosis and divided by the cell rounding factor of the cell line, and the result was the inverse initial half-life of the cell. The initial half-life of all CDK2low cells were then collected and the upper and lower 5% values were removed. The mean of the remaining values was used to generate the value of t1/2(0) for the cell line.
To demonstrate the predictive power of the model, we inferred the values of M(0) and t1/2(0) from timelapse imaging data of MCF10A cells and predicted the quiescence durations of CDK2low cells in the IF images by applying Equation 9 to both MCF10A cells as well as three other cell lines. Similar to 1st order models, predicted quiescence durations using 2nd order models were correlated with the measured true quiescence durations (Figure S4C).
In the Bayesian Model, we assumed that every cell drew its values of M(0) and t1/2(0) independently from two probability distributions, estimated by performing nonparametric density estimation on Ki67 signals of mitotic cells in the IF images normalized by the cell rounding factors and single-cell fit values of t1/2(0) (with the upper and lower 5% values removed). The probability distribution of quiescence duration t for a given Ki67 signal in the IF image could then be computed by
| (10) |
where we used X0, Xt and T to denote M(0), M(t) and t1/2(0) for convenience. We applied Equation 10 to MCF10A cells and compared the predicted distributions of quiescence durations with measured true ones. Most measured durations fell between 0.1 and 0.9 quantiles, and unlike the 1st order model, no apparent bias of prediction was found.
Comparison of Models
Although the average Ki67 traces in CDK2low cells were better fit by 2nd order degradation than 1st order (Figure S4A-B), the 1st order population model displayed a higher predictive power than the 2nd order population model for all four cell lines (Figure S4C). The half-life for 2nd order population depends on the initial condition, but the half-life for 1st order kinetics does not. Therefore, the estimation of kinetic constant k1 for 1st order models only required single-cell fitting of Ki67 traces, while estimation of initial half lives t1/2(0) for 2nd order models required both single-cell fitting and measurement of Ki67 signals at mitosis. This extra requirement in 2nd order models would bring more uncertainty to the model parameters, resulting in a worse prediction. Meanwhile, in the Bayesian models, the distribution of Ki67 signals at mitosis was explicitly considered. In terms of uncertainty, the distribution of t1/2(0) in the 2nd order Bayesian model was then only dependent on single-cell fitting, which was equivalent to the 1st order Bayesian model. Since the degradation of Ki67 signals was better captured by the 2nd order degradation law, the prediction of the 2nd order Bayesian model was more consistent with measured true quiescence durations than the 1st order Bayesian model (Figure S4E).
Finally, our models required performing time-lapse imaging for every cell line once to compute the cell rounding factor, which was necessary for obtaining the proper Ki67 signals at mitosis. Without this information, if one chose the value of rounding factor arbitrarily, calculated Ki67 signals at mitosis would have a constant fold-difference from the true signals. Consequently, the predicted quiescence durations of both 1st and 2nd order models would be shifted by a constant value. Though the prediction error would typically increase, the correlation between predicted and measured durations would remain unchanged.
QUANTIFICATION AND STATISTICAL ANALYSIS
Data are presented as mean ± SEM unless otherwise indicated in figure legends. Sample number (n) represents the number of cell s unless specified otherwise. Statistical tests used are indicated in figure legends. Data analysis was not blinded.
Supplementary Material
Highlights.
Ki67 levels are hard-wired into cell-cycle progression and cell-cycle exit
Ki67 is degraded continuously in G0 and G1 and accumulates from S to M phases
Ki67 levels in G0 and G1 indicate how long a cell has spent in G0/G1
This study enhances interpretation of this common clinical biomarker
ACKNOWLEDGMENTS
We thank Dr. Galit Lahav for the MCF7 Ki67-YFP knockin cell line, Dr. Xuedong Liu for the B-Myb antibody, and members of the Spencer lab for general help and discussion. This work was supported by an NIH instrumentation grant (S10OD021601) to Dr. Xuedong Liu and by a Beckman Young Investigator award, an NIH K22 Early-Career Investigator award (1K22CA188144–01), a Boettcher Webb-Waring Early-Career Investigator award, a Kimmel Scholar award (SKF16–126), a Pew-Stewart Scholar award, and a Searle Scholar award (SSP-2016–1533) to S.L.S.
Footnotes
DECLARATION OF INTERESTS
The authors declare no competing interests.
SUPPLEMENTAL INFORMATION
Supplemental Information includes four figures, two tables, and four videos and can be found with this article online at https://doi.org/10.1016/j.celrep.2018.06.110.
REFERENCES
- Cappell SD, Chung M, Jaimovich A, Spencer SL, and Meyer T (2016). Irreversible APC(Cdh1) inactivation underlies the point of no return for cell-cycle entry. Cell 166, 167–180. [DOI] [PMC free article] [PubMed] [Google Scholar]
- Cidado J, Wong HY, Rosen DM, Cimino-Mathews A, Garay JP, Fessler AG, Rasheed ZA, Hicks J, Cochran RL, Croessmann S, et al. (2016). Ki-67 is required for maintenance of cancer stem cells but not cell proliferation. Oncotarget 7, 6281–6293. [DOI] [PMC free article] [PubMed] [Google Scholar]
- Cuylen S, Blaukopf C, Politi AZ, M€uller-Reichert T, Neumann B, Poser I, Ellenberg J, Hyman AA, and Gerlich DW (2016). Ki-67 acts as a biological surfactant to disperse mitotic chromosomes. Nature 535, 308–312. [DOI] [PMC free article] [PubMed] [Google Scholar]
- Dowsett M, and Dunbier AK (2008). Emerging biomarkers and new understanding of traditional markers in personalized therapy for breast cancer. Clin. Cancer Res 14, 8019–8026. [DOI] [PubMed] [Google Scholar]
- Fischer M, Grossmann P, Padi M, and DeCaprio JA (2016). Integration of TP53, DREAM, MMB-FOXM1 and RB-E2F target gene analyses identifies cell cycle gene regulatory networks. Nucleic Acids Res. 44, 6070–6086. [DOI] [PMC free article] [PubMed] [Google Scholar]
- Gerdes J, Lemke H, Baisch H, Wacker HH, Schwab U, and Stein H (1984). Cell cycle analysis of a cell proliferation-associated human nuclear antigen defined by the monoclonal antibody Ki-67. J. Immunol 133, 1710–1715. [PubMed] [Google Scholar]
- Gookin S, Min M, Phadke H, Chung M, Moser J, Miller I, Carter D, and Spencer SL (2017). A map of protein dynamics during cell-cycle progression and cell-cycle exit. PLoS Biol. 15, e2003268. [DOI] [PMC free article] [PubMed] [Google Scholar]
- Ishida S, Huang E, Zuzan H, Spang R, Leone G, West M, and Nevins JR (2001). Role for E2F in control of both DNA replication and mitotic functions as revealed from DNA microarray analysis. Mol. Cell. Biol 21, 4684–4699. [DOI] [PMC free article] [PubMed] [Google Scholar]
- Lin J-R, Fallahi-Sichani M, and Sorger PK (2015). Highly multiplexed imaging of single cells using a high-throughput cyclic immunofluorescence method. Nat. Commun 6, 8390. [DOI] [PMC free article] [PubMed] [Google Scholar]
- Rahmanzadeh R, Hüttmann G, Gerdes J, and Scholzen T (2007). Chromophore-assisted light inactivation of pKi-67 leads to inhibition of ribosomal RNA synthesis. Cell Prolif. 40, 422–430. [DOI] [PMC free article] [PubMed] [Google Scholar]
- Sadasivam S, and DeCaprio JA (2013). The DREAM complex: master coordinator of cell cycle-dependent gene expression. Nat. Rev. Cancer 13, 585–595. [DOI] [PMC free article] [PubMed] [Google Scholar]
- Sakaue-Sawano A, Kurokawa H, Morimura T, Hanyu A, Hama H, Osawa H, Kashiwagi S, Fukami K, Miyata T, Miyoshi H, et al. (2008). Visualizing spatiotemporal dynamics of multicellular cell-cycle progression. Cell 132, 487–498. [DOI] [PubMed] [Google Scholar]
- Schluuter C, Duchrow M, Wohlenberg C, Becker MH, Key G, Flad HD, and Gerdes J (1993). The cell proliferation-associated antigen of antibody Ki-67: a very large, ubiquitous nuclear protein with numerous repeated elements, representing a new kind of cell cycle-maintaining proteins. J. Cell Biol 123,513–522. [DOI] [PMC free article] [PubMed] [Google Scholar]
- Sobecki M, Mrouj K, Camasses A, Parisis N, Nicolas E, Llères D, Gerbe F, Prieto S, Krasinska L, David A, et al. (2016). The cell proliferation antigen Ki-67 organises heterochromatin. eLife 5, e13722. [DOI] [PMC free article] [PubMed] [Google Scholar]
- Sobecki M, Mrouj K, Colinge J, Gerbe F, Jay P, Krasinska L, Dulic V, and Fisher D (2017). Cell-cycle regulation accounts for variability in Ki-67 expression levels. Cancer Res. 77, 2722–2734. [DOI] [PubMed] [Google Scholar]
- Spencer SL, Cappell SD, Tsai F-C, Overton KW, Wang CL, and Meyer T (2013). The proliferation-quiescence decision is controlled by a bifurcation in CDK2 activity at mitotic exit. Cell 155, 369–383. [DOI] [PMC free article] [PubMed] [Google Scholar]
- Starborg M, Gell K, Brundell E, and Höög C (1996). The murine Ki-67 cell proliferation antigen accumulates in the nucleolar and heterochromatic regions of interphase cells and at the periphery of the mitotic chromosomes in a process essential for cell cycle progression. J. Cell Sci. 109, 143–153. [DOI] [PubMed] [Google Scholar]
- Stewart-Ornstein J, and Lahav G (2016). Dynamics of CDKN1A in single cells defined by an endogenous fluorescent tagging toolkit. Cell Rep. 14, 1800–1811. [DOI] [PMC free article] [PubMed] [Google Scholar]
- Sun X, Bizhanova A, Matheson TD, Yu J, Zhu LJ, and Kaufman PD (2017). Ki-67 contributes to normal cell cycle progression and inactive X heterochromatin in p21 Checkpoint-proficient human cells. Mol. Cell. Biol 37, e00569–16. [DOI] [PMC free article] [PubMed] [Google Scholar]
- van Dierendonck JH, Keijzer R, van de Velde CJH, and Cornelisse CJ (1989). Nucleardistribution ofthe Ki-67 antigen during thecell cycle: comparison with growth fraction in human breast cancercells. Cancer Res. 49, 2999–3006. [PubMed] [Google Scholar]
- Zheng H, Tsuneyama K, Cheng C, Takahashi H, Cui Z, Murai Y, Nomoto K, and Takano Y (2006). An immunohistochemical study of P53 and Ki-67 in gastrointestinal adenoma and adenocarcinoma using tissue microarray. Anticancer Res. 26 (3B), 2353–2360. [PubMed] [Google Scholar]
Associated Data
This section collects any data citations, data availability statements, or supplementary materials included in this article.