

Abstract
AIMS:
To evaluate three in vitro phenotypic methods; tissue culture plate, tube method, and Congo red agar for detection of biofilm formation in staphylococci and assess the relation of biofilm formation with methicillin resistance and anti-microbial resistance.
METHODS:
The study included 150 staphylococcal isolates. Biofilm detection in staphylococci was performed using tissue culture plate, tube method, and Congo red agar.
RESULTS:
Tissue culture plate, tube method, and Congo red agar detected 74%, 42.7%, and 1.3% biofilm producing staphylococci respectively. S. aureus isolates were more common biofilm producers (53.2%) than CONS (46.8%). Biofilm production in CONS species was highest in S. hemolyticus (57.7%). Tube method was 51.4% sensitive, 82.1% specific. As for Congo red agar, sensitivity was very low (0.9%), but specificity was 97.4%. Biofilm producers were mostly; isolated from blood specimens and detected in methicillin-resistant strains 96/111 (86.5%). They were resistant to most antibiotics except vancomycin and linezolid.
CONCLUSIONS:
Tissue culture plate is a more quantitative and reliable method for detection of biofilm producing staphylococci compared to tube method and Congo red agar. Hence, it can still be used as a screening method for biofilm detection. Vancomycin and Linezolid are the most sensitive antibiotics among biofilm producing staphylococci.
Keywords: Biofilm, Staphylococci, Methicillin, TCP, TM, CRA
Introduction
Staphylococcus aureus is a virulent organism that is resistant to most of the conventionally available antibiotics. This is attributed to the fact that they are capable of biofilms formation [1]. Biofilm consists of multilayered cell clusters embedded in a matrix of extracellular polysaccharide, which facilitate the adherence of microorganism [2]. The interior of the bacterial biofilms presents greater resistance to the opsonisation by antibodies and phagocytosis. This explains the chronic character of these infections such as endocarditis, osteomyelitis and especially those infections associated with implanted medical devices that are difficult to be treated [1].
Coagulase-negative staphylococci especially S. epidermidis is the most frequent cause of hospital-acquired infections. Most S. epidermidis infections are subacute or chronic and occur mainly in immunocompromised individuals or patients with indwelling medical devices. Biofilm formation on the surface of indwelling devices is often involved in the pathogenesis [3]. Biofilms can resist antibiotic concentration 10-10,000 folds higher than those required to inhibit the growth of free-floating Staphylococci. Biofilm producing staphylococci have also been isolated from various clinical samples like blood, urine, pus, skin surface etc. The differentiation of staphylococci concerning its biofilm phenotype might help in their diagnosis and thereby, prevention of infections [4]. Biofilm is an increasing cause of morbidity and mortality associated with chronic and nosocomial infections, so a greater understanding of the nature of intracellular bacterial communities in infections, their early detection and management will aid in the development of new and more effective treatments [5]. A number of tests are available to detect slime production by staphylococci; which include quantitative methods such as tissue culture plate (TCP), which is considered as the gold-standard method for biofilm detection [6], and qualitative methods such as tube method (TM) [7], and Congo red agar (CRA) [8].
Materials and Methods
This study was conducted on 150 staphylococcal isolates randomly selected from different clinical specimens submitted to the Microbiology Laboratory of Ain Shams University Hospitals. They were isolated from different specimens; 30 pus, 46 blood, nine (9) wound, 15 urine, 22 sputa, 17 central line, five body fluids and six others (two ear swabs, two throat swabs, one bile drain and one radivac). All the isolates were identified morphologically by Gram stain, colonial morphology on culture, catalase test to differentiate it from Streptococcus species and DNase test to differentiate S. aureus from coagulase-negative staphylococci (CONS). Identification of CONS species and antibiotic susceptibility testing for all isolates were made using an automated identification system (Vitek 2, bioMérieux, France) according to CLSI guidelines 2015 [9].
Biofilm detection was performed using TCP [6], TM [7] and CRA [8]. S. aureus (ATCC 25923) was used as negative control.
Tissue culture plate method was performed as described by Christensen et al., 1985 [6] for quantitative measurement of biofilm production in Staphylococcus spp. Using a microtiter assay. A single colony from each subcultured plate on blood agar was inoculated in a glass tube containing two ml TSBglu. The tubes were incubated overnight at 36°C ± 1 under aerobic conditions. Two hundred microlitres from each of the inoculated TSBglu tubes were aseptically transferred in the wells of a flat-bottomed microwell plastic plate. The inoculated microwell plastic plate was incubated overnight at 36°C ± 1 without sealing of the plate for proper oxygenation. Next day, the contents were discarded by inverting the plate and striking it on filter paper. The microwell plastic plate was washed once by adding 200 μl PBS (pH 7.2) into each well and then discarded. Then 200ul of freshly prepared sodium acetate (2%) was added to each well (for biofilm fixation) for 10 minutes and then discarded. This was followed by adding 200 μl crystal violet (0.1%) to each well for biofilm staining. The Plates was kept at room temperature for 30 minutes, and then the stain was discarded. The washing step was repeated once more. Finally, the plate was left to dry at room temperature for one hour, after which, the absorbance was read on a spectrophotometer at 620 nm OD (Figure 1).
Figure 1.
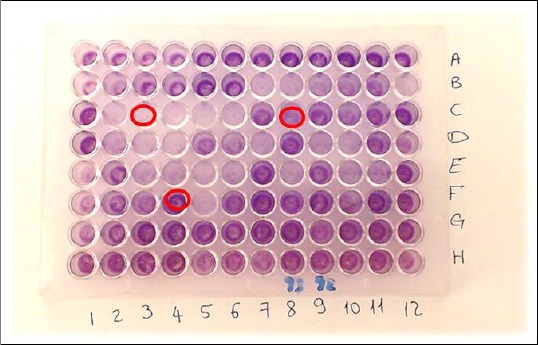
Tissue culture plate showing different biofilm intensities; C3: Non-biofilm producer; C8: moderate biofilm producer; F4: strong biofilm producer
The optical density (OD) value of each isolate was interpreted according to the following table to assess the degree of the biofilm (Table 1).
Table 1.
Interpretation of results of Tissue Culture Plate method
| OD Value | Biofilm Formation |
|---|---|
| <0.120 | Non-biofilm producer |
| 0.120-0.240 | Moderate biofilm producer |
| >0.240 | Strong biofilm producer |
Tube method was done as described by Christensen et al., 1982 [7] for qualitative assessment of biofilm production. A loopful inoculum was inoculated on 10 ml TSBglu in plastic tubes. Tubes were incubated aerobically at 36°C ± 1 for 24 hours. Tubes content was discarded, and tubes were washed once with 9 ml phosphate buffer saline pH 7.2 and then discarded. For biofilm fixation, 10 ml of freshly prepared sodium acetate (2%) was added to each tube for 10 minutes and then discarded. For biofilm staining, 10 ml crystal violet (0.1%) was then added to each tube, and tubes were left at room temperature for 30 minutes after which the stain was discarded. The washing step was repeated, and tubes were left to dry in an inverted position at room temperature. Biofilm formation was detected by the presence of visible film on the wall and bottom of the tube. The amount of biofilm formation was interpreted according to the results of the control strain and graded visually as absent, moderate and strong biofilm formation respectively (Figure 2).
Figure 2.
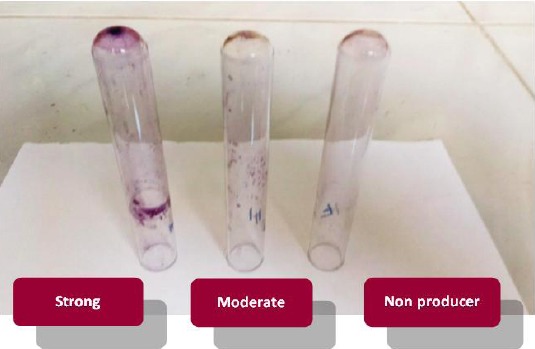
Tube method with different degrees of biofilm formation
The Congo red method was done as described by Freeman et al., 1989 [8] for qualitative assessment of biofilm production. Congo red stain (Research lab fine chem. Industries, India) was prepared as a concentrated aqueous solution of 0.8 g/200 ml distilled water and autoclaved separately from other medium constituents. The dye directly interacts with certain polysaccharides in the biofilm forming coloured complexes. Brain heart infusion agar (37 g) and sucrose (50 g) were dissolved in 800ml distilled water and autoclaved. Congo red stain (200ml) was then added when the agar cooled to 55°C. Staphylococcal strains were inoculated on the prepared media and incubated aerobically at 37°C for 24 hours. Black colonies with dry crystalline consistency indicate strong biofilm formation. Red colonies with occasional darkening at the centre of the colonies were considered non-biofilm producers (Figure 3).
Figure 3.
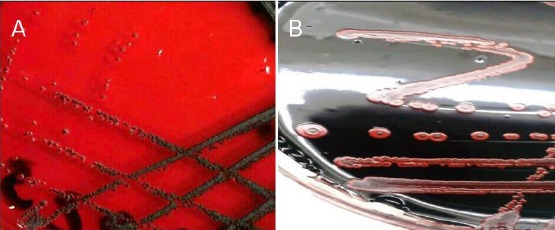
A) CRA showing black colonies with dry crystalline consistency (positive for biofilm formation); B) CRA showing red colonies with darkening at the centre (negative for biofilm formation)
Results
In this study, 150 clinical isolates of staphylococci were isolated; 78 (52%) were S. aureus, and 72 (48%) were CONS. Identification of CONS by Vitek 2 system revealed 41 S. hemolyticus, 18 S. epidermidis, 11 S. hominis, one S. simulans and one S. warneri. Biofilm detection in staphylococci was performed using TCP method, TM and CRA method.
The TCP method detected total positive biofilm production in 111 (74%) staphylococcal isolates, the strong positive was 65 (43.3%), and moderate positive were 46 (30.7%). As for the TM method, total positive biofilm production was 64 (42.7%), the strong positive was 11 (7.3%), and 53 (35.3%) were moderately positive. CRA method detected biofilm production only in 2 isolates (1.3%) (Figure 4).
Figure 4.
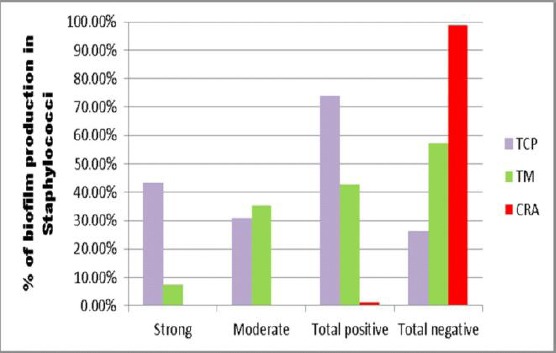
Comparison between TCP, TM and CRA as regards detection of biofilm formation in Staphylococci
Table 2 shows a comparison between the results of biofilm production by TM and TCP, using the Chi-square test. TM is considered a highly significant test, P value (< 0.001). As for CRA, it detected a very low number of biofilm producers (two) compared to total positive biofilm producers by TCP (111), according to the P value (0.579) CRA method is considered the non-significant test.
Table 2.
Comparison between TM and TCP as regards biofilm production
| TCP | |||||||
|---|---|---|---|---|---|---|---|
| Non- producers | Moderate producers | Strong producers | Total Staph. isolates | P value | Chi- square | ||
| TM | Non- producers | 32 | 29 | 25 | 86 | <0.001 | 20.445 |
| 82.1% | 63.0% | 38.5% | 57.3% | ||||
| Moderate producers | 6 | 13 | 34 | 53 | |||
| 15.4% | 28.3% | 52.3% | 35.3% | ||||
| Strong producers | 1 | 4 | 6 | 11 | |||
| 2.6% | 8.7% | 9.2% | 7.3% | ||||
| Total Staph. isolates | 39 | 46 | 65 | 150 | |||
In our study, Sixty-eight out of 78 (87.1%) of S. aureus were MRSA, and 63 out of 72 (87.5%) of CONS were methicillin resistant. (Table 3) Shows detection of biofilm formation in staphylococci in relation to methicillin susceptibility. By TCP method, biofilm production was detected in 73.3% of MRS (75% of MRSA, 71.4% of MRCONS) and 78.9% of MSS were biofilm producers. The 65 strong biofilm producers were; 30 (46.1%) MRSA, 6 (9.2%) MSSA, 24 (36.9%) MRCONS and 5 (7.7%) MSCONS. The 46 moderate biofilm producers were; 21 MRSA, 2 MSSA, 21 MRCONS and 2 MSCONS). As for TM, the 11 strong biofilm producers were 6(54.5%) MRSA and 5 (45.5%) MRCONS. By TM, The 53 moderate biofilm producers were 28 S. aureus [21 (39.6%) MRSA, 7(13.2%) MSSA], 25 CONS [22] (41.5%) MRCONS, 3 (5.7%) MSCONS]. Congo red agar method detected only two MRCONS biofilm producers.
Table 3.
Detection of biofilm formation in staphylococci in relation to methicillin susceptibility
| S. aureus (no 78) | CoNS (no 72) | ||||||
|---|---|---|---|---|---|---|---|
| MRSA 68 | MSSA 10 | MRCoNS 63 | MSCoNS 9 | MRS 131 | MSS 19 | Total staphylococci 150 | |
| Tissue culture plate method (strong) | 3 | 6 | 24 | 5 | 54 | 11 | 65 |
| 0 | |||||||
| % | 46.2% | 9.2% | 36.9% | 7.7% | 36% | 7.3% | 43.3% |
| Tissue culture plate method (moderate) | 2 | 2 | 21 | 2 | 42 | 4 | 46 |
| 1 | |||||||
| % | 45.7% | 4.3% | 45.7% | 4.3% | 28% | 2.6% | 30.7% |
| Tissue culture plate method (negative) | 1 | 2 | 18 | 2 | 35 | 4 | 39 |
| 7 | |||||||
| % | 43.6% | 5.1% | 46.2% | 5.1% | 23.3% | 2.6% | 26% |
| Total positive | 5 1 | 8 | 45 | 7 | 96 | 15 | 111 |
| % | 45.9% | 7.2% | 40.5% | 6.3% | 64% | 10% | 74% |
| Tube method (strong) | 6 | 0 | 5 | 0 | 11 | 0 | 11 |
| % | 54.5% | 0% | 45.5% | 0% | 7.3% | 0% | 7.3% |
| Tube method (moderate) | 21 | 7 | 22 | 3 | 43 | 10 | 53 |
| % | 39.6% | 13.2% | 41.5% | 5.7% | 28.6% | 6.7% | 35.3% |
| Tube method (negative) | 41 | 3 | 36 | 6 | 77 | 9 | 86 |
| Total positive | 27 | 7 | 27 | 3 | 54 | 10 | 64 |
| % | 42.2% | 10.9% | 42.2% | 4.7% | 36.6% | 6.7% | 42.7% |
MRSA: Methicillin-Resistant Staphylococcus aureus; MSSA: Methicillin-Sensitive Staphylococcus aureus; MRCONS: Methicillin-Resistant Coagulase negative Staphylococci; MSCONS: Methicillin Sensitive Coagulase negative Staphylococci; MRS: Methicillin-Resistant Staphylococci; MSS: Methicillin Sensitive Staphylococci.
Table 4 shows biofilm production in different CONS species. By TCP, biofilm production in CONS species was highest in S. hemolyticus (57.7%), followed by S. epidermidis (21.2%) and then S. hominis (19.2%). By TM, biofilm production in CONS species was highest in S. hemolyticus (46.7%), followed by S. epidermidis (33.3%) and S. hominis (20%). Whereas, Only two S. epidermidis isolates were biofilm producers by CRA method.
Table 4.
Biofilm production in CONS species
| CONS species | |||||
|---|---|---|---|---|---|
| S. hemolyticus | S. epidermidis | S. hominis | S. simulans | S. warneri | |
| Biofilm producers by TCP (111) | 30 | 11 | 10 | 0 | 1 |
| % from total biofilm producers | 57.7% | 21.2% | 19.2% | 0% | 1.9% |
| Biofilm producers by TM (64) | 14 | 10 | 6 | 0 | 0 |
| % from total biofilm producers | 46.7% | 33.3% | 20% | 0% | 0% |
Biofilm production in staphylococci among various clinical specimens as detected by TCP method showed that the highest percentage were isolated from Blood cultures (82.6%) followed by urine (80%) and body fluids (80%) (Figure 5).
Figure 5.
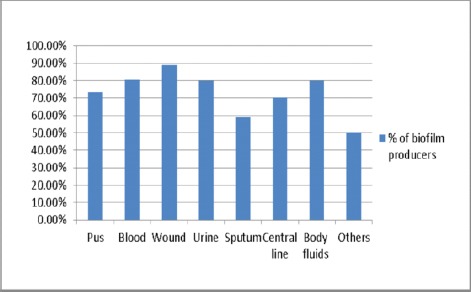
Biofilm production in staphylococci isolated from various clinical specimens (TCP method)
Comparative analytical study of TM and CRA methods about TCP method which is considered as the standard gold test showed that tube method was 51.4% sensitive, 82.1% specific for biofilm detection, PPV and NPV were 89% and 37.2% respectively.
As for congo red agar method, sensitivity was very low (0.9%), but specificity was 97.4% for biofilm detection, PPV and NPV were 50% and 25.7% respectively.
Biofilm producing strains were more resistant to almost all the classes of antibiotics showing resistance to Cefoxitin in 87.4% of staphylococci, Levofloxacin 57.7%, Gentamycin 53.2%, Clindamycin 60.4%, Erythromycin 69.5%, Doxycycline 40.5%, and Linezolid 3.6%. Biofilm non-producers were comparatively less resistant; Cefoxitin resistance was detected in 87.2% of staphylococci, Levofloxacin 43.6%, Gentamycin 23.6%, Clindamycin 53.8%, Erythromycin 61.5%, Doxycycline 18% and Linezolid 1.3%. All isolates were sensitive to vancomycin.
Figure 6 shows the antibiotic resistance pattern of Biofilm producers and non- producers as detected by the TCP method.
Figure 6.
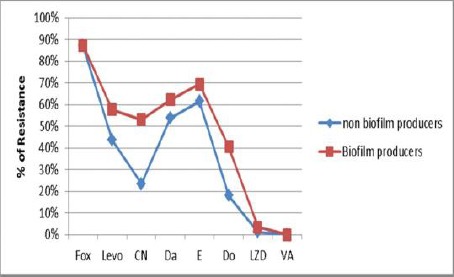
Antibiotic resistance pattern of Biofilm producers and non-producers staphylococci; Fox: Cefoxitin; LZD: Linezolid; levo: Levofloxacin; CN: Gentamycin; Da: Clindamycin; E: Erythromycin; Do: Doxycycline; VA: Vancomycin
Discussion
Biofilm formation is considered an important cause of all staphylococcal species associated with the infection of biomedical devices. Biofilm producing staphylococci isolated from other clinical samples are also of clinical significance as biofilm constitutes a reservoir of pathogens and are associated with resistance to antimicrobial agents and chronic infections. So, a reliable and easy method for their diagnosis is necessary [10].
Our study tested 150 clinical isolates of staphylococci by three in-vitro screening procedures for their ability to form a biofilm. TCP method is the standard gold method as reported by Mathur et al., 2006 [11], hence it was considered a standard method for interpretation of our results. Biofilm producing staphylococcal isolates were 74% when TCP was performed (43.3% strong producers and 30.7% moderate producers). This method gave the best discrimination between strong, moderate and non-production of biofilm as it used to cut off values. Results of our study were higher than other studies [11] [12] [13] [14] [15] [16] who reported 53.9%, 54.2%, 21.8%, 46%, 43.3%, and 39.7% of staphylococci as biofilm producers respectively.
We detected biofilm production in 53.2% of S. aureus and 46.8% of CONS by TCP method. Fatima et al., 2011 [17] also reported a high percentage of S. aureus as biofilm producers (64.89%). However, Akinkunmi and Lamikanra 2012 [13] reported 36% of S. aureus and 32.9% of CONS as biofilm producers and Ramakrishna et al., 2014 [10] reported 38% of S. aureus while 84% of CONS as biofilm producers. This might be attributed to the difference in the sources from which their strains were isolated.
Our results revealed that S. hemolyticus was the most frequently isolated species among CONS. However, Oliveira and Cunha, 2010 [18] reported S. epidermidis as the most frequently isolated species among CONS. This could be explained by the difference in the type of specimens selected; where half of the specimens collected in their study were catheter tips from which S. epidermidis is usually isolated (their study included 100 specimens, 50 catheter tips, 30 blood cultures and 20 nasal swabs).
We detected a high percentage of biofilm production in staphylococci isolated from blood culture specimens (82.6%). On the other hand, Sharvari and Chitra, 2012 [15] found a very high incidence of biofilm production in staphylococcal isolates from patients with artificial devices (89.5%), whereas, biofilm production in staphylococcal isolates from blood culture specimens were 45.9%. Also, Oliveira and Cunha, 2010 [18] detected 54.3% and 28.4% biofilm producing staphylococcal from catheter tips whereas and blood culture specimens respectively.
However, our sputum samples gave the least percentage of biofilm production (59.1%). Sharvari and Chitra, 2012 [15] also detected the least biofilm producing specimens among their sputum samples (26.3%).
Biofilm production was detected in methicillin-sensitive strains more than methicillin resistant in our isolates, where, biofilm production was found in 78.9% MSS, and 73.3% MRS [80% of MSSA, 75% of MRSA, 77.8% of MSCONS and 71.4% of MRCONS] were biofilm producers. This is concordant with O’Neill et al., 2007 [19] who reported biofilm production in 74% among MRSA and 84% among MSSA isolate.
They stated that the significant association between methicillin susceptibility in S. aureus and ica-dependent biofilm formation was first reported when PIA production was found to be essential for biofilm formation by MSSA but not MRSA. Furthermore, MSSA biofilms are significantly induced in growth media supplemented with NaCl, which is known to activate ica operon expression.
However, this was not the case in Sharvari and Chitra, 2012 [15] who reported biofilm production in 72.3% of methicillin-resistant and 30.3% methicillin sensitive staphylococci (80.8% of MRSA, 31.6 of MSSA, 60% of MRCONS and 28% of MSCONS). Also, Rewatkar and Wadher 2013 [20] reported biofilm production in 85% among MRSA and 15% among MSSA isolates. Eiichi et al., 2004 [21] found a very high percentage (95.4%) of biofilm production in MRSA and Fatima et al., 2011 [17] reported 87.6% of MRSA as biofilm producers.
In our work, Tube method detected less number of biofilm producers, 42.7% which was lower compared to the TCP method. This difference may be due to the inter-observer variability in the reading of results, also may be due to performing the test using plastic tubes instead of glass, hindering visual interpretation. This was concordant with Saha et al., 2014 [22] where the TCP method detected 69% of biofilm producers, whereas, TM detected only 36%. They further stated that this method could discriminate between strong and moderate biofilm producers. However, the interpretation is observer dependent and there are chances of subjective errors. Our results were nearly similar to Mathur et al., 2006 [11] and Umadevi and Sailaja 2014 [23] who reported 41.4% and 42.5% as biofilm producers by TM respectively. On the other hand, Oliveira and Cunha, 2010 [18] and Reddy 2017 [24] reported a higher percentage; 82% and 63% biofilm producers by TM respectively.
Congo red agar method was found to be easier and faster to perform than other phenotypic methods, but it only detected 1.3% of biofilm producing staphylococci in our study. Knobloch et al., 2002 [25], Mathur et al. 2006 [11], and Taj et al., 2012 [26] also reported very low percentage of positive biofilm producers by CRA method, 3.8%, 5.3%, and 3.4% respectively. The low percentage of positive results by CRA in our work might be attributed to the technique of preparation of the CRA, where congo red stain was autoclaved before being added to the agar. On the contrary, the study performed by Sharvari and Chitra, 2012 [15] gave higher results (25.3%). This could be attributed to congo red stain being prepared separately without autoclaving in sterile distilled water and then added to sterile molten autoclaved agar. Also, modified CRA method as described by Kaiser et al., 2013 [27] can be used instead to increase capacity of biofilm detection (the formula included BHIA with sucrose (5%), Congo red (0.08%), NaCl (1.5%), glucose (2%), and vancomycin (0.5 mg/mL). According to their study, this formula showed a high percentage of correlation among biofilm production in S. epidermidis and the presence of the icaAB gene (82.9%). The addition of vancomycin at a sub-MIC concentration (0.5 μg/mL) to modified CRA led to phenotype change in 64.8% of their strains, all of which were classified as a non-biofilm producer by the original CRA method and presenting the icaAB genes. The presence of a minimum concentration of vancomycin probably acts as a stress factor against the bacterial cells, which may lead to some alterations such as cell wall thickening [28] and may induce an increased expression of genes related to biofilm formation [29] [30].
Mathur et al., 2006 [11] recommended performing CRA method from S. epidermidis strains freshly isolated from clinical specimens of patients when the strains still retain their virulence characteristics expressed in “in vivo” conditions.
Also, some studies revealed higher results than ours as [31] [18] [20] who reported 83%, 73% and 90% of positive biofilm producers respectively. Cafiso et al., 2004 [31] explained the detection of a high percentage of biofilm producers (83%) by CRA by the addition of glucose 1%w/v in the congo red medium enhancing the production of biofilm in almost all isolates, where two is-positive non-biofilm producers by TCP became producers in CRA.
In the present study, the sensitivity of tube method was 51.4%, and specificity was 82.1% for biofilm detection which was higher than Saha et al., 2014 [22] who reported 34.21% sensitivity and 58.82% specificity for biofilm detection. However, Mathur et al., 2006 [11] and Bose et al., 2009 [12] reported higher sensitivity and specificity 73.6%, 76.3%, 92.6% and 97.6% respectively.
On the other hand, we report very low sensitivity for congo red agar method (0.9%) but higher specificity (97.4%) for biofilm detection. Also, (Mathur et al., 2006 [11], Bose et al., 2009 [12], and Saha et al., 2014 [22] reported 6.8%, 8.3% and and 21.1% sensitivity, 90.2%, 96.3% and 58.8% specificity respectively. Our results were discordant with the findings of Oliveira and Cunha, 2010 [18] who reported higher sensitivity 89% and specificity 100% for biofilm detection.
Biofilm producing strains in our work were resistant to almost all groups of antibiotics. Among our isolates, 87.4% were resistant to Cefoxitin, Levofloxacin (57.7%), Gentamicin (53.2%), Clindamycin (60.4%), Erythromycin (69.5%) and Doxycycline (40.5%) which was lower compared to biofilm non-producing strains where resistance to Cefoxitin was 87.2%, Levofloxacin 53.6%, Gentamycin 23.6%, Clindamycin %, Erythromycin 61.5%, and Doxycycline 18%. This is concordant with Sharvari and Chitra, 2012 [15], Ramakrishna et al., 2014 [10] and Singh et al., 2017 [32] who found that staphylococci biofilm producers were more resistant to commonly used antibiotics.
In our study, all the strains were sensitive to vancomycin (100%) while only (3.6%) were resistant to linezolid. This is concordant with Sharvari and Chitra, 2012 [15] who reported 100% of their isolates sensitive to vancomycin and (4.1%) resistant to linezolid. However, in Ramakrishna et al., 2014 [10] and Hashem et al., 2017 [33] studies all the strains were sensitive to both linezolid and vancomycin.
Footnotes
Funding: This research did not receive any financial support
Competing Interests: The authors have declared that no competing interests exist
References
- 1.Taj Y, Essa F, Aziz F, Kazmi SU. Study on biofilm-forming properties of clinical isolates of Staphylococcus aureus. The Journal of Infection in Developing Countries. 2011;6(05):403–9. doi: 10.3855/jidc.1743. [DOI] [PubMed] [Google Scholar]
- 2.Agarwal A, Jain A. Drug-resistant clinical staphylococcal isolates & biofilm production. Ind J Med Res April. 2012;135:562–564. [PMC free article] [PubMed] [Google Scholar]
- 3.Macintosh RL, Brittan JL, Bhattacharya R, Jenkinson HF, Derrick J, Upton M, Handley PS. The terminal A domain of the fibrillar accumulation-associated protein (Aap) of Staphylococcus epidermidis mediates adhesion to human corneocytes. Journal of bacteriology. 2009;191(22):7007–16. doi: 10.1128/JB.00764-09. https://doi.org/10.1128/JB.00764-09 PMid:19749046 PMCid: PMC2772481. [DOI] [PMC free article] [PubMed] [Google Scholar]
- 4.Sharvari S, Chitra P. Evaluation of different detection methods of biofilm formation in clinical isolates of staphylococci. Int J Pharm Bio Sci. 2012;3(4):724–733. [Google Scholar]
- 5.Sarita Y, Madhu S, Aparna Y, Uma C. A study of biofilm production in Staphyloccus aureus. Int J Pharm Med & Biol Sci. 2014;3:61–63. [Google Scholar]
- 6.Christensen GD, Simpson WA, Younger JA, et al. Adherence of cogulase negative Staphylococi to plastic tissue cultures: a quantitative model for the adherence of staphylococci to medical devices. J Clin Microbiol. 1985;22:996–1006. doi: 10.1128/jcm.22.6.996-1006.1985. PMid:3905855 PMCid: PMC271866. [DOI] [PMC free article] [PubMed] [Google Scholar]
- 7.Christensen GD, Simpson WA, Bisno AL, et al. Adherence of slime-producing strains of Staphylococcus epidermidis to smooth surfaces. Infect Immun. 1982;37:318–26. doi: 10.1128/iai.37.1.318-326.1982. PMid:6179880 PMCid: PMC347529. [DOI] [PMC free article] [PubMed] [Google Scholar]
- 8.Freeman DJ, Falkiner FR, Keane CT. New method for detecting slime production by coagulase negative staphylococci. J Clin Pathol. 1989;42:872–4. doi: 10.1136/jcp.42.8.872. https://doi.org/10.1136/jcp.42.8.872 PMid:2475530 PMCid: PMC1142068. [DOI] [PMC free article] [PubMed] [Google Scholar]
- 9.Clinical laboratory standards institute (CLSI) Performance standards for antimicrobial susceptibility testing;Twenty fourth informational supplement M100 S25. Wayne (PA): Clinical laboratory standards institute; 2015. [Google Scholar]
- 10.Ramakrishna P, Syed A, Ashthami V, et al. Biofilm: Comparison between the Staphylococcus aureus and coagulase negative staphylococcus species isolated from a rural medical college hospital in North Kerala, India. Int J Curr Microbiol App Sci. 2014;3(1):23–29. [Google Scholar]
- 11.Mathur T, Singhal S, Khan S, et al. Detection of Biofilm Formation among the Clinical Isolates of Staphylococci: An Evaluation of Three Different Screening Methods. Ind J Med Microbiol. 2006;24(1):25–29. doi: 10.4103/0255-0857.19890. https://doi.org/10.4103/0255-0857.19890. [DOI] [PubMed] [Google Scholar]
- 12.Bose S, Khodke M, Bask S, et al. Detection of biofilm producing Staphylococci: Need of hour. J Clin Diag Res. 2009;(3):1915–1920. [Google Scholar]
- 13.Akinkunmi E, Lamikanra A. Phenotypic Determination of Some Virulence Factors in Staphylococci Isolated From Faecal Samples of Children in Ile-Ife, Nigeria. Afr J Biomed Res. 2012;15:123–128. [Google Scholar]
- 14.Nasr R, AbuShady H, Hussein S. Biofilm formation and presence of icaAD gene in clinical isolates of staphylococci. The Egy J Med Hum Gen. 2012;(13):269–274. [Google Scholar]
- 15.Sharvari S, Chitra P. Evaluation of different detection methods of biofilm formation in clinical isolates of staphylococci. Int J Pharm Bio Sci. 2012;3(4):724–733. [Google Scholar]
- 16.Snehali M, Wolffs P, Christian J, Mohammed R. Rapid detection of methicillin resistance and biofilm formation in Staphylococcal species. J Chem Pharmac Res. 2014;6(10):148–154. [Google Scholar]
- 17.Fatima K, Indu S, Meher R, et al. Detection of Biofilm formation in Staphylococcus aureus. Does it have a role in t/t of MRSA infections? Trends in Med Res. 2011;2:116–123. [Google Scholar]
- 18.Oliveira A, Cunha M. Comparison of methods for the detection of biofilm production in coagulase-negative staphylococci. BMC Res Notes. 2010;3:1–8. doi: 10.1186/1756-0500-3-260. https://doi.org/10.1186/1756-0500-3-260 PMid:20946672 PMCid: PMC2973941. [DOI] [PMC free article] [PubMed] [Google Scholar]
- 19.O'Neill E, Pozzi C, Houston P, et al. Association between Methicillin Susceptibility and Biofilm Regulation in Staphylococcus aureus Isolates from Device-Related Infections. J Clin Microbiol. 2007;45(5):1379–1388. doi: 10.1128/JCM.02280-06. https://doi.org/10.1128/JCM.02280-06 PMid:17329452 PMCid: PMC1865887. [DOI] [PMC free article] [PubMed] [Google Scholar]
- 20.Rewatkar A, Wadher B. Staphylococcus aureus and Pseudomonas aeruginosa- Biofilm formation Methods. J Pharm Biol Sci. 2013;8:36–40. https://doi.org/10.9790/3008-0853640. [Google Scholar]
- 21.Eiichi A, Koichi M, Ritsuko M, et al. Biofilm formation among MRSA isolates from patients with urinary tract infection. Acta Med Okayama. 2004;4:207–214. doi: 10.18926/AMO/32090. [DOI] [PubMed] [Google Scholar]
- 22.Saha R, Arora S, Das S, et al. Detection of biofilm formation in urinary isolates: need of the hour. J Res Biol. 2004;4(1):1174–1181. [Google Scholar]
- 23.Umadevi S, Sailaja M. Evaluation of two different screening methods for detection of biofilm formation among the clinical isolates of Staphylococcus aureus. Int J Res Health Sci. 2014;2:1080–1085. [Google Scholar]
- 24.Reddy KRM. Tube Adherence Test as a Screening Tool for Detection of Biofilm Formation among Staphylococcus aureus. Int J Curr Microbiol App Sci. 2017;6(8):1325–1329. [Google Scholar]
- 25.Knobloch J, Horstkotte M, Rhode H, Mack D. Evaluation of different detection methods for biofilm formation in Staphylococcus aureus. Med Microbiol Immunol. 2002;19:101–106. doi: 10.1007/s00430-002-0124-3. https://doi.org/10.1007/s00430-002-0124-3 PMid:12410349. [DOI] [PubMed] [Google Scholar]
- 26.Taj Y, Essa F, Aziz F, Kazmi S. Study on biofilm-forming properties of clinical isolates of Staphylococcus aureus. J Infect Dev Ctries. 2012;6:403–409. doi: 10.3855/jidc.1743. https://doi.org/10.3855/jidc.1743 PMid:22610706. [DOI] [PubMed] [Google Scholar]
- 27.Kaiser T, Menezes E, Regina K, et al. Modification of the Congo red agar method to detect biofilm production by Staphylococcus epidermidis. Diag Microbiol Inf Dis. 2013;75:235–239. doi: 10.1016/j.diagmicrobio.2012.11.014. https://doi.org/10.1016/j.diagmicrobio.2012.11.014 PMid:23313084. [DOI] [PubMed] [Google Scholar]
- 28.Nunes AP, Teixeira LM, Iorio NL, et al. Heterogeneous resistance to vancomycin in Staphylococcus epidermidis, Staphylococcus haemolyticus and Staphylococcus warneri clinical strains: characterization of glycopeptide susceptibility profiles and cell wall thickening. Int J Antimicrob Agents. 2006;27(4):307–315. doi: 10.1016/j.ijantimicag.2005.11.013. https://doi.org/10.1016/j.ijantimicag.2005.11.013 PMid:16542825. [DOI] [PubMed] [Google Scholar]
- 29.Gazzola S, Cocconcelli PS. Vancomycin heteroresistance and biofilm formation in Staphylococcus epidermidis from food. Microbiology. 2008;154:3224–3231. doi: 10.1099/mic.0.2008/021154-0. https://doi.org/10.1099/mic.0.2008/021154-0 PMid:18832327. [DOI] [PubMed] [Google Scholar]
- 30.Cargill JS, Upton M. Low concentrations of vancomycin stimulates biofilm formation in some clinical isolates of Staphylococcus epidermidis. J Clin Pathol. 2009;62:1112–1116. doi: 10.1136/jcp.2009.069021. https://doi.org/10.1136/jcp.2009.069021 PMid:19640858. [DOI] [PubMed] [Google Scholar]
- 31.Cafiso V, Bertuccio T, Santagati M, et al. Presence of the ica operon in clinical isolates of Staphylococcus epidermidis and its role in biofilm production. Clin Microbiol Infect. 2004;10:1081–1088. doi: 10.1111/j.1469-0691.2004.01024.x. https://doi.org/10.1111/j.1469-0691.2004.01024.x PMid:15606635. [DOI] [PubMed] [Google Scholar]
- 32.Singh AK, Prakash P, Achra A, et al. Standardization and classification of in vitro biofilm formation by clinical isolates of Staphylococcus aureus. J Glob Infect Dis. 2017;9(3):93–101. doi: 10.4103/jgid.jgid_91_16. https://doi.org/10.4103/jgid.jgid_91_16 PMid:28878520 PMCid: PMC5572203. [DOI] [PMC free article] [PubMed] [Google Scholar]
- 33.Hashem AA, Abdel Fadeal NM, Shehata AS, et al. In vitro activity of vancomycin and linezolid against biofilm- producing methicillin-resistant staphylococci species isolated from catheter-related blood stream infections from an Egyptian tertiary hospital. J Med Microbiol. 2017;66:744–752. doi: 10.1099/jmm.0.000490. https://doi.org/10.1099/jmm.0.000490 PMid:28598310. [DOI] [PubMed] [Google Scholar]