

Summary
Epidemiological data suggest that early life exposures are key determinants of immune-mediated disease later in life. Young children are also particularly susceptible to infections, warranting more analyses of immune system development early in life. Such analyses mostly have been performed in mouse models or human cord blood samples, but these cannot account for the complex environmental exposures influencing human newborns after birth. Here, we performed longitudinal analyses in 100 newborn children, sampled up to 4 times during their first 3 months of life. From 100 μL of blood, we analyze the development of 58 immune cell populations by mass cytometry and 267 plasma proteins by immunoassays, uncovering drastic changes not predictable from cord blood measurements but following a stereotypic pattern. Preterm and term children differ at birth but converge onto a shared trajectory, seemingly driven by microbial interactions and hampered by early gut bacterial dysbiosis.
Keywords: systems immunology, human immunology, mass cytometry, CyTOF, newborn immune systems, neonatology, immune variation, preterm birth, immune system development, neonate
Graphical Abstract
Highlights
-
•
Cord blood is not representative of postnatal immunity
-
•
Preterm and term children differ at birth but rapidly converge thereafter
-
•
Immune system development follows a stereotypic pattern early in life
-
•
Dynamic parameters imply microbial interactions during early immune development
Longitudinal profiling of blood immune cells from 100 newborns provides a systemic view on the ontogeny of the human neonatal immune system.
Introduction
The human immune system is a sensory system for intrinsic and extrinsic environmental factors. Much like other sensory systems, the immune system is dependent on sensory inputs during its development, and germ-free mice have severe immune system defects (Gensollen et al., 2016). Also, in humans, early-life exposures sensed by the immune system influence the risk of developing immune-mediated diseases, such as allergies, asthma (Laforest-Lapointe and Arrieta, 2017), and type 1 diabetes (Vatanen et al., 2016), later in life. Specifically, interactions between the developing immune system and the microbes colonizing the intestine, skin, and airways of a newborn child have been suggested as important. The first 100 days of life seems to be a critical period because microbial dysbiosis during this period was associated with the development of asthma in a human birth cohort (Arrieta et al., 2015), a finding that is in line with the hygiene hypothesis (Strachan, 1989). Newborn children are also susceptible to infections, especially when born preterm, but the basis for this is not fully understood (Kollmann et al., 2017). Clearly further investigation on immune system development in human children is warranted for us to better protect newborn children from infections, develop more efficient vaccines, and reduce the burden of immune-mediated diseases occurring later in life (Laforest-Lapointe and Arrieta, 2017). Longitudinal analyses of immune system development in human newborns have been hampered by (1) a difficulty in obtaining blood samples from healthy children and (2) technical limitations in extracting sufficient amounts of information from the small blood volumes obtainable.
Systems immunology analyses allow for many simultaneous measurements to be made in a given sample, allowing the variation between individuals to be taken into account and used in order to make new discoveries directly in human cohorts (Davis and Brodin, 2018, Tsang, 2015). By such systems-level analyses, coordinated changes between cells and proteins also can be appreciated and regulatory principles inferred (Kaczorowski et al., 2017, Brodin and Davis, 2017). Human systems immunology analyses have now revealed not only large interindividual variation in immune cells and in protein composition (Gaucher et al., 2008, Nakaya et al., 2015, Querec et al., 2009, Sobolev et al., 2016) but also a stability of phenotypes within individuals over the course of weeks to months (Carr et al., 2016, Tsang et al., 2014), and even a few years (Shen-Orr et al., 2016). Most of the overall interindividual variation found among healthy individuals is attributable to environmental factors (Brodin et al., 2015), but at which point such exposures shape our immune systems is not well understood.
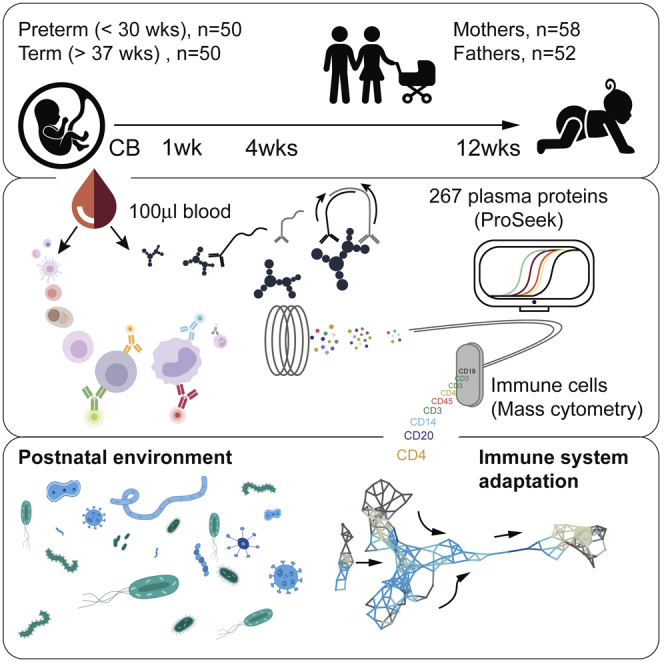
Here, we report on a longitudinal, systems-level analysis of immune system development in 100 human newborns, followed with up to four blood samples during the first 3 months of life. Using as little as 100 μL of blood as starting material, we analyze the development of all major immune cell populations by mass cytometry and 267 plasma proteins by immunoassays, providing a systems-level overview of immune system adaptation to postnatal life (Figure 1A). These data reveal drastic changes across immune components after birth, following a stereotypic pattern shared by all children, but not predictable from cord blood measurements. The cell and protein changes occurring imply interactions with microbes as important, and, in a subset of children with gut bacterial dysbiosis, stereotypic immune system development is hampered.
Figure 1.

Preterm and Term Children Differ at Birth
(A) Blood samples of 100 newborn children and their parents were collected at up to four different time points during the first months of life. Plasma protein concentrations were measured by ProSeek, and immune cells were analyzed by mass cytometry.
(B) Median protein concentrations in cord blood of term and preterm children. Differently regulated proteins (false discovery rate [FDR] < 0.01) are marked in blue.
(C) Intersample differences between cord blood samples from preterm and term children were visualized by multidimensional scaling (MDS).
(D) Gestational age at birth for preterm and term children and preterm children at 3 months postnatal age.
(E and F) Interindividual distances between term and preterm children at birth (gray) or term children at birth and preterm children at 3 months after birth (blue). Interindividual distances separately calculated for plasma proteins (E) (Euclidian distance) and cell composition (F) (Aitchison’s distance). Error bars represent ±1.5 IGR above and below Q1 and Q3, respectively.
Results
Systems-Level Immune Analyses in Newborn Children
We first established a sample processing protocol that was easy to use directly in delivery and neonatology departments without the presence of dedicated research staff. This procedure involves an immediate stabilization and freezing of whole blood samples to minimize cell loss and sample decay. To allow studies in very preterm and term children alike, we had to optimize our protocols to work with as little as 100 μL of blood as starting material (STAR Methods). We designed a mass cytometry panel with 38 antibodies targeting activation and differentiation markers across all white blood cell populations and profiled a total of 95,278,466 immune cells from 337 blood samples in total. Plasma protein analyses using ProSeek (Olink, Uppsala, Sweden), a sensitive dual-recognition immunoassay (Assarsson et al., 2014, Lundberg et al., 2011), allowed the quantification of 267 unique proteins in < 20 μL of plasma in (Figure 1A). In a subset of children, we also performed transcriptome analyses at weeks 1 and 12 in order to interrogate gene expression changes occurring after birth.
We enrolled 100 newborn children, born at the Karolinska University Hospital between April 2014 and July 2017, and collected up to four longitudinal blood samples at birth (cord blood) and weeks 1, 4, and 12 of life. A few children were also sampled later around 6 months of life (Figure 1A). We sampled the blood of mothers and fathers for comparison, and the cohort included children delivered very preterm (<30 weeks of gestation; n = 50) or term (≥37 weeks of gestation; n = 50), but excluded children with known organ malformations or congenital disorders (STAR Methods). The early-life environmental conditions were vastly different between the groups, with preterm children experiencing long initial hospital stays (median = 65 days), frequent antibiotic exposures, and an increased rate of infections and inflammatory complications. Term children were all healthy at birth and left the hospital after a few days without receiving antibiotics.
Preterm Birth Is Associated with a Strong Inflammatory Response
Preterm delivery is often triggered by an inflammatory process related to premature cervical ripening, premature rupture of membranes and infections such as chorioamnionitis. To compare immune system states in preterm and term children at birth, we analyzed plasma protein concentrations in cord blood samples. A strong pro-inflammatory signature characterized cord blood immune systems of children delivered very preterm, with high expression of chemokines CXCL11, and the principal effector chemokine of newborn T cells, interleukin-8 (IL-8) (CXCL8) (Gibbons et al., 2014) (Figure 1B). Term children had high levels of the adipokine leptin, reflecting their higher fat depots accumulated during the final trimester (Figure 1B). When taking all 267 plasma proteins into account, preterm and term delivered children segregated completely (Figure S1A). When analyzing relative proportions of 21 canonical immune cell populations (STAR Methods), we found that cell compositions significantly differed between preterm and term children (Figure 1C), a difference mostly attributed to a lower neutrophil proportion in preterm correlating with gestational age (Figure S1B). The preterm and term children differed ∼3 months in gestational age at birth (Figure 1D), and we reasoned that some of the differences seen could be attributed to this difference in maturity. If so, it’s predicted that phenotypic distances between preterm and term children would decrease as preterm children mature to a gestational age comparable to term children at birth (Figure 1D). We calculated interindividual distances between cell and protein profiles of term children at birth and preterm-delivered children, either at birth or at 3 months of postnatal age, but instead of converging, immune profiles of 3-month-old preterms were even more dissimilar to those of term delivered children at birth (Figures 1E and 1F). These findings suggest that maturation alone cannot explain differences between preterm and term children at birth. Instead, these differences are likely multifactorial and associated with perinatal conditions causing the preterm delivery to occur. Divergence after birth also implies significant adaptive changes occurring in response to postnatal environmental exposures.
Figure S1.

Cord Blood Immune Parameters in Preterm and Term Children, Related to Figure 1
(A) Principle component analysis of plasma protein concentrations in cord blood of term (blue) and preterm (pink) children.
(B) Neutrophil levels as a fraction of all white blood cells in cord blood in relation to gestational age at birth. A linear regression curve is fit to the data (blue line) together with a confidence interval (light blue shade).
Cord Blood Measurements Are Not Predictive of Postnatal Immunity
Most existing data on immune systems in newborn children stem from cord blood measurements, and we decided to investigate how well such measurements would predict postnatal immune system states. We calculated correlation coefficients between cord blood and week 1 (median, day 3) measurements and found that the frequency measurements of only 6 of 21 immune cell correlated strongly compared with a nonsense correlation between randomly chosen samples from different children (Figure 2A).
Figure 2.

Cord Blood Is Not Representative of Postnatal Immunity
(A) Pearson’s correlation coefficients of immune cell frequencies in cord blood versus 1-week blood (gray), nonsense control correlation between random samples (black), and significantly different features (orange). Error bars represent confidence intervals.
(B) Intersample differences between cord blood samples, as well as peripheral blood samples collected on the day of birth and the following days, visualized by MDS. Sampling day is indicated. CB, cord blood. MDS coordinates are based on pairwise Aitchison’s distances (cell composition).
(C) Pearson’s correlation coefficients of plasma protein concentrations in cord blood versus 1-week blood (gray nonsense control correlation between random samples (black) and significantly different features (orange). Error bars represent confidence intervals.
(D) bhSNE embedding of indicated cells in blood samples from two consecutive weeks in an adult.
(E) bhSNE maps of immune cell phenotypes in cord blood and week 1 from a newborn.
(F) Pairwise Jensen-Shannon (JS) distances between bhSNE embeddings for all time points from adult samples (gray) and for cord blood versus 1-week newborn samples (orange). p values for comparisons of the mean distances between groups.
See also Figure S2.
This lack of predictability was not only due to inherent tissue differences between cord blood and peripheral blood. In seven children with available peripheral blood samples on the day of birth (day 0), the immune cell compositions differed from week 1 samples (Figure 2B). In two children we obtained cord blood samples (day 0 peripheral blood samples and week 1 samples), which were all different, implying that both tissue differences between cord and peripheral blood and continuous changes occurring after birth explain the inability of predicting postnatal immune systems from cord blood measurements (Figure 2B). Of 81 plasma proteins with well-known immune function (STAR Methods), only one protein, TNFRSF13B, could be predicted from cord blood in the first week of life (Figure 2C). This lack of correlation between cord blood and postnatal samples was not caused by technical variability in the experimental assays used, as correlations between longitudinal samples from healthy adults (n = 100) strongly correlated between time points (Figures S2A and S2B).
Figure S2.

Over Time Stability of Immune Parameters in Healthy Adults, Related to Figure 2
(A and B) Pearson’s correlation coefficients of immune cell frequencies (A) and plasma protein concentrations (B) between two peripheral blood samples taken 3 months apart in a cohort of 100 healthy individuals. Included is also a nonsense control correlation between random samples (black). Cell populations (A) or plasma protein concentrations (B) that are significantly correlated compared to control samples are indicated in blue.
Apart from estimating immune cell composition, mass cytometry analyses also allow for studies of phenotypic changes within each cell population. We used Barnes-Hut SNE (bhSNE) (van der Maaten, 2013, Shekhar and Brodin, 2013) to reduce the dimensionality of single-cell data and visualize two-dimensional embeddings of cells at consecutive time points (STAR Methods). We first sampled healthy adults at two consecutive weeks and found stable phenotypes of all cell populations (Figure 2D). In contrast, when comparing cord blood and week 1 samples from newborn children, we found that immune cell phenotypes were markedly different between time points (Figure 2E). To quantify phenotypic differences, we calculated Jensen-Shannon (JS) distances between cell distributions from consecutive time points, embedded together using bhSNE. This confirmed the stability of adult phenotypes (n = 3) between time points, whereas newborn children (n = 45) had significantly higher phenotypic distances between cord blood and week 1 (Student’s t, p < 2.5 ×10⁻¹⁴) (Figure 2F). We conclude that drastic changes in cell composition, plasma protein concentrations, and, even, cell phenotypes that cannot be predicted from cord blood measurements already occur during the first few days of life. This finding highlights the need for more longitudinal analyses in young children in order to understand postnatal immune development and immune system states early in life.
A Topological Parameter Landscape Reconstructs Immune System Development
Systems-level analyses allow for coregulated cells and proteins to be revealed, but this requires that such heterogeneous data are integrated. Topological data analysis (TDA) provides one method for such integrated analyses and visualization of heterogeneous data types (Lum et al., 2013), such as cell frequencies, protein concentrations, and clinical metadata (Lakshmikanth et al., 2017). We applied TDA to visualize the systems-level changes across all measured immune parameters early in life, and to allow the exploration of these changes in relation to metadata such as gestational age. From 202 blood samples (parents excluded), we integrated 48 non-negative immune cell population frequencies identified by an unsupervised clustering algorithm (Weber and Robinson, 2016) (STAR Methods), and 250 plasma proteins with variable concentrations (STAR Methods). After scaling each measurement to unit variance, we used Pearson correlation as a distance metric between samples and neighborhood lenses to generate a kth nearest neighbor (KNN) graph for visualization purposes (STAR Methods) (Lum et al., 2013). This analysis yielded a parameter landscape that reconstructs immune system development in an unsupervised manner (Figure 3A). Nodes in this network represent sets of correlated samples; each sample can occur in multiple nodes, and edges connect nodes sharing at least one sample. We colored nodes by average day of life, and, in doing so, a time trajectory from left to right can be seen (Figure 3A). Notably, cord blood samples formed a discrete cluster, emphasizing the discrete nature of cord blood and postnatal immune systems.
Figure 3.

Topological Data Analysis Reveals Systems-Level Convergence of Term and Preterm Immune Systems during the First Weeks of Life
(A) A parameter landscape model by topological data analysis (TDA) using frequencies of 48 cell populations and 250 plasma protein concentrations from 202 samples of newborn children (37 cord blood, 68 week-1, 38 week-4, and 59 week-12 samples). Each node in the network represents a set of correlated samples; each sample can be included in multiple nodes; and nodes sharing at least one sample connected with an edge. The network is colored by the average sampling day of its samples.
(B) Nodes colored by the proportion of samples from term and preterm children.
(C and D) Differences in immune cell frequencies (C) and plasma protein concentrations (D) between preterm and term children separated into different age groups.
(E) Principal component analysis of mRNA-seq transcripts per kilobase million (TPM) values from preterm (n = 4) and term (n = 4) children sampled at weeks 1 and 12 and two adult control samples.
(F) Differential expression analysis of RNA-seq data between preterm and term children at 12 weeks. GO terms are listed for genes significantly upregulated in preterm versus term children.
See also Figure S3.
Convergence of Preterm and Term Immune Systems after Birth
The overall distribution of samples in the parameter landscape had a branched structure with two branches representing different immune system states early in life, and these branches mapped to preterm and term-delivered children when colored by gestational age at birth (Figure 3B). The parameter landscape summarizes features of early life immune system development. What the model also suggests is that immune systems of preterm and term children evolve along one shared trajectory after birth (Figure 3B) with 3-month samples intermixed in a dense region of the parameter landscape (Figure S3A). There were no significant differences in developmental patterns between boys and girls (Figures S3C and S3D) or by season (Figures S3E and S3F). This stereotypic development shared by preterm and term children was surprising given that several preterm children remained in the hospital for the entire study period and thus existed in an environment very different from that of the families that had returned home weeks to months earlier.
Figure S3.

Global Immune System Development in Relation to Metadata, Related to Figure 3
(A) TDA network landscape from Figure 3A showing the number of samples included in each node of the network.
(B) The same network as in (A) and colored by the proportion of samples in the node taken from children delivered by cesarean section or vaginal delivery respectively.
(C) PCA analysis of plasma protein showing PC1 (x axis) and PC2 (y axis) and individual samples colored by sex.
(D) MDS analysis of cell composition showing component 1 (x axis) and 2 (y axis) and individual samples colored by sex.
(E) PCA analysis of plasma protein showing PC1 (x axis) and PC2 (y axis) and individual samples colored by season of sampling.
(F) MDS analysis of cell composition showing component 1 (x axis) and 2 (y axis) and individual samples colored by season of sampling.
The convergence of preterm and term immune systems was mostly explained by changes in neutrophil frequencies and frequencies of naive CD4+ T cells, which were already comparable between the groups during the first few weeks of life, suggesting a reversal of initially different phenotypes between preterm and term children (Figure 3C). In a few preterm children, late onset septicemia caused transient neutrophil expansion. Plasma protein changes also contributed to preterm/term convergence, especially changes in leptin and IL-8, which converged during the first month of life (Figure 3D).
To further investigate differences between preterm and term immune systems after birth, we performed mRNA sequencing (mRNA-seq) of viable peripheral blood mononuclear cells (PBMCs) from four preterm and four term-delivered children at weeks 1 and 12. Also, at the transcriptome level, large-scale changes occurred between these time points in both preterm and term children, and the groups were largely intermixed (Figure 3E). However, notable gene expression differences that persisted at 12 weeks after birth and distinguish preterm children from term children also could be seen. We analyzed gene ontology (GO) terms associated with such differentially regulated genes and found that preterm children overexpressed genes involved in the negative regulation of interferon-gamma (IFNγ) production and T cell proliferation, as well as genes associated with IL-10 secretion, highlighting multiple important pathways that can potentially explain differences in infectious disease susceptibility between preterm and term children (Sharma et al., 2012) (Figure 3F). Mode of delivery can affect the composition of pioneer microbes colonizing newborns after birth (Dominguez-Bello et al., 2010). We found that children born by vaginal and cesarean delivery were also intermixed at 3 months of age. A larger and a more balanced cohort of children will have to be analyzed in order to investigate possible differences in immune development associated with mode of delivery (Figure S3B).
Stereotypic Changes in Immune Cell Composition after Birth
Newborn immune system parameters were dynamic over time as illustrated by higher coefficients of variance (CVs) for 21 manually gated cell populations in newborn children as compared to healthy adults sampled at the same intervals. All cell populations were more variable in newborns than in adults, and preterm and term children varied similarly over time (Figure 4A). For each cell population, we fit an ANOVA model and decomposed the total sums of squares into interindividual variation (R2 explained by subject ID), and intraindividual variation (residual R2) (STAR Methods). In contrast to adults (Carr et al., 2016, Shen-Orr et al., 2016, Tsang et al., 2014), newborn immune cell populations exhibit a lot more intraindividual variation (Figures S4A and S4B) also emphasizing the dynamic nature of newborn immune systems as compared to adults.
Figure 4.

A Patterned Progression in Immune Cell Composition
(A) The coefficient of variance (CV) for 21 gated cell populations in healthy adults (n = 3), preterm (n = 29), and term (n = 15) children.
(B) The relative proportions of 10 cell populations in 183 postnatal blood samples from 57 children ordered by sampling day of life.
(C) Composition of immune cell clusters analyzed using self-organizing map clustering of the B cell population.
(D) The B cell cluster #6 on a bhSNE analysis of total B cells and relative CD38, CD9, and CD24 expression.
(E) The relative frequency of cluster B #6 over time in children. Shaded area represents the confidence interval around the mean.
(F) Frequency of cluster B #6 in parents.
See also Figure S4.
Figure S4.

Immune Cell Population Variance Early in Life, Related to Figure 4
(A and B) The relative contribution to the total variance of inter- and intra-individual variance for 24 immune cell populations in newborn children (A) and healthy adults (B).
(C–G) Composition of immune cell clusters analyzed separately using self-organizing map clustering, within CD4+ T cells (C), CD8+ T cells (D), NK-cells (E), neutrophils (F), and monocytes (G).
(H) The Monocyte cluster #8 is highlighted in a bhSNE map within total CD14+ monocytes and the relative expression of CD14, HLA-DR and CD31 is highlighted.
(I and J) The relative frequency of cluster M #8 over time in children (I), and (J) parents.
To compare the progressive changes in immune cell composition among all children, we analyzed relative abundances of 10 key immune cell populations in cord blood samples (n = 52) and postnatal samples (n = 131) from all 100 children in our cohort. Cord blood samples were heterogeneous without clearly shared patterns. In contrast, postnatal samples ordered by day of life revealed a stereotypic change in cell composition over time (Figure 4B). This involved a gradual reduction in neutrophils from birth, concomitant with an increase in CD4+ and CD8+ T cell proportions (Figure 4B). Monocytes expanded transiently after birth and subsequently contracted from 1 month, followed by an increase in B cell abundance from 1 month onward (Figure 4B).
Subpopulations of cells within major cell lineages display similar stereotypic changes (Figures 4C and S4C–S4G). As an example, B cell population #6 had a high expression of CD38, CD24, and CD9, indicative of an immunoregulatory function, and this population was abundant in cord blood but contracted rapidly after birth (Figures 4D and 4F). Similarly, monocyte cluster #8, with a phenotype reminiscent of myeloid-derived suppressor cells (MDSCs) (Leiber et al., 2017, Rieber et al., 2013), in newborns contracted to frequencies similar to those of parents (Figure S4G). These examples suggest that such suppressive immune cell populations that previously have been shown to be abundant in cord blood might be less important inhibitors of postnatal immune responses than previously suggested. Collectively, these results show that immune cell compositional changes after birth follow a stereotypic pattern of development in all children, preterm and terms alike, despite their differences in both maturity and postnatal environmental conditions.
Critical Period of Development Differing between Immune Cell Populations
Cell frequencies and protein concentrations change in the parameter landscape along a shared trajectory. When maternal samples are included as an adult reference, the differences between newborn immune states and their mothers are seen at all time points, suggesting that additional exposures and adaptive changes are required to reach an adult-like immune state (Figure 5A). Epidemiological evidence has suggested that the first 3 months represents a critical period of immune development during which environmental exposures can have long-term consequences for immune-mediated diseases such as allergies and asthma (Arrieta et al., 2015). We hypothesized that such influences might perturb the phenotypic development of individual cell populations, and we decided to compare immune cell phenotypes in newborn children over time to parental cell phenotypes. We reasoned that if newborn immune cell phenotypes would reach adult-like phenotypes during the first 3 months of life, this would suggest a critical period in their development during which environmental exposures could have long-term consequences.
Figure 5.

Phenotypic Development of Immune Cell Populations
(A) TDA network landscape with maternal and newborn samples combined.
(B) bhSNE-maps of five cell populations from one child (orange) and its parents (gray).
(C) JS distances between phenotypes in each child and its parents separately calculated and plotted against gestational age (days) at the time of sampling. Linear regression curves with confidence intervals are shown, and R2 values and p values for each correlation.
(D) Boxplots of the JS distances for cell phenotypes between coparents. Error bars represent ±1.5 IGR above and below Q1 and Q3, respectively.
Cell phenotypes from different time points stained and acquired together from a given child and its parents were visualized together in a two-dimensional reduced space using bhSNE (STAR Methods). In one example, samples 6 months apart from one young child and corresponding parental samples revealed notable patterns. First phenotypes of maternal and paternal cells were very similar as compared to newborn cells. Naive CD4+ and CD8+ T cell phenotypes in newborns showed no sign of converging with parental phenotypes during the study period, while naive B, natural killer (NK), and dendritic cells (DCs) did (Figure 5B). We quantified these phenotypic distances among all families and confirmed the development of adult-like phenotypes for naive B, NK, and DCs, but not for T cell populations (Pearson’s correlation < −0.17, p < 0.05) (Figures 5C and 5D). Monocyte phenotypes were comparable between children and parents already at birth (Figures 5C and 5D). We conclude that phenotypic transitions toward parental-like phenotypes follow a stereotypic sequence that differ between cell types and that the first 3 months of life seems to be a critical period during the development of B, NK, and DCs, implying that environmental influences imprinting on these cells during the first 3 months could have long-term consequences for the individual’s immune system.
Immune Parameter Changes Imply Microbial Interactions as Important During Development
Given the stereotypic changes in cell composition, protein concentrations, and cell phenotypes above, we wanted to investigate the specific influences that could drive this development. First, we subdivided the immune parameter landscape into five discrete developmental stages (Figure 6A). We calculated interindividual distances between immune cell and protein profiles at each of these stages showing a progressive convergence of phenotypes, underscoring the stereotypic nature of the developmental process (Figures 6B and 6C). To interpret individual features changing at each stage of development, we compared distributions of individual cell populations and proteins using Kolmogorov-Smirnoff (KS) tests (Table S1). We find that regulatory cytokines IL-27 and IL-10 are abundant in cord blood and decreased after birth (Figure 6D), much like the regulatory cell populations described above. Around 1 month of life these regulatory cytokines increased again, possibly as a way to balance induced immune responses to environmental factors (Figure 6D). The Fc receptor, PIgR transports immunoglobulin A (IgA) antibodies across epithelial cells onto luminal surfaces and is induced by microbial products on these luminal surfaces (Kaetzel, 2005). We found increased PIgR expression specifically from stage four and onward (Figure 6E). Further supporting the notion that interactions with microbes are important were the elevated levels of IL-8, IL-17A, and IL-12B during stages 4–5 (Figure 6F), and multiple cell population changes. One notable example was an expanded population of CD8+ T cells expressing the CD161 receptor, likely representing a mucosal-associated invariant T (MAIT) cell population (Figures 6G and 6H), known to be involved in responses to bacteria on mucosal surfaces (Wong et al., 2017).
Figure 6.

Immune Parameter Changes during the First Weeks of Life
(A) The TDA parameter landscape subdivided into five developmental stages.
(B and C) Interindividual distances for plasma protein profiles (B) (Euclidean) and cell composition (C) (Atchinson’s) across the five stages.
(D) Plasma concentration (log2 NPX) of cytokines IL-27 and IL-10.
(E) Plasma concentration (log2 NPX) of PIgR.
(F) Plasma concentration (log2 NPX) of IL-8 (CXCL8) and cytokines IL-17A and IL-12B.
(G) The frequency of CD8+ T cell cluster #1 as a fraction of all cells.
(H) bhSNE plots showing cluster localization among CD8+ T cells and CD3, CD8a, CD161, and CD38 expression. All p values from KS tests comparing distributions of stages 2–3 combined versus stage 5.
(I) Differentially regulated genes week 12 versus week 1 associated with the GO: positive reg. of immune system process. Genes ordered by absolute log2 (week 12/week 1) (x axis) and actual log2 (week 12/week 1) (y axis).
Transcriptome analyses on weeks 1 and 12 reveal massive changes across a wide range of pathways (Figures 6I and S5). Many of the changes involve metabolic pathways, but some important immune system processes were also found, and most upregulated genes were major histocompatibility complex (MHC) class II genes (HLA-DRA and -DQB1) induced by IFNγ upon microbial stimulation (Mach et al., 1996). Collectively, these findings suggest that responses to microbes, especially at mucosal surfaces, are possible drivers of the stereotypic immune systems development in newborn children during the first few weeks of life.
Figure S5.

Differentially Regulated Transcriptional Programs between Weeks 1 and 12 after Birth, Related to Figure 6
Gene ontology terms in week 12 versus week 1 from RNaseq-data between. GO-terms for genes significantly different week 12 versus week 1 are shown and divided by gene set overall direction of differential regulation; up only, down only, mixed, mostly up, mixed mostly down and unidirectional.
Early Dysbiosis in the Gut Microbiome Affects Immune System Development
To better understand microbe-immune interactions in newborn children, we performed 16S rRNA profiling of fecal samples (n = 95) from 45 of the children in our cohort at weeks 1, 4, and 12 of life. Principal coordinates analysis using UniFrac distances revealed a progressive change in fecal microbiome composition over time (Figure 7A) (La Rosa et al., 2014). The diversity of these fecal microbiomes increased over time after birth, but in a few children the diversity during the first 50 days was exceptionally low indicating bacterial dysbiosis (Figure 7B). In these children, near-complete dominance of the gut microbiome by bacterial classes Bacilli or Gammaproteobacteria was seen (Figure 7C). The children with early gut dysbiosis had more circulating endothelial cells, activated T cell populations and higher levels of the pancreatic exopeptidase CPA1 in their subsequent 3-month blood samples (Figures 7D–7F). When analyzing interindividual distances at 3 months of life, we found that children experiencing early gut dysbiosis were more heterogeneous, a finding that again suggests that the stereotypic developmental trajectory is perturbed in children experiencing early dysbiosis (Figure 7G). We conclude from these findings that interactions with microbes colonizing newborn children during the first weeks of life are seemingly important, and perturbation to this process of colonization is associated with perturbations to the stereotypic immune system developmental early in life.
Figure 7.

Immune System Development and Gut Bacterial composition
(A) Principle coordinate analysis of bacterial composition in fecal samples (n = 95) collected at 1, 4, and 12 weeks of age in newborn children (n = 45).
(B) Shannon α diversity in each sample and age at sampling. Individuals are divided into normal (purple, Shannon α > 0.3) and dysbiotic cases (orange, Shannon α < 0.3).
(C) Bacterial class abundances in week 1 samples with normal and dysbiotic gut microbiome.
(D) Bacterial class composition across fecal samples grouped by week of life and ordered within groups by PCoA2. Shaded area represents confidence interval around the mean.
(E) Cell frequencies as log2(dysbiosis/normal) at 12 weeks, ranked by log2ratio. Top four highlighted and named.
(F) Plasma protein concentrations as log2ratio (dysbiosis/normal) at 12 weeks, ranked by log2ratio. Top five highlighted and named.
(G) Pairwise interindividual Aitchison’s distances between immune cell compositions at 12 weeks within the dysbiosis group (orange) and normal group (purple). Error bars represent ±1.5 IGR above and below Q1 and Q3, respectively.
(H) One hypothetical adaptive change within state space induced by a single input.
(I) Adaptation to the same stimuli is constrained when partially opposed by a second simultaneous input.
(J) Convergence of diverse immune systems in state space by a large number of simultaneous inputs inducing opposing adaptive responses.
Discussion
The finding that children of different levels of maturity and postnatal environmental conditions converge on a shared developmental trajectory early in life was unexpected to us. One possible explanation is that antigenic exposures shared by all children drive this development. At the same time, gut microbiome composition differed between children, and the likelihood of shared exposures across such a diverse group of children seems unlikely. Another possible explanation is that some other physiological process, shared by all children, triggers the stereotypic immune system development, but the changes seen implicate interactions with microbes. These findings led us to hypothesize a possible model for stereotypic adaptive changes to diverse environmental exposures.
This model is based on the assumption that a single input sensed by the immune system will elicit a stereotypic adaptive response by the immune system (Figure 7H). In contrast, two simultaneous inputs, with partially opposing effects, will each induce adaptation, but also constrain the adaptive responses to the other simultaneous input (Figure 7I). If the number of simultaneous and diverse inputs is sufficiently large, the number of possible phenotypes decreases, and convergence of initially diverse immune systems is predictable (Figure 7J). This model does not require inputs to be identical, as long as the number of simultaneous inputs is sufficiently large and give rise to different adaptive responses. We propose this model of immune system adaptation to environmental influences to explain the developmental changes, shared by diverse children and following a stereotypic pattern during the first weeks of life. Collectively, these findings highlight the reactive nature of the human immune system with implications, not only for our understanding of newborn immune systems, but also for our understanding of human immune system variation in general and how this is shaped by environmental influences. We also propose that in-depth analyses during early life adaptation to environmental influences provides a unique opportunity for better understanding the molecular mechanisms of immune system adaptation to environmental influences in humans.
Recent systems-level analyses in humans have shown that environmental influences explain most of the overall variation among healthy individuals (Brodin et al., 2015, Orrù et al., 2013, Patin et al., 2018, Roederer et al., 2015) and that such environmental influences from infections, vaccines, nutrition, and the microbiome exert a cumulative influence over the course of life (Brodin et al., 2015, Kaczorowski et al., 2017). This is also reflected in an increased similarity of individuals sharing household (Carr et al., 2016). The increased divergence of human immune systems with age predicts that cord blood samples would more homogeneous with respect to their immune phenotypes than postnatal samples given the more limited exposure before birth. Here, we show that cord blood phenotypes are, in fact, highly diverse and, instead of diverging after birth, converge onto a shared developmental path during the first weeks of life. This converged 3-month immune system state might therefor represent the real set point from which human immune system variation is shaped by environmental exposures over the course of life.
We also describe evidence of a critical period in the development of B, NK, and DCs during the first 3 months of life, as these cell populations reach adult-like phenotypes during this period, suggesting that environmental influences imprinting on these cells during this time window could have long-term consequences. Such long-term consequences of early life exposures are suggested to be important determinants of future risk of immune-mediated diseases in recent epidemiological analyses (Arrieta et al., 2015). In line with this, colonization with Helicobacter pylori has been shown to be protective of asthma and other inflammatory conditions, as its presence influences DC maturation toward a more tolerogenic state (Oertli and Müller, 2012). If microbial stimuli present during the first 100 days have similar effects on DC development, this might establish an individual’s DCs on a trajectory associated with reduced disease risk. T cell populations showed no signs of convergence with parental cells during the first 100 days in our study, and longer follow-up times will be needed to understand whether and when such periods might occur for T cell populations. This also suggests that specific cell populations and pathways have different critical periods of calibration when they would be most amenable to environmental imprinting, allowing specific exposures at specific time points in the context of a given genetic makeup to contribute to an individual’s risk of individual immune-mediated diseases.
The finding that all children in our cohort converged similarly might seem at odds with known interindividual differences in disease susceptibility. In this respect, it is important to consider that infectious disease susceptibility is a complex trait, influenced by immunological, epidemiological, and physiological factors. Moreover, even if the convergence of phenotypes illustrates an adaptation of the immune system, this does not necessarily translate into identical functional responses. Further studies will be required to investigate functional differences during the different stages of the stereotypic development and the regulatory, possibly epigenetic, adaptations underlying this process.
The ability to adapt to environmental influences was shared by the children in our cohort, and we argue that this represents an extreme example of a process that is ongoing all the time, in all individuals, as our immune systems interact with internal and external environments and adapt to them. Although all 100 children behaved similarly here, it is possible that a larger cohort would identify individuals who do not conform in the same way or have subtle variations in this process. An inability to adapt also could be a determinant of immune-mediated disease. Elegant population genetics studies have revealed traits, conferring protection from infectious disease and selected for throughout evolution, but in our modern environmental context being associated with an increased risk of immune-mediated diseases (Quach and Quintana-Murci, 2017, Brinkworth and Barreiro, 2014). Additional examples of the importance of immune adaptation to environmental inputs come from children with rare, monogenic disorders presenting with life-threatening primary infections (Alcaïs et al., 2010) that in some cases improve with age (von Bernuth et al., 2008, Ku et al., 2007). This reduced risk of severe disease with age could be a result of immune adaptation to environmental influences conferring added robustness to the system.
This study has several weaknesses. First, the direct fix and freeze strategy for preserving blood samples for mass cytometry analyses was unfortunately not compatible with any of several tested clones targeting either αβ T cell receptors (TCRs) or γδ TCRs on T cells, preventing us from distinguishing these subsets of T cells. γδT cells have been reported to be abundant and important for providing protection to newborn children (Gibbons et al., 2009). Similarly, this protocol also prevented us from reliably detecting regulatory T cells, because the FoxP3 transcription factor could not be detected in fixed/frozen cells. Recent results indicate that the developing immune system in prenatal life is fully functional, but actively suppressed (Elahi et al., 2013, Zhang et al., 2017) and that regulatory T cells are important mediators of this suppression (McGovern et al., 2017, Mold et al., 2008). Because most of the conclusions presented stem from global signatures across measurements, they are robust to these technical limitations in detecting individual cell populations.
All in all, we have reported on a longitudinal, systems-level analysis of the immune systems in newborn children that provide new insights into the dynamics of immune cells and proteins early in life and illustrate the reactive nature of human immune systems, particularly in response to the myriad of microbial exposures at birth and early thereafter. These findings have implications for researchers striving to understand the unique state of immune systems in newborn children, their susceptibility to infectious diseases (Bhutta and Black, 2013), and how to protect such children by developing better vaccines tailored to newborn immune systems (Amenyogbe et al., 2015). These findings also have implications for our general understanding of human immune system variation, early-life imprinting by environmental exposures, and the development of immune-mediated diseases later in life.
STAR★Methods
Key Resources Table
| REAGENT or RESOURCE | SOURCE | IDENTIFIER |
|---|---|---|
| Antibodies | ||
| CD45 (HI30) – 89Y | Fluidigm | Cat# 3089003B; RRID:2661851 |
| CD57 (HCD57) – Purified | Biolegend | Cat# 322302; RRID:AB_535988 |
| CD19 (HJIB19) – 142Nd | Fluidigm | Cat# 3142001B; RRID:AB_2651155 |
| CD5 (UCHT2) – Purified | Biolegend | Cat# 300602; RRID:AB_314088 |
| CD16 (3G8) – Purified | Biolegend | Cat# 302002; RRID:AB_314202 |
| CD4 (RPA-T4) – 145Nd | Fluidigm | Cat# 3145001B; RRID:AB_2661789 |
| CD8a (SK1) – Purified | Biolegend | Cat# 344702; RRID:AB_1877104 |
| CD11c (Bu15) – 147Sm | Fluidigm | Cat# 3147008B; RRID:AB_2687850 |
| CD31 (WM59) – Purified | Biolegend | Cat# 303102; RRID:AB_314328 |
| CD193/CCR3 (5E8) – Purified | Biolegend | Cat# 310702; RRID:AB_345394 |
| CD64 (10.1) – Purified | Biolegend | Cat# 305002; RRID:AB_314486 |
| CD123 (6H6) – Purified | Biolegend | Cat# 306002; RRID:AB_314576 |
| CD21 (BL13) – 152Sm | Fluidigm | Cat# 3152010B |
| CD13 (WM15) – Purified | Biolegend | Cat# 301702; RRID:AB_314178 |
| CD3e (UCHT1) – 154Sm | Fluidigm | Cat# 3154003B; RRID:AB_2687853 |
| CD7 (CD7-6B7) – Purified | Biolegend | Cat# 343102; RRID:AB_1659214 |
| NKG2C (134591) – Purified | R&D | Cat# MAB138; RRID:AB_2132982 |
| CD9 (SN4 C3-3A2) – Purified | eBioscience | Cat# 14-0098-82; RRID:AB_657777 |
| CD45RB (MEM-55) – Purified | Biolegend | Cat# 310202; RRID:AB_314805 |
| CD22 (HIB22) – Purified | Biolegend | Cat# 302502; RRID:AB_2074593 |
| CD14 (M5E2) – Purified | Biolegend | Cat# 301802; RRID:AB_314184 |
| CD161 (HP-3G10) – Purified | Biolegend | Cat# 339902; RRID:AB_2661837 |
| CD29 (TS2/16) – Purified | Biolegend | Cat# 303002; RRID:AB_314318 |
| HLA-DR (L243) – Purified | Biolegend | Cat# 307602; RRID:AB_314680 |
| CD44 (BJ18) – Purified | Biolegend | Cat# 338802; RRID:AB_1501199 |
| CD127 (A019D5) – 165Ho | Fluidigm | Cat# 3166007B; RRID:AB_2661803 |
| CD24 (ML5) – Purified | Biolegend | Cat# 311102; RRID:AB_314851 |
| CD27 (L128) – 167Er | Fluidigm | Cat# 3167006B |
| CD38 (HIT2) – Purified | Biolegend | Cat# 303502; RRID:AB_314354 |
| CD45RA (HI100) – 169Tm | Fluidigm | Cat# 3169008B |
| CD20 (2H7) – Purified | Biolegend | Cat# 302302; RRID:AB_314250 |
| CD49d (9F10) – Purified | Biolegend | Cat# 304302; RRID:AB_314428 |
| IgD (IA6-2) – Purified | Biolegend | Cat# 348235; RRID:AB_2563775 |
| CD56 (NCAM16.2) – Purified | BD | Cat# 559043; RRID:AB_397180 |
| CD185/CXCR5 (51505) – Purified | R&D | Cat# MAB190; RRID:2292654 |
| CD244/2B4 (C1.7) – Purified | Biolegend | Cat# 329502; RRID:1279194 |
| CD39 (A1) – Purified | Biolegend | Cat# 328202; RRID: 940438 |
| CD11B (Mac-1) – 209Bi | Fluidigm | Cat# 3209003B; RRID:AB_2687654 |
| Biological Samples | ||
| Peripheral blood samples from newborns and parents | Karolinska University Hospital | N/A |
| Fecal samples from newborn children | Karolinska University Hospital | N/A |
| Chemicals, Peptides, and Recombinant Proteins | ||
| 1X PBS | Rockland | Cat# MB-008 |
| EDTA | Rockland | Cat# MB-014 |
| Na-Azide | Sigma-Aldrich | Cat# 71289 |
| Bovine Serum Albumin | Sigma-Aldrich | Cat# A3059 |
| Paraformaldehyde | Polysciences | Cat# 00380-1 |
| Intercalator-Ir | Fluidigm | Cat# 201192B |
| EQ Four Element Calibration Beads | Fluidigm | Cat# 201078 |
| Maxpar X8 Multimetal labeling kit | Fluidigm | Cat# 201300 |
| 20-Plex Pd Barcoding Kit | Fluidigm | Cat# 201060 |
| Metal isotopes as chloride salts | Fluidigm | N/A |
| RPMI 1640 medium | Sigma-Aldrich | Cat# R848 |
| Dimethyl Sulfoxide | Sigma-Aldrich | Cat# D8418 |
| Metal isotopes as chloride salts | Trace Sciences International | N/A |
| Protein Stabilizer PBS | Candor Bioscience GmbH | Cat# 131125 |
| Critical Commercial Assays | ||
| SmartTube Proteomic Stabilizer Kit | Fisher Scientific | Cat# NC0618275 |
| RNeasy Micro Kit | QIAGEN | Cat# 74004 |
| Agencourt Ampure XP beads | Beckman Coulter | Cat# A63880 |
| Nextera XT Sample Preparation Kit | Illumina | Cat# FC-131-1024 |
| MO BIO PowerFecal Kit | MO BIO Laboratories | Cat# 12830-50 |
| ProSeek INF I panel | Olink AB | INF I |
| ProSeek CVD II panel | Olink AB | CVD II |
| ProSeek CVD III panel | Olink AB | CVD III |
| Vacutainer CPT Tube | BD | Cat# 362753 |
| Test tube with 35 μm nylon mesh | Corning | Cat# 352235 |
| Whole Blood Cell Stabilizer Kit | Cytodelics AB | Cat# WBCS001 |
| Deposited Data | ||
| FCS files, Mass cytometry | This paper | http://flowrepository.org/id/FR-FCM-ZYKQ |
| Protein expression data | This paper | Mendeley data: https://doi.org/10.17632/ynhdrcxtcc.1 |
| 16S rRNA data | This paper | Mendeley data: https://doi.org/10.17632/ynhdrcxtcc.1 |
| Oligonucleotides | ||
| Forward primer rRNA sequencing: 5′-TCGTCGGCAGCGTCAGATGTGTATAA GAGACAGCCTACGGGNGGCWGCAG-3′ |
This paper | N/A |
| Reverse primer rRNA sequencing: 5′-GTCTCGTGGGCTCGGAGATGTGTATAA GAGACAGGACTACHVGGGTATCTAATCC-3′ |
This paper | N/A |
| Software and Algorithms | ||
| R 3.3.1 | R Core Team, 2016 | https://www.r-project.org/ |
| Mass Cytometry Normalizer | Finck et al., 2013 | https://github.com/nolanlab/bead-normalization/releases |
| Mass Cytometry Debarcoder | Zunder et al., 2015 | https://github.com/nolanlab/single-cell-debarcoder |
| sva 3.18.0 | N/A | http://bioconductor.org/packages/release/bioc/html/sva.html |
| robCompositions 2.0.5 | Templ et al., 2011 | https://cran.r-project.org/web/packages/robCompositions/index.html |
| kohonen 3.0.2 | Wehrens and Buydens, 2007 | https://cran.r-project.org/web/packages/kohonen/index.html |
| vegan 2.4-6 | N/A | https://cran.r-project.org/web/packages/vegan/index.html |
| cutadapt | http://cutadapt.readthedocs.io/en/stable/index.html | |
| ACCENSE 0.4.3 | Shekhar and Brodin, 2013 | http://www.cellaccense.com/ |
| Ayasdi platform | Lum et al., 2013 | https://www.ayasdi.com/ |
| Usearch | https://www.drive5.com/usearch/ | |
| pplacer | https://github.com/matsen/pplacer | |
| CyTOF software (v. 6.0.626) | https://www.fluidigm.com/ | |
| piano | https://bioconductor.org/packages/release/bioc/html/piano.html | |
Contact for Reagent and Resource Sharing
Further information and requests for resources and reagents should be directed to and will be fulfilled by the Lead Contact, Petter Brodin (petter.brodin@ki.se)
Experimental Model and Subject Details
Infant and Parental Samples
The study was performed in accordance with the declaration of Helsinki and the study protocol was approved by the regional ethical board in Stockholm, Sweden (DNR: 2009/2052 – 31/3 & 2014/921-32). After obtaining informed consent from parents, blood samples of newborns and parents were collected at the Karolinska University Hospital, Huddinge. Samples from 3 healthy adult controls, 100 children, 58 mothers, and 52 fathers were collected for the study. 12 blood samples were collected from the healthy adult controls, 285 samples from the children, and 156 samples from parents. Of the children, 49 were male and 51 were female. 51 children were born with cesarean section and 49 through vaginal birth, 50 children were delivered preterm (< 30 weeks gestational age at birth) and 50 were delivered at term (> = 37 weeks gestational age at birth). Gestational age at birth varied from 170 to 209 days in the preterm group and from 259 to 293 in the term group. Birth weight ranged from 458 to 1623 g in the preterm births and from 2838 to 4655 g in the term births. The mothers had a median age of 32 (range 20-43) and the fathers a median age of 35 (range 21-52). The healthy adult controls were of ages 26, 28, and 36.
Method Details
Sample Collection and storage
From children, about 100 μl whole blood was collected for mass cytometry analysis and mixed with either SmartTube proteomic stabilizer at a ratio of 1:1.4, or Cytodelics Whole Blood Cell Stabilizer at a ratio of 1:1, incubated in room temperature for ∼10 minutes and transferred to a −80°C freezer for long-term storage awaiting analysis. For mothers and fathers as well as cord blood samples, approximately 3ml of peripheral blood was collected. Plasma samples were obtained by centrifugation of blood samples at 2000 g and collection of supernatant.
Fecal samples were collected in plastic containers and stored at −80°C until use.
PBMCs were isolated using density gradient-based separation. 3-500 μl of blood was put in a BD Vacutainer CPT tube and centrifuged at 1600 g for 15 minutes followed by collection of buffy coat. Cells were frozen in freezing medium containing 50% RPMI, 30% FBS and 20% DMSO.
Thawing of stabilized Mass Cytometry Samples
Whole blood samples preserved in SmartTube solution were kept on ice for 15 minutes, followed by thawing in a water bath set to 20°C. Red blood cells were lysed by addition of SmartTube Lysis buffer #1 and incubated at 20°C for 10 minutes. The white blood cells were washed twice with CyFACS (1% BSA, 0.5% Na-Azide and 0.5M EDTA in PBS), filtered through a 35μm mesh and counted using a Bio-Rad TC20 cell counter.
Whole blood samples preserved in Cytodelics Whole Blood Cell Stabilizer were thawed at 20°C. Cytodelics Fix/Lyse buffer was added at a blood:buffer concentration of 1:10 and samples were incubated at 20°C for 5 minutes. Samples were then diluted 1:4 with Cytodelics Wash buffer #1 and left to lyse for 15 minutes. Cells were then washed twice with Cytodelics Wash buffer #2, filtered through a 35μm mesh and counted using a Bio-Rad TC20 cell counter.
Antibody Labeling
Purified monoclonal antibodies indicated in the Key Resource Table were either purchased pre-conjugated from Fluidigm or purchased in purified formulation and conjugated using the MAXPAR X8 polymer conjugation kit (Fluidigm Inc), according to the manufacturer’s protocol. Antibody concentration before and after conjugation was measured by NanoDrop 2000 spectrometer (Thermo Fischer Scientific, Waltham, MA) at 280nm and antibodies diluted 1:1 in Protein Stabilizer PBS (Candor Bioscience GmbH, Wangen Germany) prior to use.
Mass Cytometry Barcoding and Staining
A maximum of 2x10⁶ cells per sample were barcoded using six combinations of palladium isotopes (102Pd, 104Pd, 105Pd, 106Pd, 108Pd, 110Pd) with the 20-Plex Pd barcoding kit (Fluidigm). Cells were fixed for 10 minutes in 1mL of Fix I Buffer at room temperature, followed by two washes in 1 mL of Perm Buffer. Barcodes were resuspended in 100μl Perm Buffer, transferred to each sample and incubated for 30 minutes at room temperatures. All samples were then washed twice with CyFACS and then pooled. Cells were suspended in 150μl antibody cocktail per 107 cells and incubated for 30 minutes at 4°C. Antibodies used are listed in the Key Resources Table. After staining, cells were washed twice with CyFACS followed by overnight incubation in 4% formaldehyde diluted in PBS at 4°C.
Mass Cytometry sample acquisition
Iridium-labeled DNA-intercalator was added to cells in 4% formaldehyde for a final concentration of 0.125 μM and incubated for 20 minutes at room temperature. Cells were washed once in CyFACS, once in PBS and twice in milliQ H2O filtered through a 35μm nylon mesh and counted. Cells were diluted in milliQ H2O containing 10% EQ Four Element Calibration Beads to a concentration of 0.5 × 10⁶ cells/ml. Samples were acquired on one of two CyTOF2 mass cytometers, using noise reduction, event length limits of 10-150 pushes and a sigma value of 3. Cells were acquired at a flow rate of 0.045ml/min.
ProSeek data collection
Plasma protein data was generated using the proximity extension assay (ProSeek, Olink AB, Uppsala). Three panels of 92 proteins each were used to detect a range of biomarkers (Table S2). The data was generated in three batches of 88, 98, and 90 samples respectively, for a total of 276 samples. The method has been described previously (Assarsson et al., 2014). Briefly, paired oligonucleotide-coupled antibodies with overlapping sequences are allowed to bind in to proteins in the sample. When paired antibodies are brought in proximity to one another through binding to their target, their oligonucleotide sequences overlap to form a PCR target which can be quantified with real-time PCR.
RNA preparation and sequencing
Frozen PBMCs were thawed and live propidium iodide-negative cells were sorted using a BD Influx Cell Sorter (200μm nozzle, 3.1PSI, 6.05 kHz) in 1.0 drop purity mode. RNA was isolated using the RNeasy Micro Kit. Full-length cDNA synthesis and amplification from the polyA+ extracted RNA was carried out as in Picelli et al. (2014). After amplification, dsDNA was purified using Ampure XP beads and DNA tagmentation and amplification of adaptor-ligated fragments (dual-indexed) was then performed with Illumina Nextera XT DNA sample preparation kit. Samples were equimolarly mixed in two pools and sequenced in two HiSeq2500 lanes (High Output mode v4, PE 2x125bp) at Science for Life Laboratory, Stockholm, Sweden.
DNA extraction and 16S rRNA sequencing
Fecal samples were frozen in sterile tubes without additives and DNA extraction was done using the MO BIO PowerFecal DNA isolation kit (now available as QIAamp PowerFecal DNA Kit) following the manufacturer’s protocol. DNA was eluted in milliQ H2O and stored at −80°C awaiting analysis. Prior to amplification, samples were thawed and normalized, and a total of 50 ng were used to amplify the V3-V4 region of the 16S rRNA gene using primer pair 341F/805R. The initial amplification was carried out for 20 cycles with the forward primer construct:
5′-TCGTCGGCAGCGTCAGATGTGTATAAGAGACAGCCTACGGGNGGCWGCAG-3′,
and the reverse primer construct
5′-GTCTCGTGGGCTCGGAGATGTGTATAAGAGACAGGACTACHVGGGTATCTAATCC-3′.
After cleaning, a 5 μL aliquot of each of the 2-step samples was submitted to an Indexing reaction using the Nextera XT Index Kits v2 in a 13 cycle PCR. Purification of PCR products was carried out using Agencourt Ampure XP Beads on a KingFisher Flex System. Samples were then pooled to equimolar amounts and sequenced in a MiSeq instrument.
Quantification and Statistical Analysis
Mass Cytometry Preprocessing and Gating
All FCS-files were exported as non-randomized without any additional preprocessing from the CyTOF software (version 6.0.626). Files were normalized using our own in-house implementation of normalization software described previously (Finck et al., 2013). Each file was debarcoded using the MATLAB version of the single-cell debarcoder (Zunder et al., 2015). For visualization, each data point X was randomized by sampling from a normal distribution with a mean of X and a standard deviation of 0.3. The data was transformed by dividing each value by 5 and applying the hyperbolic sine function (arcsin h (X/5)). Each file was gated on according to the strategy shown in Table S4. For each file, cell frequencies of each population were calculated as a percentage of all DNA-positive events.
Aitchison Distances using Immune Cell Frequencies
Aitchison distances between gated immune cell frequencies were calculated using the aDist function of the R package robCompositions. Classic multidimensional scaling coordinates were calculated using the cmdscale function from the stats-package. PERMANOVA statistical test between term and preterm births was performed using the adonis function from the vegan-package. Statistical test for comparison of inter-individual distances was performed using a Student’s t test.
Correlation of Cord Blood and Week 1 Measurements
For this analysis, plasma proteins were selected for immunity-related proteins based on GO-terms. Pearson correlations for gated immune cell frequencies (n = 48) and plasma protein concentrations (n = 44) in cord and postnatal blood from the same child were calculated (paired correlations). These were compared to Pearson correlations between an equal number of randomly paired cord and postnatal blood samples (random correlations). Cord blood was considered to be predictive of postnatal blood if the confidence intervals of the paired correlations and the random correlations were non-overlapping.
bhSNE of Mass Cytometry Data
Manual gating was used to extract populations to be included in the bhSNE run. Samples were merged into a single dataset and a Z-score transformation was applied in order to give equal weight to all markers. The ACCENSE implementation of Barnes-Hut SNE was used (Shekhar and Brodin, 2013), with a perplexity of 30 and removal of outliers. The markers used for each population is listed in Table S3.
Jensen-Shannon Distances on bhSNE Distributions
The Jensen-Shannon distance between two two-dimensional-distributions of bhSNE coordinates was calculated using the bhSNE maps generated as described above. The calculation of Jensen-Shannon distances was performed as previously described by Amir et al., 2013. Briefly, two-dimensional kernel density estimation distributions (two-dimensional-KDE) are calculated from the bhSNE coordinates using the kde2d function from the MASS package with n = 28. The Jensen-Shannon distance between two two-dimensional-KDEs is defined as the square root of the Jensen-Shannon divergence (JSD) between these distributions. The JSD between two distributions P and Q are defined as:
where
and KL is the Kullback-Leibler divergence defined as:
Analysis of variance in Mass Cytometry Data
Cord blood samples were excluded from the variance analysis to remove any variance due to differences between cord and peripheral blood. Variance analysis was only performed using sample series containing all time points to ensure that inter-sample variance was based on at least three samples. For each group of adults (n = 3), preterm (n = 29) and term children (n = 15), and for each gated subpopulation, a linear model was fitted with the subpopulation frequency as the response variable and subject ID and sampling time in days after birth as predictors. An ANOVA table was extracted and the relative contribution of Subject ID and sampling time to the total sum of squares was calculated for each subpopulation in each group. The coefficient of variation defined as
was calculated separately for each group and each gated subpopulation.
Clustering of mass cytometry data by self-organizing maps
Clustering was performed on each cell type separately, pooling all samples (n = 91) from 28 children. For each cell type, each dataset was down-sampled to 10 000 cells, files belonging to the same child were pooled and the data was Z-score transformed to account for batch effects between series. All files were pooled and the maximum intensity for each channel was set to the 99th percentile to account for outliers. Self-organized map (SOM)-clustering using the som function from the kohonen package and a hexagonal SOM grid of 20x20 was performed using markers specific for each cell type (Table S3) and rlen = 100. Subclustering on the SOM clusters to 10 subclusters was performed and clusters representing less than 1% of all cells were removed.
ProSeek plasma protein data preprocessing
Cq-values for each protein are recalculated to a relative log2-scale with arbitrary units. The data is normalized to minimize intra- and inter-assay variation, and the data from the three panels and the three batches were merged into one dataset. Proteins that were detected in less than 20% of all samples were discarded. Any missing values were set to the lowest detectable value for that protein. A batch correction was performed using the ComBat algorithm as provided in the sva R package using pre-term/term status and sampling time (week) as covariates.
GO-term classification of immune system plasma proteins
Proteins with a known function in the immune system were identified from the total list of proteins (Table S2) by selection of proteins associated with at least one of the following GO-terms: ‘immune response’ (GO:0006955), ‘inflammatory response’ (GO:0006954), ‘cytokine activity’ (GO:0005125), ‘chemokine activity’ (GO:0008009), and ‘defense response’ (GO:0006952). This subgroup involved 124 out of 251 proteins.
Topological Data Analysis
The parameter landscape model in Figure 5 was generated by performing Topological Data Analysis (TDA) integrating 250 plasma protein concentrations and 48 immune cell frequency measurements, in 202 blood samples from newborn children. Each measurement was scaled to unit variance. The analysis was performed using Ayasdi software platform (Ayasdi Inc., Menlo Park CA). Nodes in the network represent sets of newborn blood samples and edges connect nodes with sharing samples. Nodes are colored by the average value of their samples for the variables listed in the figure legends. TDA was used to reconstruct the systems-level changes in the newborn immune system and allow analyses of changes in relation to metadata parameters. Two types of parameters are needed in TDA; I) a notion of similarity, measuring a distance between samples in the dataset and II) lenses, which are real-valued functions applied to the data points. Lenses are used to create overlapping bins in the dataset. Overlapping families of intervals are used to create overlapping bins. Metrics are used with lenses to construct the Ayasdi output network. There are two parameters used to define bins in the data: I) resolution determining the number of bins, and II) gain, determining the degree of overlap of data intervals. Once bins are constructed, a clustering step is performed on each bin using single linkage clustering with a fixed heuristic for the choice of the scale parameter (Singh et al., 2007).This gives a family of clusters within the data, which may overlap, and a network with one node for each such cluster, a connection between two nodes sharing at least one sample. We used two types of lenses. In making a TDA graph, the points in the dataset are clustered within bins, defined by setting the resolution of the analysis. To determine how two groups of points defined in a TDA graph differ, a non-parametric statistical test (Kolmogorov-Smirnov) in combination with the p value (t test) was used to identify parameters with a p < 0.05 for either one of the tests. Cells and proteins that were expressed at significantly different levels are reported in Table S1.
RNaseq data analysis
We estimated counts from Kallisto (Bray et al., 2016) and performed differential expression analysis using DEseq2 (Love et al., 2014). To calculate enriched gene ontology terms associated with these differentially regulated genes we used the PIANO package (Väremo and Nielsen, 2013). These calculations were performed separately to compare preterm and term children in week 12 and to compare week 12 versus week 1 samples from all children analyzed (n = 8).
16S rRNA sequencing analysis
The Cutadapt package was used to remove reads not carrying primers, trim away primer sequences and bases with Phred score < 15. Forward and reverse reads were merged using Usearch. Non-overlapping reads, merged sequences < 380 bp or > 520 bp, and sequences with > 3 expected errors over the full length were removed. Sequences were de-replicated and the unoise tool was used with a minimal cluster size set to 2 to error-correct the sequences. Each of the merged sequences were mapped back to the corrected sequences for quantification, requiring 99% identity over the full length to assign taxonomy to the corrected sequences. To assign taxonomical class, corrected sequences were mapped to the SILVA database and the result was parsed at an ID cutoff at 95%. Unifrac distances were calculated by mapping the sequences to SILVA using pplacer, and calculating distances using Guppy.
Data and Software Availability
Additional analyses and raw data are available: brodinlab.com/newborns. Also, all mass cytometry data are available at https://flowrepository.org/id/FR-FCM-ZYKQ (Exp ID: FR-FCM-ZYKQ), plasma protein and 16S rRNA data are available at Mendeley data: https://doi.org/10.17632/ynhdrcxtcc.1.
Acknowledgments
We thank all families for their participation and nurses, midwives, and physicians for help with sample collection. We thank Jochen Schwenk and Ragna Häussler at the SciLifeLab Plasma profiling platform and Lars Engstrand and Luisa Hugerth at the Clinical Genomics Facility for help with 16S rRNA profiling. P.B. is grateful to Professor Mark Davis of Stanford University for his valuable mentorship. This study was supported by an ERC Starting Grant (StG-677559), the Swedish Research Council, Karolinska Institutet, and the Swedish Society for Medical Research.
Author Contributions
Conceptualization, P.B.; Methodology, P.B., A.O., T.L., J.M., and C.P.; Software, A.O., Y.C., C.Z., and P.B.; Investigation, A.O. and E.H.; Writing—Original Draft, P.B. and A.O.; Writing—Review & Editing, P.B., A.O., E.H., K.B., and A.G.; Resources, P.B., E.H., K.B., A.G., and K.B.; Supervision, P.B.; and Funding Acquisition, P.B.
Declaration of Interests
P.B., A.O., T.L., and J.M. are founders and shareholders in Cytodelics AB (Stockholm, Sweden).
Published: August 23, 2018
Footnotes
Supplemental Information includes five figures and four tables and can be found with this article online at https://doi.org/10.1016/j.cell.2018.06.045.
Supplemental Information
(A) Kolmogorov-Smirnoff, KS test comparing convergence stage versus Late stage, showing descriptive statistics and test result. (B) Kolmogorov-Smirnoff, KS test comparing convergence stage versus Preterm early stage, showing descriptive statistics and test result. (C) Kolmogorov-Smirnoff, KS test comparing convergence stage versus Term early stage, showing descriptive statistics and test result.
All UniProt IDs for plasma proteins included in ProSeek analyses.
Markers included in bhSNE analyses for the respective cell populations analyzed.
Manual gating strategy and the markers used to identify known immune cell populations throughout the hierarchy.
References
- Alcaïs A., Quintana-Murci L., Thaler D.S., Schurr E., Abel L., Casanova J.L. Life-threatening infectious diseases of childhood: single-gene inborn errors of immunity? Ann. N Y Acad. Sci. 2010;1214:18–33. doi: 10.1111/j.1749-6632.2010.05834.x. [DOI] [PubMed] [Google Scholar]
- Amenyogbe N., Levy O., Kollmann T.R. Systems vaccinology: a promise for the young and the poor. Philos. Trans. R. Soc. Lond. B Biol. Sci. 2015;370 doi: 10.1098/rstb.2014.0340. pii: 20140340. [DOI] [PMC free article] [PubMed] [Google Scholar]
- Amir E., Davis K.L., Tadmor M.D., Simonds E.F., Levine J.H., Bendall S.C., Shenfeld D.K., Krishnaswamy S., Nolan G.P., Pe’er D. viSNE enables visualization of high dimensional single-cell data and reveals phenotypic heterogeneity of leukemia. Nature Biotechnology. 2013;31:545–552. doi: 10.1038/nbt.2594. [DOI] [PMC free article] [PubMed] [Google Scholar]
- Arrieta M.C., Stiemsma L.T., Dimitriu P.A., Thorson L., Russell S., Yurist-Doutsch S., Kuzeljevic B., Gold M.J., Britton H.M., Lefebvre D.L., CHILD Study Investigators Early infancy microbial and metabolic alterations affect risk of childhood asthma. Sci. Transl. Med. 2015;7:307ra152. doi: 10.1126/scitranslmed.aab2271. [DOI] [PubMed] [Google Scholar]
- Assarsson E., Lundberg M., Holmquist G., Björkesten J., Thorsen S.B., Ekman D., Eriksson A., Rennel Dickens E., Ohlsson S., Edfeldt G. Homogenous 96-plex PEA immunoassay exhibiting high sensitivity, specificity, and excellent scalability. PLoS ONE. 2014;9:e95192. doi: 10.1371/journal.pone.0095192. [DOI] [PMC free article] [PubMed] [Google Scholar]
- Bhutta Z.A., Black R.E. Global maternal, newborn, and child health--so near and yet so far. N. Engl. J. Med. 2013;369:2226–2235. doi: 10.1056/NEJMra1111853. [DOI] [PubMed] [Google Scholar]
- Bray N.L., Pimentel H., Melsted P., Pachter L. Near-optimal probabilistic RNA-seq quantification. Nat. Biotechnol. 2016;34:525–527. doi: 10.1038/nbt.3519. [DOI] [PubMed] [Google Scholar]
- Brinkworth J.F., Barreiro L.B. The contribution of natural selection to present-day susceptibility to chronic inflammatory and autoimmune disease. Curr. Opin. Immunol. 2014;31:66–78. doi: 10.1016/j.coi.2014.09.008. [DOI] [PMC free article] [PubMed] [Google Scholar]
- Brodin P., Davis M.M. Human immune system variation. Nat. Rev. Immunol. 2017;17:21–29. doi: 10.1038/nri.2016.125. [DOI] [PMC free article] [PubMed] [Google Scholar]
- Brodin P., Jojic V., Gao T., Bhattacharya S., Angel C.J., Furman D., Shen-Orr S., Dekker C.L., Swan G.E., Butte A.J. Variation in the human immune system is largely driven by non-heritable influences. Cell. 2015;160:37–47. doi: 10.1016/j.cell.2014.12.020. [DOI] [PMC free article] [PubMed] [Google Scholar]
- Carr E.J., Dooley J., Garcia-Perez J.E., Lagou V., Lee J.C., Wouters C., Meyts I., Goris A., Boeckxstaens G., Linterman M.A., Liston A. The cellular composition of the human immune system is shaped by age and cohabitation. Nat. Immunol. 2016;17:461–468. doi: 10.1038/ni.3371. [DOI] [PMC free article] [PubMed] [Google Scholar]
- Davis M.M., Brodin P. Rebooting human immunology. Annu. Rev. Immunol. 2018;36:843–864. doi: 10.1146/annurev-immunol-042617-053206. [DOI] [PMC free article] [PubMed] [Google Scholar]
- Dominguez-Bello M.G., Costello E.K., Contreras M., Magris M., Hidalgo G., Fierer N., Knight R. Delivery mode shapes the acquisition and structure of the initial microbiota across multiple body habitats in newborns. Proc. Natl. Acad. Sci. USA. 2010;107:11971–11975. doi: 10.1073/pnas.1002601107. [DOI] [PMC free article] [PubMed] [Google Scholar]
- Elahi S., Ertelt J.M., Kinder J.M., Jiang T.T., Zhang X., Xin L., Chaturvedi V., Strong B.S., Qualls J.E., Steinbrecher K.A. Immunosuppressive CD71+ erythroid cells compromise neonatal host defence against infection. Nature. 2013;504:158–162. doi: 10.1038/nature12675. [DOI] [PMC free article] [PubMed] [Google Scholar]
- Finck R., Simonds E.F., Jager A., Krishnaswamy S., Sachs K., Fantl W., Pe’er D., Nolan G.P., Bendall S.C. Normalization of mass cytometry data with bead standards. Cytometry A. 2013;83:483–494. doi: 10.1002/cyto.a.22271. [DOI] [PMC free article] [PubMed] [Google Scholar]
- Gaucher D., Therrien R., Kettaf N., Angermann B.R., Boucher G., Filali-Mouhim A., Moser J.M., Mehta R.S., Drake D.R., 3rd, Castro E. Yellow fever vaccine induces integrated multilineage and polyfunctional immune responses. J. Exp. Med. 2008;205:3119–3131. doi: 10.1084/jem.20082292. [DOI] [PMC free article] [PubMed] [Google Scholar]
- Gensollen T., Iyer S.S., Kasper D.L., Blumberg R.S. How colonization by microbiota in early life shapes the immune system. Science. 2016;352:539–544. doi: 10.1126/science.aad9378. [DOI] [PMC free article] [PubMed] [Google Scholar]
- Gibbons D.L., Haque S.F., Silberzahn T., Hamilton K., Langford C., Ellis P., Carr R., Hayday A.C. Neonates harbour highly active gammadelta T cells with selective impairments in preterm infants. Eur. J. Immunol. 2009;39:1794–1806. doi: 10.1002/eji.200939222. [DOI] [PubMed] [Google Scholar]
- Gibbons D., Fleming P., Virasami A., Michel M.L., Sebire N.J., Costeloe K., Carr R., Klein N., Hayday A. Interleukin-8 (CXCL8) production is a signatory T cell effector function of human newborn infants. Nat. Med. 2014;20:1206–1210. doi: 10.1038/nm.3670. [DOI] [PubMed] [Google Scholar]
- Kaczorowski K.J., Shekhar K., Nkulikiyimfura D., Dekker C.L., Maecker H., Davis M., Chakraborty A.K., Brodin P. Continuous immunotypes describe human immune variation and predict diverse responses. Proc. Natl. Acad. Sci. U S A. 2017;114:E6097–E6106. doi: 10.1073/pnas.1705065114. [DOI] [PMC free article] [PubMed] [Google Scholar]
- Kaetzel C.S. The polymeric immunoglobulin receptor: bridging innate and adaptive immune responses at mucosal surfaces. Immunol. Rev. 2005;206:83–99. doi: 10.1111/j.0105-2896.2005.00278.x. [DOI] [PubMed] [Google Scholar]
- Kollmann T.R., Kampmann B., Mazmanian S.K., Marchant A., Levy O. Protecting the newborn and young infant from infectious diseases: lessons from immune ontogeny. Immunity. 2017;46:350–363. doi: 10.1016/j.immuni.2017.03.009. [DOI] [PubMed] [Google Scholar]
- Ku C.L., von Bernuth H., Picard C., Zhang S.Y., Chang H.H., Yang K., Chrabieh M., Issekutz A.C., Cunningham C.K., Gallin J. Selective predisposition to bacterial infections in IRAK-4-deficient children: IRAK-4-dependent TLRs are otherwise redundant in protective immunity. J. Exp. Med. 2007;204:2407–2422. doi: 10.1084/jem.20070628. [DOI] [PMC free article] [PubMed] [Google Scholar]
- La Rosa P.S., Warner B.B., Zhou Y., Weinstock G.M., Sodergren E., Hall-Moore C.M., Stevens H.J., Bennett W.E., Jr., Shaikh N., Linneman L.A. Patterned progression of bacterial populations in the premature infant gut. Proc. Natl. Acad. Sci. USA. 2014;111:12522–12527. doi: 10.1073/pnas.1409497111. [DOI] [PMC free article] [PubMed] [Google Scholar]
- Laforest-Lapointe I., Arrieta M.C. Patterns of early-life gut microbial colonization during human immune development: an ecological perspective. Front. Immunol. 2017;8:788. doi: 10.3389/fimmu.2017.00788. [DOI] [PMC free article] [PubMed] [Google Scholar]
- Lakshmikanth T., Olin A., Chen Y., Mikes J., Fredlund E., Remberger M., Omazic B., Brodin P. Mass cytometry and topological data analysis reveal immune parameters associated with complications after allogeneic stem cell transplantation. Cell Rep. 2017;20:2238–2250. doi: 10.1016/j.celrep.2017.08.021. [DOI] [PubMed] [Google Scholar]
- Leiber A., Schwarz J., Köstlin N., Spring B., Fehrenbach B., Katava N., Poets C.F., Gille C. Neonatal myeloid derived suppressor cells show reduced apoptosis and immunosuppressive activity upon infection with Escherichia coli. Eur. J. Immunol. 2017;47:1009–1021. doi: 10.1002/eji.201646621. [DOI] [PubMed] [Google Scholar]
- Love M.I., Huber W., Anders S. Moderated estimation of fold change and dispersion for RNA-seq data with DESeq2. Genome Biol. 2014;15:550. doi: 10.1186/s13059-014-0550-8. [DOI] [PMC free article] [PubMed] [Google Scholar]
- Lum P.Y., Singh G., Lehman A., Ishkanov T., Vejdemo-Johansson M., Alagappan M., Carlsson J., Carlsson G. Extracting insights from the shape of complex data using topology. Sci. Rep. 2013;3:1236. doi: 10.1038/srep01236. [DOI] [PMC free article] [PubMed] [Google Scholar]
- Lundberg M., Eriksson A., Tran B., Assarsson E., Fredriksson S. Homogeneous antibody-based proximity extension assays provide sensitive and specific detection of low-abundant proteins in human blood. Nucleic Acids Res. 2011;39:e102. doi: 10.1093/nar/gkr424. [DOI] [PMC free article] [PubMed] [Google Scholar]
- Mach B., Steimle V., Martinez-Soria E., Reith W. Regulation of MHC class II genes: lessons from a disease. Annu. Rev. Immunol. 1996;14:301–331. doi: 10.1146/annurev.immunol.14.1.301. [DOI] [PubMed] [Google Scholar]
- McGovern N., Shin A., Low G., Low D., Duan K., Yao L.J., Msallam R., Low I., Shadan N.B., Sumatoh H.R. Human fetal dendritic cells promote prenatal T-cell immune suppression through arginase-2. Nature. 2017;546:662–666. doi: 10.1038/nature22795. [DOI] [PMC free article] [PubMed] [Google Scholar]
- Mold J.E., Michaëlsson J., Burt T.D., Muench M.O., Beckerman K.P., Busch M.P., Lee T.H., Nixon D.F., McCune J.M. Maternal alloantigens promote the development of tolerogenic fetal regulatory T cells in utero. Science. 2008;322:1562–1565. doi: 10.1126/science.1164511. [DOI] [PMC free article] [PubMed] [Google Scholar]
- Nakaya H.I., Hagan T., Duraisingham S.S., Lee E.K., Kwissa M., Rouphael N., Frasca D., Gersten M., Mehta A.K., Gaujoux R. Systems analysis of immunity to influenza vaccination across multiple years and in diverse populations reveals shared molecular signatures. Immunity. 2015;43:1186–1198. doi: 10.1016/j.immuni.2015.11.012. [DOI] [PMC free article] [PubMed] [Google Scholar]
- Oertli M., Müller A. Helicobacter pylori targets dendritic cells to induce immune tolerance, promote persistence and confer protection against allergic asthma. Gut. Microbes. 2012;3:566–571. doi: 10.4161/gmic.21750. [DOI] [PMC free article] [PubMed] [Google Scholar]
- Orrù V., Steri M., Sole G., Sidore C., Virdis F., Dei M., Lai S., Zoledziewska M., Busonero F., Mulas A. Genetic variants regulating immune cell levels in health and disease. Cell. 2013;155:242–256. doi: 10.1016/j.cell.2013.08.041. [DOI] [PMC free article] [PubMed] [Google Scholar]
- Patin E., Hasan M., Bergstedt J., Rouilly V., Libri V., Urrutia A., Alanio C., Scepanovic P., Hammer C., Jönsson F., Milieu Intérieur Consortium Natural variation in the parameters of innate immune cells is preferentially driven by genetic factors. Nat. Immunol. 2018;19:302–314. doi: 10.1038/s41590-018-0049-7. [DOI] [PubMed] [Google Scholar]
- Picelli S., Faridani O.R., Björklund Å.K., Winberg G., Sagasser S., Sandberg R. Full-length RNA-seq from single cells using Smart-seq2. Nat. Protoc. 2014;9 doi: 10.1038/nprot.2014.006. nprot.2014.006. [DOI] [PubMed] [Google Scholar]
- Quach H., Quintana-Murci L. Living in an adaptive world: genomic dissection of the genus Homo and its immune response. J. Exp. Med. 2017;214:877–894. doi: 10.1084/jem.20161942. [DOI] [PMC free article] [PubMed] [Google Scholar]
- Querec T.D., Akondy R.S., Lee E.K., Cao W., Nakaya H.I., Teuwen D., Pirani A., Gernert K., Deng J., Marzolf B. Systems biology approach predicts immunogenicity of the yellow fever vaccine in humans. Nat. Immunol. 2009;10:116–125. doi: 10.1038/ni.1688. [DOI] [PMC free article] [PubMed] [Google Scholar]
- Rieber N., Gille C., Köstlin N., Schäfer I., Spring B., Ost M., Spieles H., Kugel H.A., Pfeiffer M., Heininger V. Neutrophilic myeloid-derived suppressor cells in cord blood modulate innate and adaptive immune responses. Clin. Exp. Immunol. 2013;174:45–52. doi: 10.1111/cei.12143. [DOI] [PMC free article] [PubMed] [Google Scholar]
- Roederer M., Quaye L., Mangino M., Beddall M.H., Mahnke Y., Chattopadhyay P., Tosi I., Napolitano L., Terranova Barberio M., Menni C. The genetic architecture of the human immune system: a bioresource for autoimmunity and disease pathogenesis. Cell. 2015;161:387–403. doi: 10.1016/j.cell.2015.02.046. [DOI] [PMC free article] [PubMed] [Google Scholar]
- Sharma A.A., Jen R., Butler A., Lavoie P.M. The developing human preterm neonatal immune system: a case for more research in this area. Clin. Immunol. 2012;145:61–68. doi: 10.1016/j.clim.2012.08.006. [DOI] [PMC free article] [PubMed] [Google Scholar]
- Shekhar, K., Brodin, P., Davis, M., and Chakraborty, A. (2013). Automatic classification of cellular expression by nonlinear stochastic embedding (ACCENSE). In Proceedings of the National Academy of Sciences of the United States of America, pp. 202–207. [DOI] [PMC free article] [PubMed]
- Shen-Orr S.S., Furman D., Kidd B.A., Hadad F., Lovelace P., Huang Y.W., Rosenberg-Hasson Y., Mackey S., Grisar F.A., Pickman Y. Defective signaling in the JAK-STAT pathway tracks with chronic inflammation and cardiovascular risk in aging humans. Cell Syst. 2016;3:374–384.e4. doi: 10.1016/j.cels.2016.09.009. [DOI] [PMC free article] [PubMed] [Google Scholar]
- Singh, G., Mémoli, F., and Gunnar, C.G. (2007). Topological methods for the analysis of high dimensional data sets and 3d object recognition. SPBG.
- Sobolev O., Binda E., O’Farrell S., Lorenc A., Pradines J., Huang Y., Duffner J., Schulz R., Cason J., Zambon M. Adjuvanted influenza-H1N1 vaccination reveals lymphoid signatures of age-dependent early responses and of clinical adverse events. Nat. Immunol. 2016;17:204–213. doi: 10.1038/ni.3328. [DOI] [PMC free article] [PubMed] [Google Scholar]
- Strachan D.P. Hay fever, hygiene, and household size. BMJ. 1989;299:1259–1260. doi: 10.1136/bmj.299.6710.1259. [DOI] [PMC free article] [PubMed] [Google Scholar]
- Templ M., Hron K., Filzmoser P. robCompositions: an R-package for robust statistical analysis of compositional data. In: Buccianti A., editor. Compositional Data Analysis: Theory and Applications, V. Pawlowsky-Glahn. John Wiley & Sons; 2011. [DOI] [Google Scholar]
- Tsang J.S. Utilizing population variation, vaccination, and systems biology to study human immunology. Trends Immunol. 2015;36:479–493. doi: 10.1016/j.it.2015.06.005. [DOI] [PMC free article] [PubMed] [Google Scholar]
- Tsang J.S., Schwartzberg P.L., Kotliarov Y., Biancotto A., Xie Z., Germain R.N., Wang E., Olnes M.J., Narayanan M., Golding H., Baylor HIPC Center; CHI Consortium Global analyses of human immune variation reveal baseline predictors of postvaccination responses. Cell. 2014;157:499–513. doi: 10.1016/j.cell.2014.03.031. [DOI] [PMC free article] [PubMed] [Google Scholar]
- Väremo L., Nielsen J., Nookaew I. Enriching the gene set analysis of genome-wide data by incorporating directionality of gene expression and combining statistical hypotheses and methods. Nucleic Acids Res. 2013;41:4378–4391. doi: 10.1093/nar/gkt111. [DOI] [PMC free article] [PubMed] [Google Scholar]
- van der Maaten, L. (2013). Barnes-hut-SNE. arXiv, arXiv:1301.3342v2, https://arxiv.org/abs/1301.3342.
- Vatanen T., Kostic A.D., d’Hennezel E., Siljander H., Franzosa E.A., Yassour M., Kolde R., Vlamakis H., Arthur T.D., Hämäläinen A.M., DIABIMMUNE Study Group Variation in microbiome LPS immunogenicity contributes to autoimmunity in humans. Cell. 2016;165:1551. doi: 10.1016/j.cell.2016.05.056. [DOI] [PubMed] [Google Scholar]
- von Bernuth H., Picard C., Jin Z., Pankla R., Xiao H., Ku C.L., Chrabieh M., Mustapha I.B., Ghandil P., Camcioglu Y. Pyogenic bacterial infections in humans with MyD88 deficiency. Science. 2008;321:691–696. doi: 10.1126/science.1158298. [DOI] [PMC free article] [PubMed] [Google Scholar]
- Weber L.M., Robinson M.D. Comparison of clustering methods for high-dimensional single-cell flow and mass cytometry data. Cytometry A. 2016;89:1084–1096. doi: 10.1002/cyto.a.23030. [DOI] [PubMed] [Google Scholar]
- Wehrens R., Buydens L.M. Self-and super-organizing maps in R: the Kohonen package. J. Stat. Softw. 2007;21:1–19. [Google Scholar]
- Wong E.B., Ndung’u T., Kasprowicz V.O. The role of mucosal-associated invariant T cells in infectious diseases. Immunology. 2017;150:45–54. doi: 10.1111/imm.12673. [DOI] [PMC free article] [PubMed] [Google Scholar]
- Zhang X., Zhivaki D., Lo-Man R. Unique aspects of the perinatal immune system. Nat. Rev. Immunol. 2017;17:495–507. doi: 10.1038/nri.2017.54. [DOI] [PubMed] [Google Scholar]
- Zunder E.R., Finck R., Behbehani G.K., Amir el-A.D., Krishnaswamy S., Gonzalez V.D., Lorang C.G., Bjornson Z., Spitzer M.H., Bodenmiller B. Palladium-based mass tag cell barcoding with a doublet-filtering scheme and single-cell deconvolution algorithm. Nat. Protoc. 2015;10:316–323. doi: 10.1038/nprot.2015.020. [DOI] [PMC free article] [PubMed] [Google Scholar]
Associated Data
This section collects any data citations, data availability statements, or supplementary materials included in this article.
Supplementary Materials
(A) Kolmogorov-Smirnoff, KS test comparing convergence stage versus Late stage, showing descriptive statistics and test result. (B) Kolmogorov-Smirnoff, KS test comparing convergence stage versus Preterm early stage, showing descriptive statistics and test result. (C) Kolmogorov-Smirnoff, KS test comparing convergence stage versus Term early stage, showing descriptive statistics and test result.
All UniProt IDs for plasma proteins included in ProSeek analyses.
Markers included in bhSNE analyses for the respective cell populations analyzed.
Manual gating strategy and the markers used to identify known immune cell populations throughout the hierarchy.