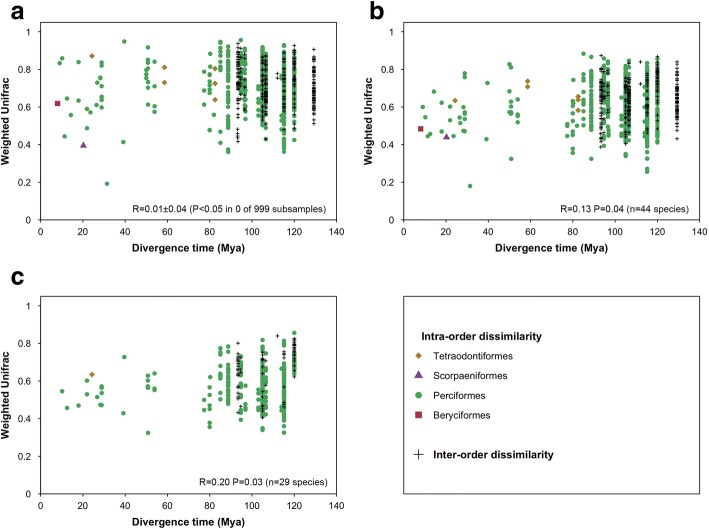
Fig. 4.
Phylogenetic dissimilarity (W-Unifrac) between skin-associated microbiomes of fishes against the divergence time between species. a Illustration of method A: one individual per fish species is represented. b Illustration of method B: W-Unifrac computed on averaged OTUs relative abundances across all individuals of each fish species. c Same as b, excepted that only species containing at least three individuals were represented. The result of the Mantel test corresponding to each methodology is displayed on each panel. Fishes are plotted as belonging to the same taxonomic order (dots) or belonging to different orders (‘+’ sign). Divergence time in millions of years ago (Mya). Note that intraspecific dissimilarities are not shown

