Abstract
Purpose:
To examine the extent of gray and white matter (WM) injury following global antenatal hypoxia-ischemia (H-I) and resulting in muscle hypertonia in newborns in a rabbit cerebral palsy model.
Materials and Methods:
Rabbit dams (n =15) underwent uterine ischemia procedure resulting in a global fetal H-I at embryonic day 22 (embryonic 22 days gestation). Newborn’s brains underwent high resolution diffusion tensor imaging on a 14 Tesla magnet ex vivo. Fractional anisotropy (FA) in brains of hypertonic (n = 9), nonhypertonic (n = 6), and sham control (n = 5) kits were compared voxel-wise using Tract-Based Spatial Statistics (TBSS) approach. Herein, we used a novel method to assess local WM tracts’ thicknesses in TBSS analysis and compare between the groups.
Results:
Significant (corrected P < 0.05) reduction of WM FA was found in corpus callosum splenium (91.2%), periventricular WM (83.5%), fimbria hippocampi (78.8%), cingulum (81.4%), anterior commissure (95%), internal capsule (83.2%), and optic tract (82.9%) in the hypertonic group. Significant (corrected P < 0.05) reduction in WM tracts’ thicknesses was found in corpus callosum (73.3%), periventricular WM (82.5%), cingulum (73.4%), bilaterally in the hypertonic group.
Conclusion:
WM injury in newborn hypertonic kits 10 days after global fetal H-I is widespread and involves not only motor but also limbic and commissural fibers in multiple regions. WM injury in newborn hypertonic kits is manifested by changes in microstructural properties and decreased FA, as well as reduction of WM volumes, relative to nonhypertonic kits.
Global Antenatal Hypoxic-ischemic (H-I) brain injury affects both gray and white matter (WM) in multiple regions across the brain in humans.1–4 We have previously demonstrated loss of white and gray matter, as well as microstructural injury in WM using conventional and diffusion tensor imaging (DTI) in a global antenatal H-I injury model of cerebral palsy5,6 using region of interests (ROI) placed on selective areas in gray and WM. While the ROI approach does not require a high resolution data set and is widely used for in vivo imaging, it has the limitation of being operator dependent and restricted to a predefined choice of ROIs. To investigate areas of brain injury not hitherto known to be affected by H-I, we wanted to enhance the unbiased approach of Tract-Based Spatial Statistics (TBSS) to investigate the entire brain for both WM and GM areas of injury.
TBSS was introduced7,8 to mitigate the influence of residual misalignment in registration of diffusion data, and to overcome the need to set smoothing extent in voxelbased analyses. In TBSS, following an initial nonlinear registration step, voxels that are local maxima for fractional anisotropy (FA) are mapped onto a skeleton composed of sheets of maximum FA voxels, and statistical analysis is performed on the skeleton voxels. Over the past years, TBSS has been widely adopted, aided by availability within FSL software suite,9,10 robustness against misregistration, ease of use, and objectivity due to minimal operator involvement.
While providing a method to statistically assess group differences in WM tracts’ diffusion properties, such as FA and directional diffusivities, the traditional TBSS approach lacks the ability to compare another important metric of WM tracts, such as tract volume or cross-section area. Changes to cross-section areas of WM tracts are important indicators of normal maturation,11,12 axonal loss or neurodegeneration after brain injury,5 or compensatory increase.13 Importantly, changes in diffusion properties, presumably indicating microstructural injury, may be temporally discordant with volumetric changes. In a previous study5 using the ROI approach we demonstrated that a decrease of FA in newborn rabbits after antenatal hypoxic-ischemic (H-I) brain injury was initially observed in major WM tracts in newborns at postnatal day 1 (P1). With time, FA became normalized, which would suggest that MRI taken later in time would not be able to detect WM injury based on FA alone. However, we noticed a concomitant decrease of the tract cross-section area in juveniles 3 weeks later, which was not evident at P1. Hence, we have previously proposed an MRI biomarker, a tract specific product of FA and WM cross-section, as an indicator of injury at all ages.
Several techniques have been proposed to assess WM loss, among them voxel-based morphometry (VBM)14 and Tract Specific Analysis (TSA).15 The existing methods rarely had been used to assess WM tract volume changes probably due to either difficulties in implementation, need of relatively high resolution data sets with good tissue contrast, loss of tract specificity in VBM or required operator manipulations in TSA. These limitations are especially problematic in infant and animal data sets with relatively poor spatial resolution, especially for in vivo imaging, and poor tissue contrast. In the current work, we sought a simple and objective way to assess tract specific WM changes in neonates after global antenatal H-I injury across the whole brain, including FA and tract volumes, without manually drawing ROIs, while leveraging the robustness, objectivity and statistical power of TBSS. Herein, we describe our modification and enhancement of the TBSS method.
Materials and Methods
Animal Model of Global Fetal Hypoxia-Ischemia and Sample Collection
New Zealand White pregnant rabbits (n = 12) (Covance, NJ) at 22 days gestation (70% term) underwent uterine ischemia induced by inflation of intra-aortic balloon catheter for 40 minutes, which caused global hypoxia-ischemia in fetuses.16 Sham control dams (n = 3) underwent the surgery, but without the balloon inflation. The dams were allowed to deliver in a nest box at term (31.5 days).
At P1, all kits, including sham controls, underwent neurobehavioral testing to determine the extent of motor and sensory deficits, including muscle tone measurements16 and were stratified into three groups: hypertonic (muscle tone score > 2 at least in one limb, n = 9), nonhypertonic after H-I (muscle tone score = 2, n = 6), and sham control kits (n = 5). All kits in sham group had normal tone (muscle tone score = 2). One or two kits per litter were included in the analysis.
After neurobehavioral testing, the P1 kits were transcardially perfused with 4% paraformaldehyde in phosphate buffered solution (PBS), pH = 7.4, brains removed and postfixed in the same fixative for 1–2 weeks.
MRI Methods
Fixed brains were rehydrated in PBS for 24 h before imaging and immersed in nonaqueous media (Fomblin Y, Sigma Aldrich, MO). Imaging was performed on a Bruker Avance 600 MHz imaging spectrometer (Bruker, Billerica, MA) using a 20-mm resonator.
DTI experiment consisted of 30 noncollinear directions diffusion weighted spin echo images with b = 0 and 1.5 ms/μm2, δ/Δ = 3/7 ms. Imaging parameters were repetition time/echo time/number of excitations (TR/TE/NEX) 4800/14.8/1, field of view (FOV) = 2.12 × 1.57 cm, matrix 142 × 105, 25‒37 sagittal slices 0.3 mm thick with no gaps covering whole brain from olfactory bulbs to the end of cerebellum. In-plane resolution was 150 × 150 μm, and brain volumes were interpolated to isotropic 150 μm3. DTI scan time was 5 h 18 min. Diffusion tensor maps were calculated using multivariate linear fitting of signal attenuation from the acquired diffusion weighted images.17 Fractional anisotropy (FA) maps were calculated18 using in-house software written on Matlab (MathWorks, Natick, MA).
DTI Data Analysis by TBSS
For the analysis of DTI data, a cross-subject voxel-wise statistical analysis method, TBSS,7,8 was used as implemented in the FSL software library (http://www.fmrib.ox.ac.uk/fsl/). All individual FA volumes were registered to the best registration target, determined by a free search, i.e., the one requiring minimum transformation to be registered to other volumes. This target was subsequently used in the following scripts as a template on which final transformations were performed. Following registration, the mean FA-map was calculated, binarized using a threshold of 0.2 and the mean FA-skeleton was derived. For each subject, aligned FA data were projected to the nearest voxels on the mean FA skeleton. The skeleton voxel values were assigned to the maximum FA of the projected voxels.
Tract Thickness Map Calculation
A pair of neighborhood voxels, having FA greater than 0.2 and an angle between first eigenvectors of the diffusion tensor less than 30 degrees was considered belonging to the same WM tract. An arbitrary threshold 0.2 for FA was chosen based on typical values used for DTI tractography.19 This threshold was sufficient to unambiguously separate major WM tracts in our data set. The following algorithm was implemented in Matlab to assign tract thickness values to each voxel in the brain. For each voxel x in native space on DTI image with FA > 0.2 and the first eigenvector v, (1) A cross-section plane p was defined, normal to v and crossing x (2) A search box 30 × 30 × 30 voxels was set around x. The dimension of the search box (4.5 mm) was chosen larger than a size of any WM tract in perinatal rabbit. (3) For each voxel xi in the search box with FA > 0.2 and laying within one voxel size distance from the plane p, angle a was found between the first eigenvector vi of the voxel xi and v. (4) If α < 30 degrees predefined threshold, xi was projected to xp on the plane p. (5) Tract thickness value for voxel x was assigned to diameter of the largest circle that fits within the polygon covering all connected projected voxels xp on the plane p, as introduced in Zhang et al15 within the medial WM tract representation framework. For computational efficiency, it was estimated using morphological binary erosion operations by increasing structural element (circle), starting from the smallest circle 1 voxel radius, to progressively larger circles until the eroded image contained no nonzero voxels.
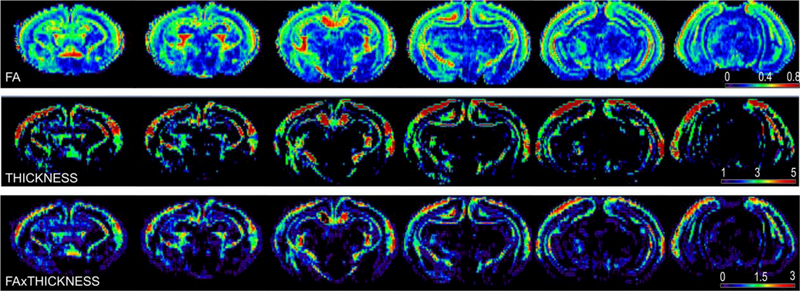
As a result of the procedure, a map of WM tracts’ thicknesses (further referred as THICKNESS) was created (Fig. 1). Maps of FAxTHICKNESS metric were created by multiplying the THICKNESS values by FA for each voxel. The transformation, derived for FA projection to the WM skeleton during TBSS procedure, was applied to project THICKNESS and FAxTHICKNESS map values on WM skeleton (implemented as tbss_non_FA script in FSL).
FIGURE 1:
Representative individual brain maps of a nonhypertonic P1 kit after E22 antenatal H-I. Top row: fractional anisotropy map. Color map legends are at the right corner for each corresponding row. The THICKNESS metric is in voxel size units (isotropic 150 μm), FA is unitless.
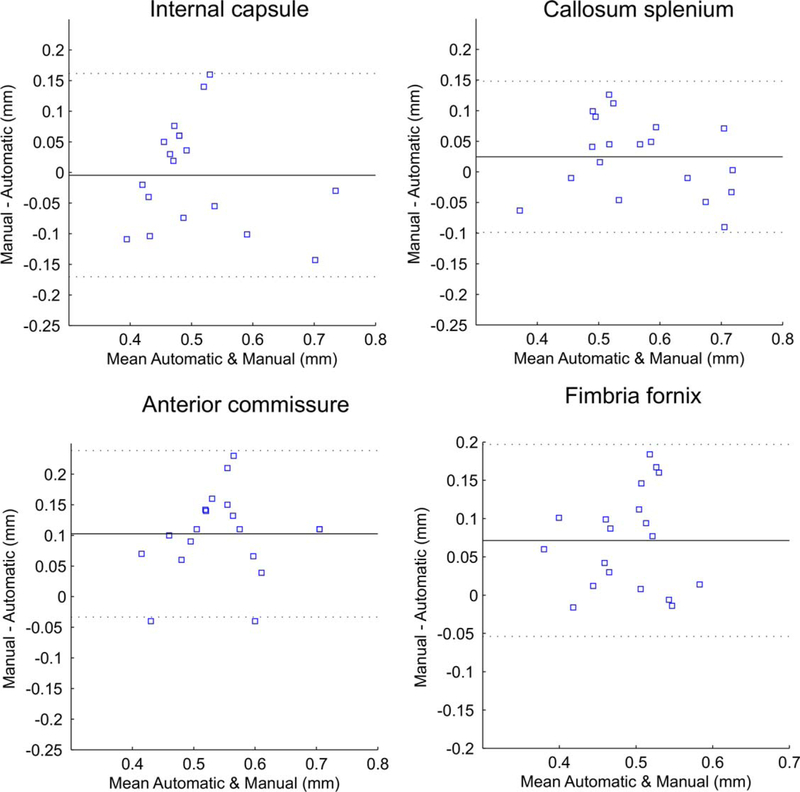
To validate the accuracy of the proposed method to estimate WM tract thickness, circular ROIs were manually placed on color encoded FA maps at the center of corpus callosum splenium, anterior commissure, internal capsule and fimbria hippocampi on sections where the tract courses were perpendicular to the slice plane and covering the whole tract cross-section. A second set of ROIs were placed on the same tracts by another observer in a blind manner to establish variability of the measurement. The tract thickness values were obtained as a diameter of the placed ROIs and also using the proposed automatic method for the voxel at the center of the ROI. Bland-Altman plots were used to assess the agreement between measurements obtained by manual ROI placement and automatic determination by the proposed method.
Statistical Analysis
The values of voxels on the common skeleton, projected from FA and for THICKNESS maps of each subject, were analyzed with voxel-wise cross-subject statistical analyses using general linear model.7,8 In the case of two groups, as in this study, testing of the contrast between the group predictors will be equivalent to unpaired t-test of the mean difference between the groups. As a result of the procedure, statistical parametric maps, containing P-values for the voxel-wise two-sample unpaired t-test between FA values in two groups were created. The results were corrected for multiple comparisons by controlling the family-wise error rate. Cluster-forming threshold c = 3 and 3000 permutations were used for nonparametric permutation inference FSL routine. Clusterbased thresholding is a method for correction for multiple comparisons by using the null distribution of the maximum (across the image) cluster size.20 This approach detects statistically significant clusters on the basis of the number of contiguous voxels whose voxel-wise statistic values lay above a predetermined primary threshold. Cluster size c = 3 is chosen arbitrarily to match a typical WM tract thickness in our dataset. Values for FA and tracts’ thicknesses were extracted by placing ROIs on the selected WM tracts and compared between control, nonhypertonic, and hypertonic groups using analysis of variance (ANOVA), followed by Tukey’s post hoc comparisons.
In all analyses, a P-value < 0.05 was considered statistically significant. Statistical parametric maps, containing corrected P-values and subjected to a threshold for P < 0.05, are reported.
Results
Validation of the White Matter Tract Thickness Measurements
Coefficients of variation in manual WM tract thickness determination between the two observers were 0.20 for the center of corpus callosum splenium, 0.11 for anterior commissure, 0.07 for internal capsule, and 0.18 for fimbria hippocampi. Figure 2 shows Bland-Altman plots comparing the WM tracts’ thicknesses, obtained by the proposed automatic method and by manual circular ROI placement. The reproducibility coefficients (RPC), calculated as average difference±1.96 SD of the difference, were less than 0.15 mm or 22–28% of the mean difference between the two methods for the major WM tracts, indicating good agreement between the methods. Visual inspection of the Bland-Altman plots did to reveal dependences of the differences between the methods on the tract thickness.
FIGURE 2:
Bland-Altman plots of major WM tracts’ thicknesses, obtained by the proposed automatic method and by manual circular ROI placement. The mean of the two methods is plotted against the difference in the two methods. Solid lines indicate the mean of the difference. Dashed lines indicate 1.96 × SD of the mean difference. RPC (reproducibility coefficient), is calculated as 1.96 × SD, or % of mean values.
Decrease of FA on Projection, Commissural, and Limbic Tracts in P1 Kits With Hypertonia
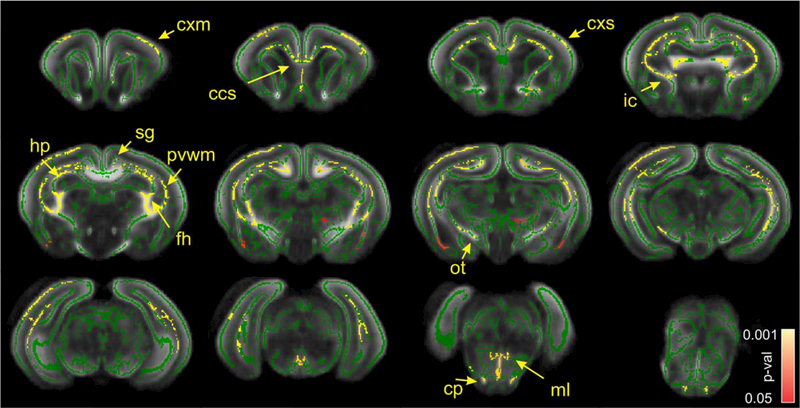
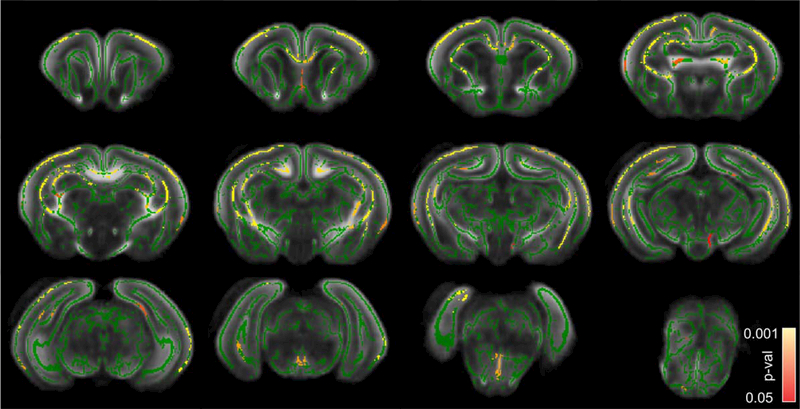
There was no voxels with P-value < 0.05 were found on statistical parametric map for the comparisons between sham control and nonhypertonic animals after H-I on either FA, THICKNESS or FAxTHICKNESS metrics, therefore, those groups were pooled (total n = 11) for further comparisons with the hypertonic group after H-I (n = 9). For the latter comparison, a significant decrease in FA in hypertonic group was found in corpus callosum splenium, periventricular WM, fimbria hippocampi, cingulum, anterior commissure, internal capsule, optic tract, relative to sham/nonhypertonic group (Fig. 3). On the level of midbrain and pons, FA in hypertonic group was significantly lower in cerebral peduncle, medial lemniscus and cerebellum WM. High diffusion anisotropy in gray matter in cerebral cortex and hippocampus in newborn P1 rabbits gave rise to skeleton lines in the middle of cortex and cellular layer of hippocampus. FA was significantly decreased in hypertonic group in cerebral cortex, including motor and sensory areas, as well as in CA1 area of hippocampus. No voxels were found where FA in sham/nonhypertonic group was significantly less than in hypertonic group.
FIGURE 3:
Statistical parametric maps of comparison between sham/nonhypertonic and hypertonic P1 kits after E22 antenatal H-I using FA metric. Green skeleton is overlaid on gray scale FA map. Statistically significant voxels with corrected P-value less 0.05, where FA was less in hypertonic group, are depicted in red–yellow scale. Color bar indicates corrected-P-values range. cxm, cerebral cortex motor; cxs, cerebral cortex sensory; ccs, corpus callosum splenium; ic, internal capsule; sg, singulum; hp, hippocampus; fh, fimbria hippocampi; pvwm, periventricular WM; ot, optic tract; cp, cerebral peduncle; ml, medial lemniscus.
Decrease of WM Tracts’ Thicknesses in Projection, Commissural, and Limbic Tracts in P1 Kits With Hypertonia
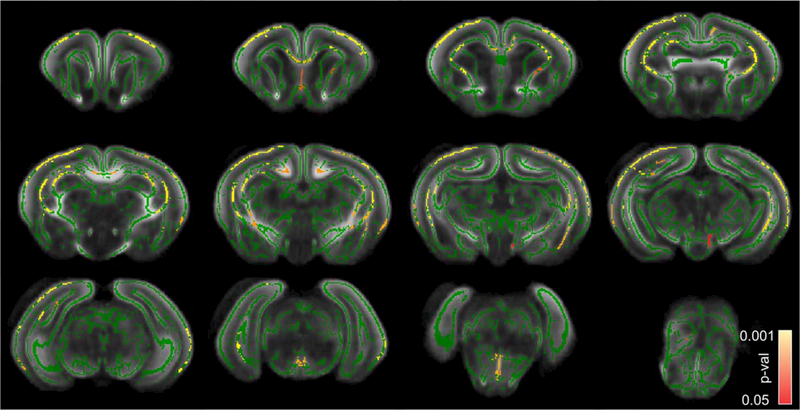
Comparison between sham/nonhypertonic and hypertonic P1 kits after E22 antenatal H-I using THICKNESS metric (Fig. 4) revealed a significant decrease in WM tracts’ thicknesses in callosum splenium and genu, periventricular WM, cingulum, similar to changes in FA maps on Figure 3. Noticeable differences between FA and THICKNESS statistical parametric maps were the absence of significant changes in THICKNESS in fimbria, lesser extent of significant changes in internal capsule, cerebral peduncle, and medial lemniscus, but a larger extent of significant changes in cerebral cortex. No voxels were found where THICKNESS metric in sham/nonhypertonic group that was significantly less than the one in hypertonic group.
FIGURE 4:
Statistical parametric maps of comparison between sham/nonhypertonic and hypertonic P1 kits after E22 antenatal H-I using THICKNESS metric. Color bar indicates corrected P-values.
A comparison between sham/nonhypertonic and hypertonic P1 kits after E22 antenatal H-I using FAx-THICKNESS metric (Fig. 5) revealed a significant decrease in the regions, where a decrease of FA coincided with the WM tracts’ thicknesses decrease, predominantly in corpus callosum, periventricular WM, as well as in cerebral cortex and hippocampus.
FIGURE 5:
Statistical parametric maps of comparison between sham/nonhypertonic and hypertonic P1 kits after E22 antenatal H-I using FAxTHICKNESS metric. Color bar indicates corrected P-values.
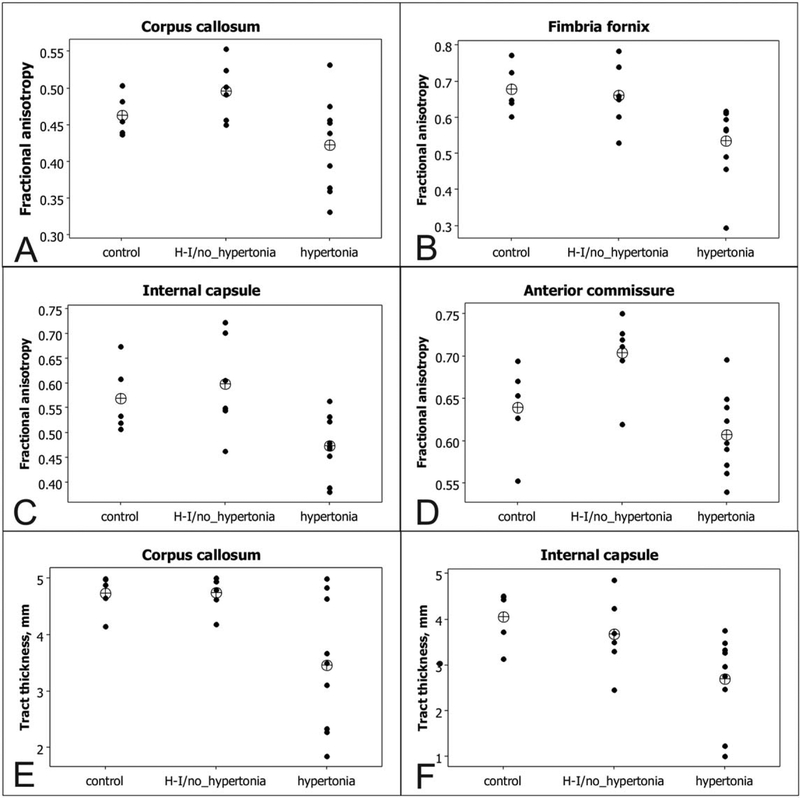
To further confirm the findings, ROIs were placed on selected WM tracts where significant differences were found on statistic parametric maps, obtained by TBSS analysis. Individual subject FAs and tracts’ thicknesses are plotted on Figure 6. Group comparisons (Table 1) using ANOVA Tukey’s post hoc method revealed significant differences between control and nonhypertonic groups versus hypertonic group, but no significant difference between control and nonhypertonic group.
FIGURE 6:
A–F: Individual subjects values of fractional anisotropy and tract thickness, obtained in selected WM tracts using ROI method. Group means are indicated as crossed circle.
TABLE 1.
Group Mean Values of Fractional Anisotropy and Tract Thickness, Obtained in Selected White Matter Tracts Using ROI Method
| WM tracts | Control | H-I/non-hypertonic | H-I/hypertonic | % Change hypertonic | p-value ANOVAa |
|---|---|---|---|---|---|
| FA | |||||
| Corpus callosum | 0.46±0.01 | 0.5±0.02 | 0.42±0.02 | 91.2% | 0.043 |
| Fimbria fornix | 0.68±0.03 | 0.66±0.04 | 0.53±0.04 | 78.9% | 0.019 |
| Internal capsule | 0.57±0.03 | 0.6±0.04 | 0.47±0.02 | 83.2% | 0.015 |
| Periventricular WM | 0.49±0.02 | 0.53±0.02 | 0.41±0.02 | 83.5% | 0.023 |
| Cingulum | 0.45±0.02 | 0.44±0.01 | 0.36±0.02 | 81.4% | 0.008 |
| Optic tract | 0.62±0.03 | 0.58±0.04 | 0.51±0.02 | 82.9% | 0.024 |
| Anterior commissure | 0.64±0.02 | 0.7±0.02 | 0.61±0.02 | 95.0% | 0.006 |
| Tract thickness, mm | |||||
| Corpus callosum | 0.71±0.02 | 0.71±0.02 | 0.52±0.06 | 73.3% | 0.013 |
| Fimbria fornix | 0.38±0.05 | 0.43±0.03 | 0.3±0.04 | 80.0% | 0.2634 |
| Internal capsule | 0.61±0.04 | 0.55±0.05 | 0.39±0.06 | 63.7% | 0.033 |
| Periventricular WM | 0.36±0.02 | 0.34±0.07 | 0.3±0.03 | 82.5% | 0.200 |
| Cingulum | 0.19±0.02 | 0.28±0.05 | 0.14±0.03 | 73.4% | 0.048 |
| Optic tract | 0.4±0.07 | 0.38±0.12 | 0.27±0.04 | 67.5% | 0.117 |
| Anterior commissure | 0.41±0.03 | 0.44±0.01 | 0.36±0.02 | 88.4% | 0.213 |
Values in bold type are significant.
Changes in FA and WM Tract Sizes Provide Complementary Information
Figure 7 depicts some brain areas where a significant decrease in hypertonic group was found with either FA or THICKNESS metrics, or both. FA metric selectively picked differences in internal capsule, fimbria hippocampus (Fig. 7A, yellow arrows), anterior commissure, and fimbria hippocampi (Fig. 7B,C, yellow arrows).The comparison using THICKNESS metrics showed more extensive differences in supplementary motor cortex, somatosensory and auditory cortex (Fig. 7A–C, blue arrows), and anterior portion of internal capsule. Periventricular WM had significant decrease in both FA and WM thickness in hypertonic group (Fig. 7A,C, green arrows). The presence of the regions where the difference between the groups were found using only one of the metrics suggests that the metrics are not redundant and may provide complementary information about perinatal brain injury and recovery.
FIGURE 7:
Brain regions with significantly larger values in sham/nonhypertonic than in hypertonic P1 kits using FA and THICKNESS metric on a coronal section on the level of corpus callosum genu (A), horizontal sections on the level of anterior commissure (B) and fimbria fornix (C). Pseudo color scale for P-values is in red–yellow for FA changes and in blue–light blue for THICKNESS changes. Green color indicates significant voxels for both FA and THICKNESS comparisons.
Discussion
The results of TBSS analysis confirmed a widespread reduction of FA and WM tracts’ thicknesses after antenatal H-I in newborn rabbits with hypertonia.6 In addition to the previously demonstrated decrease of FA and cross-section areas in selective tracts in this model using the ROI approach, the current study indicates global gray and WM injury, manifested as a decrease of FA and thickness in pyramidal tract (corona radiate, internal capsule, cerebral peduncles), commissural (callosum and anterior commissure), periventricular WM, and limbic (fimbria hippocampi, cingulum) tracts. Those results in the animal model of global antenatal hypoxic-ischemic injury, resulting in motor deficit in newborns, mimic widespread WM injury detected in pretermborn neonates. Widespread WM involvement, including motor and commissural tracts, correlated with adverse neurological outcome,21 as well as diffusely reduced fractional anisotropy in all WM tracts was found in preterm children with cerebral palsy.22
The decrease of FA and cross-section area in major WM tracts has been previously reported in corpus callosum, internal capsule, and corona radiata of the hypertonic kits in this rabbit model of antenatal H-I brain injury6 using ROI approach. A reduction in volume and loss of phosphorylated neurofilaments in the corpus callosum and internal capsule were observed on immunostaining and associated with hypertonia. Loss of unmyelinated fibers and myelination deficits were also found in hypertonic kits only.5 Presence of nonhypertonic kits in litters after antenatal H-I may be explained by nonuniform severity of the H-I insult and resistance of some fetuses to H-I.23,24 Alternatively, hypertonia may be attributed to the existence of a critical threshold of WM injury extent or to the injury in only specific regions. The latter hypothesis has been tested in the current study by comparing WM injury across the whole brain using TBSS approach. As a result, no isolated specific regions were found to be associated with hypertonia, but instead widespread WM injury was found in multiple tracts.
One of the study goals was to provide a method that allows regional and tract-specific assessment of microstructural and volumetric changes, that may be temporally discordant during perinatal period5 and thus provide a valuable diagnostic information of the injury evolution and recovery. A simple algorithm to estimate local WM tracts’ thickness was introduced that can be readily incorporated into TBSS analysis. The advantage of the proposed approach is that tracts’ thicknesses are estimated objectively, in a completely automatic manner without operator interference, and performed in native space, thus avoiding issues of warping and smoothing, that are inherent to the techniques based on registration to a template, such as TSA and VBM. At the same time, the measurements can be readily incorporated to the TBSS framework and take advantage of TBSS statistical power and robustness to the small WM tract misregistration. Once voxels are classified belonging to a WM tract, additional metrics of a chosen modality, such as crosssection mean intensity or SD, can be estimated and projected to the WM skeleton for statistical comparisons.
Several studies attempted to analyze and statistically compare WM tracts properties “along” the course of the tracts.22,25 WM tracts are extracted using deterministic or probabilistic tractography techniques applied to brain volumes in standard or native space. Diffusion properties (MD, FA, or directional diffusivities) are somehow averaged “along” fiber tract course and can be plotted in common space with reference to anatomical landmarks. If the number of voxels, belonging to a tract, is known in each point along the tract, it can be used as an index of the tract crosssection area at these points. The problem with such an approach, apart from the questionable ability to extract all voxels belonging to a tract, is that the majority of WM tracts in the brain are not tube-like, but mostly sheet-like and the tract properties representation cannot be unambiguously reduced to one dimensional case.26
An attempt of estimating WM tract volume by using number of streamlines, originating from tractography procedure, passing through an ROI, has no methodological and anatomical support.27 Alternatively, deformation-based techniques, such as VBM14 or TBM, can be used to compare local gray and WM volume differences, by comparing the amount of modulation, required to spatially normalize tissue class to a study template. VBM and TBM have been extensively used to assess gray matter changes, but less frequently used for WM analysis in newborns and infants.28,29 While being operator independent and objective, VBM relies on white–gray matter segmentation, which may be problematic in infants and neonates, creation of VM template, and smoothing data.30 Currently, TBM has the difficulty of computing very high resolution deformation fields, required for small scale comparisons of WM. The results of VBM and TBM in WM are not tract specific, while the proposed method attempts to count voxels with the similar directionality to estimate local WM tract thickness.
A framework of TSA uses the skeleton-based modeling of sheet-like WM fascicule using the continuous medial representation,26 which gives a natural definition of thickness and supports its comparison across subjects.31 TSA allows quantifying tract thickness as well as its microstructure and was used to reveal clusters of reduced thickness and FA in ALS patients’ internal capsule compared with healthy controls.15 TSA, however, relies on high resolution DTI data to build deformable geometric medial models of selected WM tracts that are extracted using a template-based or interactive tractography. TSA relies on tractography-based WM tract representation which requires operator involvement and essentially could be applied to only major well defined fiber tracts. The technique would be limited to a very few tracts in infant or animal datasets where even major tracts are only two to three voxels wide, and accurate estimation of tract boundaries is problematic. The method proposed in this study is essentially a simplification of the TSA concept, but does not rely on building a geometric model of WM tracts.
A limitation of the proposed approach to estimate local WM tract thickness is that it uses only local directional information and cannot resolve kissing/crossing situations in WM tracts. Tract thickness may be erroneously overestimated in regions where closely packed WM tracts are going in the same direction, such as in the brain stem or in the center of callosum and hippocampal commissures. Tract thickness may be erroneously underestimated in areas of crossing fibers, for example in the region where thalamocortical fibers cross the internal capsule. Accuracy of voxel assignment to a WM tract could be improved if global fiber tracking information from deterministic or probabilistic tractography is incorporated in the algorithm or a high angular resolution diffusion acquisition scheme is implemented to resolve kissing/crossing fibers.
Other study limitations include the relatively small number of animals in the groups and the use of fixed brain tissue. Application of TBSS analysis across the whole brain requires relatively high spatial resolution and near isotropic voxels to normalize brain volumes to a common template and resolve WM tracts’ voxels from the rest of the brain. High spatial resolution and necessity to achieve large signal-to-noise ratio resulted in long acquisition times. With the limited tolerance of newborn animals, especially after perinatal brain injury to long scans, we had to resolve to ex vivo imaging of fixed brains. Although FA values in normal brain tissue are considered to be essentially unchanged with fixation,32 the effect of tissue fixation on FA is not fully understood in the presence of various pathological changes.33 Tissue shrinkage is also a known effect of fixation. While the brains in all the studied groups were processed under the same protocol, one may expect larger tissue shrinkage in regions where tissue structural elements were lost to injury and the water contents is higher, thus affecting volumetric measurements. Future work with faster acquisition schemes, possibly with echo-planar imaging, and relaxed spatial criteria may allow in vivo imaging in neonatal imaging for the use of TBSS and other analytical methods requiring normalization to a template.
In conclusion, WM injury in hypertonic kits 10 days after fetal H-I, involving not only motor but also limbic and commissural fibers, is widespread and reflects global brain injury. The novel method of TBSS analysis of local WM demonstrated ability to assess changes independently in microstructure and in volumes of WM tracts after H-I injury. Thus, the method can be informative about structural changes during the disease progression.
Acknowledgement
Contract grant sponsor: Bill and Melinda Gates Foundation; contract grant number: 1119410.
Author thanks Dr. Kehuan Luo for the help with animal preparation.
References
- 1.van Kooij BJM, de Vries LS, Ball G, et al. Neonatal tract-based spatial statistics findings and outcome in preterm infants. AJNR Am J Neuroradiol 2012;33:188–194. [DOI] [PMC free article] [PubMed] [Google Scholar]
- 2.Inder TE, Huppi PS, Warfield S, et al. Periventricular white matter injury in the premature infant is followed by reduced cerebral cortical gray matter volume at term. Ann Neurol 1999;46:755–760. [DOI] [PubMed] [Google Scholar]
- 3.du Plessis AJ, Volpe JJ. Perinatal brain injury in the preterm and term newborn. Curr Opin Neurol 2002;15:151–157. [DOI] [PubMed] [Google Scholar]
- 4.Anjari M, Srinivasan L, Allsop JM, et al. Diffusion tensor imaging with tract-based spatial statistics reveals local white matter abnormalities in preterm infants. Neuroimage 2007;35:1021–1027. [DOI] [PubMed] [Google Scholar]
- 5.Drobyshevsky A, Jiang R, Lin L, et al. Unmyelinated axon loss with postnatal hypertonia after fetal hypoxia. Ann Neurol 2014;75: 533–541. [DOI] [PMC free article] [PubMed] [Google Scholar]
- 6.Drobyshevsky A, Derrick M, Wyrwicz AM, et al. White matter injury correlates with hypertonia in an animal model of cerebral palsy. J Cereb Blood Flow Metab 2007;27:270–281. [DOI] [PubMed] [Google Scholar]
- 7.Smith SM, Johansen-Berg H, Jenkinson M, et al. Acquisition and voxelwise analysis of multi-subject diffusion data with tract-based spatial statistics. Nat protoc 2007;2:499–503. [DOI] [PubMed] [Google Scholar]
- 8.Smith SM, Jenkinson M, Johansen-Berg H, et al. Tract-based spatial statistics: voxelwise analysis of multi-subject diffusion data. Neuroimage 2006;31:1487–1505. [DOI] [PubMed] [Google Scholar]
- 9.Woolrich MW, Jbabdi S, Patenaude B, et al. Bayesian analysis of neuroimaging data in FSL. Neuroimage 2009;45(Suppl):S173–S186. [DOI] [PubMed] [Google Scholar]
- 10.Smith SM, Jenkinson M, Woolrich MW, et al. Advances in functional and structural MR image analysis and implementation as FSL. Neuroimage 2004;23(Suppl 1):S208–S219. [DOI] [PubMed] [Google Scholar]
- 11.Drobyshevsky A, Song SK, Gamkrelidze G, et al. Developmental changes in diffusion anisotropy coincide with immature oligodendrocyte progression and maturation of compound action potential. J Neurosci 2005;25:5988–5997. [DOI] [PMC free article] [PubMed] [Google Scholar]
- 12.Drobyshevsky A, Jiang R, Derrick M, Luo K, Tan S. Functional correlates of central white matter maturation in perinatal period in rabbits. Exp Neurol 2014;261C:76–86. [DOI] [PMC free article] [PubMed] [Google Scholar]
- 13.Hawe RL, Dewald JP. Assessment of the contralesional corticospinal tract in early-onset pediatric hemiplegia: preliminary findings. Conf Proc IEEE Eng Med Biol Soc 2014;2014:5336–5339. [DOI] [PMC free article] [PubMed] [Google Scholar]
- 14.Mechelli A, Price CJ, Friston KJ, Ashburner J. Voxel-based morphometry of the human brain: methods and applications. Curr Med Imaging Rev 2005;1:105–113. [Google Scholar]
- 15.Zhang H, Awatea SP, Das SR, et al. A tract-specific framework for white matter morphometry combining macroscopic and microscopic tract features. Med Image Anal 2010;14:666–673. [DOI] [PMC free article] [PubMed] [Google Scholar]
- 16.Derrick M, Luo NL, Bregman JC, et al. Preterm fetal hypoxia-ischemia causes hypertonia and motor deficits in the neonatal rabbit: a model for human cerebral palsy? J Neurosci 2004;24:24–34. [DOI] [PMC free article] [PubMed] [Google Scholar]
- 17.Basser PJ, Jones DK. Diffusion-tensor MRI: theory, experimental design and data analysis - a technical review. NMR Biomed 2002;15: 456–467. [DOI] [PubMed] [Google Scholar]
- 18.Basser PJ, Mattiello J, LeBihan D. Estimation of the effective self-diffusion tensor from the NMR spin echo. J Magn Reson B 1994;103: 247–254. [DOI] [PubMed] [Google Scholar]
- 19.Mori S, van Zijl PC. Fiber tracking: principles and strategies - a technical review. NMR Biomed 2002;15:468–480. [DOI] [PubMed] [Google Scholar]
- 20.Friston KJ, Worsley KJ, Frackowiak RS, Mazziotta JC, Evans AC. Assessing the significance of focal activations using their spatial extent. Hum Brain Mapp 1994;1:210–220. [DOI] [PubMed] [Google Scholar]
- 21.Duerden EG, Foong J, Chau V, et al. Tract-based spatial statistics in preterm-born neonates predicts cognitive and motor outcomes at 18 months. AJNR Am J Neuroradiol 2015;36:1565–1571. [DOI] [PMC free article] [PubMed] [Google Scholar]
- 22.Ceschin R, Lee VK, Schmithorst V, Panigrahy A. Regional vulnerability of longitudinal cortical association connectivity: associated with structural network topology alterations in preterm children with cerebral palsy. Neuroimage Clin 2015;9:322–337. [DOI] [PMC free article] [PubMed] [Google Scholar]
- 23.Drobyshevsky A, Derrick M, Prasad PV, Ji X, Englof I, Tan S. Fetal brain magnetic resonance imaging response acutely to hypoxiaischemia predicts postnatal outcome. Ann Neurol 2007;61:307–314. [DOI] [PubMed] [Google Scholar]
- 24.Drobyshevsky A, Luo K, Derrick M, et al. Motor deficits are triggered by reperfusion-reoxygenation injury as diagnosed by MRI and by a mechanism involving oxidants. J Neurosci 2012;32:5500–5509. [DOI] [PMC free article] [PubMed] [Google Scholar]
- 25.Sierra A, Laitinen T, Lehtimaki K, Rieppo L, Pitkanen A, Grohn O. Diffusion tensor MRI with tract-based spatial statistics and histology reveals undiscovered lesioned areas in kainate model of epilepsy in rat. Brain Struct Funct 2011;216:123–135. [DOI] [PubMed] [Google Scholar]
- 26.Yushkevich PA, Zhang H, Gee JC. Continuous medial representation for anatomical structures. IEEE Trans Med Imaging 2006;25:1547–1564. [DOI] [PubMed] [Google Scholar]
- 27.Jones DK, Knosche TR, Turner R. White matter integrity, fiber count, and other fallacies: the do’s and don’ts of diffusion MRI. Neuroimage 2013;73:239–254. [DOI] [PubMed] [Google Scholar]
- 28.Giménez M, Miranda MJ, Born AP, Nagy Z, Rostrup E, Jernigan TL. Accelerated cerebral white matter development in preterm infants: a voxel-based morphometry study with diffusion tensor MR imaging. Neuroimage 2008;41:728–734. [DOI] [PubMed] [Google Scholar]
- 29.Shi J, Collignon O, Xu L, et al. Impact of early and late visual deprivation on the structure of the corpus callosum: a study combining thickness profile with surface tensor-based morphometry. Neuroinformatics 2015; 13:321–336. [DOI] [PMC free article] [PubMed] [Google Scholar]
- 30.Ashburner J, Friston KJ. Voxel-based morphometry—the methods. Neuroimage 2000;11:805–821. [DOI] [PubMed] [Google Scholar]
- 31.Yushkevich PA, Zhang H, Simon TJ, Gee JC. Structure-specific statistical mapping of white matter tracts. Neuroimage 2008;41:448–461. [DOI] [PMC free article] [PubMed] [Google Scholar]
- 32.Sun SW, Neil JJ, Song SK. Relative indices of water diffusion anisotropy are equivalent in live and formalin-fixed mouse brains. Magn Reson Med 2003;50:743–748. [DOI] [PubMed] [Google Scholar]
- 33.Sun SW, Neil JJ, Liang HF, et al. Formalin fixation alters water diffusion coefficient magnitude but not anisotropy in infarcted brain. Magn Reson Med 2005;53:1447–1451. [DOI] [PubMed] [Google Scholar]


