Abstract
The toxic effects and potential mechanisms of aflatoxin B1 (AFB1), aflatoxin M1 (AFM1), and AFB1+AFM1 in the kidney were studied and compared in HEK 293 cells model and CD-1 mice model. The 35-day subacute toxicity mice model was constructed, biochemical indicators and kidney pathological staining were detected, kidney metabonomics detection was performed, and the metabolites were analyzed, and then the related toxicity mechanism was validated. Results showed that AFB1 (0.5 mg/kg), AFM1 (3.5 mg/kg), and AFB1 (0.5 mg/kg)+AFM1 (3.5 mg/kg) activated oxidative stress and caused renal damage. The relative concentration of the metabolite L-proline was found to be lower in aflatoxins treatment groups when compared with the control (P < 0.05). Moreover, with the treatment of aflatoxins, proline dehydrogenase (PRODH) and proapoptotic factors (Bax, Caspase-3) were upregulated, while the inhibitor of apoptosis Bcl-2 was downregulated, at both the mRNA and the protein levels, comparing with the control (P < 0.05). In addition, the combined effect of AFB1 and AFM1 was validated, for the toxicity of the combination was stronger than the other two groups. In conclusion, AFB1 and AFM1 caused kidney toxicity by activating oxidative stress through altering expression of PRODH and L-proline levels, which then induced downstream apoptosis.
1. Introduction
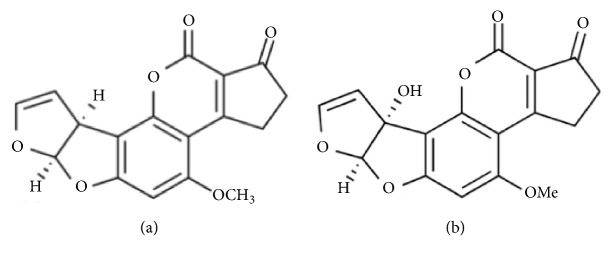
Aflatoxins (AFs) are secondary metabolites with high toxicity synthesized by Aspergillus flavus and Aspergillus parasiticus which are produced in various feedstuffs, including corn, cottonseed, peanuts, etc. [1, 2]. Aflatoxin B1 (AFB1, Figure 1(a)) is the most common and carcinogenic member in AF family, and IARC (International Agency for Research on Cancer) organization suggested that AFB1 should be classified to be a Group I carcinogen [3]. Another important member of the AF family, aflatoxin M1 (AFM1, Figure 1(b)), is the 4-hydroxy derivative of AFB1, and it can be derived from AFB1 in the liver by the action of hepatic microsomal cytochrome P450, from where it can enter the mammalian circulation and be excreted into the milk of animals in lactation [4–10]. AFM1 is also considered to be carcinogenic and harmful to humans (Group I, IARC) [11].
Figure 1.
Chemical structure of AFB1 and AFM1. (a) Structure of AFB1. (b) Structure of AFM1.
Apart from being a hazard for the poultry industries and domestic animals, AFs are a critical public health threat, being responsible for Reyes syndrome and acute and chronic liver failure [12]. The metabolic and toxic effects of AFB1 and AFM1 are principally observed in the liver [13–15]; the lung might also be a target organ after exposures of inhalation and diet, and indeed evidences from both laboratory and epidemiologic study validate a carcinogenic effect of AFB1 on human lung tissue [16, 17]. Moreover, several epidemiological studies implicate that AFB1 plays a role in the clinical incidence of gastroenteric tumors of Asians and Africans [18, 19]. Aflatoxins, especially AFB1 and AFM1, are also a pathogenic factor in child underweight, hypoimmunity, neurologic damage, and even high mortality [20]. However, studies investigating the effects of AFB1 or AFM1 on kidney function and revealing the related mechanism are rare.
It is reported that excretion of AFB1 and AFM1 occurs primarily through the biliary pathway, followed by the urinary pathway, and AFB1 could be detected in different levels in the kidney and urine of two calves with dosages of 0.8 mg and 1.8 mg /kg body weight, respectively [21]. However, the mechanism of the toxicity of the two AFs and their metabolites is still unclear.
Direct evidence for the exposure of humans to AFs by ingestion or another route has been found in a number of countries by identifying AFs or their metabolites in human biological samples [22–24]. Thus, it is becoming a pressing and necessary issue, not only for healthy adults, but also for nurslings, who are being directly exposed to food contaminated with AFs. Therefore, further research into the mechanism of AF toxicity is now necessary and urgent. The purpose of the present research was to investigate the toxic effects of AFB1 and AFM1 on the kidney tissue, and especially of the combination of the two, and to explore the mechanisms involved.
2. Materials and Methods
2.1. Chemicals and Reagents
Ninety-five percent pure AFB1 and AFM1 were purchased from Pribolab (Singapore). HEK 293 cells (a human epithelial kidney cell line) was obtained from the American Type Culture Collection Cells (ATCC, USA). Dulbecco's Modified Eagle Medium (DMEM) and fetal bovine serum (FBS) were purchased from GIBCO (USA), L-glutamine was purchased from ChemCatch (USA), and 1% penicillin/streptomycin was purchased from Thermo Fisher (USA). Cell counting kit-8 (CCK-8 kit) was purchased from Dojindo (Japan). ELISA detection kits for creatinine (Scr), urea (UREA), uric acid (UA), malondialdehyde (MDA), superoxide dismutase (SOD), and total antioxidant capacity (T-AOC) in mouse serum were purchased from Jiancheng (Nanjing, China). A hematoxylin-eosin (HE) staining kit, a total protein extraction kit, and TBST buffer were purchased from Solarbio, (Beijing, China). β-actin, proline dehydrogenase (PRODH), Δ1-pyrroline-5-carboxylate synthetase (P5CS), Δ1-pyrroline-5-carboxylate reductase (P5CR), B-cell lymphoma-2 (Bcl-2), Bcl-2 Associated X Protein (Bax), and cysteinyl aspartate specific proteinase 3 (Caspase-3) antibodies, and secondary antibody were purchased from Santa Cruz (USA), and ECL reagent was purchased from Thermo Fisher (USA).
2.2. Cell Culture and Viability Detection
HEK 293 cells were cultured with DMEM,10% FBS, 0.9% L-glutamine, and 1% penicillin/streptomycin, in a humidified incubator (Thermo, USA) at 37°C, in the presence of 5% CO2. They were exposed to AFB1, AFM1, or AFB1 + AFM1 at various concentrations (0-200 mg/L) and cocultured for 48 h; then the cell viability was quantified using a CCK-8 kit (Solarbio, Beijing) to choose the most appropriate dose for further experiments.
2.3. Animal Model
CD-1 mice were purchased from Beijing Vital River Laboratory Animal Technology Co., Ltd. (Beijing, China), with license number SCXK 2012-0001. Animals were fed in cages at 25°C with a relative humidity of 55%. The mice were acclimatized for at least seven days before commencement. All animal procedures were performed according to the Chinese guidelines for animal care, conforming to internationally accepted principles for the care and utilization of experimental animals. Animal experiments were approved by the Ethics Committee of the Chinese Academy of Agricultural Sciences (Beijing, China).
Thirty-two CD-1 mice (20 ± 2 g, male) were randomly divided into four groups: a control group (untreated), a 0.5 g/kg AFB1 group, a 3.5 g/kg AFM1 group, and a combination group (0.5 g/kg AFB1 + 3.5 g/kg AFM1), containing eight mice per group. AFB1 and AFM1 were dissolved in DMSO/ddH2O (final 1%/99%) [25]. The mice in the treatment groups were gavaged once per day (0.2 mL/ mice) for 28 days and then sacrificed on day 29. Blood samples were gathered from the retro-orbital plexus, and the kidney was dissected and frozen in liquid nitrogen for subsequent metabonomic analysis and histopathology.
One hundred milligrams of kidney sample was added to 1 mL tubes and incubated in 1 mL 50% methanol for 5 min, until they had completely dissolved. The suspensions were then centrifuged at 10,000 rpm for 10 min. The upper layer (800 μL) was collected into new 2 mL glass tubes and 5 μL sample was analyzed using a UHPLC Q-Orbitrap, triplicate measurements in each aliquots.
2.4. Histopathological Test
Kidney tissue was isolated and fixed in 4% paraformaldehyde for 48 h, before paraffin embedding and sectioning using a microtome (Leica, Germany). The sections were stained with HE and the histopathology assessed under a light microscope (Olympus, Japan), with photographs being taken at 200 × magnification.
2.5. Biochemical Analysis
Retro-orbital blood samples were centrifuged to collect serum (15 min at 3,000 rpm and 4°C) for the measurement of biochemical parameters, including creatinine (Scr), urea (UREA), uric acid (UA), malondialdehyde (MDA), superoxide dismutase (SOD), and total antioxidant capacity (T-AOC), which was undertaken using ELISA kits (Jiancheng, Nanjing).
2.6. Tissue Metabonomics Detection and Data Mining
Metabolites were separated in a UHPLC system (Dionex Ultimate 3000) equipped with a Waters Column (Acquity BEH C18 1.7 μm, 2.1 × 50 mm) at 40°C. The mobile phase consisted of water containing 0.1% formic acid and 2 mM ammonium formate (solvent a, v/v), and acetonitrile containing 0.1% formic acid and 2 mM ammonium formate (solvent b, v/v), with a flow rate of 250 μL/min, and the following gradient elution program: 0–1.0 min, 5% b; 1.0–5.0 min, 5% to 60% b; 5.0–8.0 min, 60% to 100% b; 8.0–11.0 min, 100% b; 11.0–14.0 min, 100% to 60% b; 14.0–15.0 min, 60% to 5% b; 15.0–18.0 min, 5% b. The Q-Exactive instrument (Thermo) equipped with electrospray ionization in positive and negative switching modes was utilized to detect the above samples, and the system was calibrated and controlled by Xcalibur 3.1 and Q-Exactive Tune software. The UHPLC Q-Orbitrap analysis can produce large amounts of raw data using TraceFinder software. The data was exported into Excel spreadsheets by Simca-P for PCA (principle components analysis), PLS-DA (partial least squares discriminant analysis), t-test, volcano plot, and VIP (variable importance in projection) plot analysis [26].
2.7. Quantitative Real-Time PCR Analysis
Fifty to two hundred nanograms of total RNA was extracted from mouse kidney using a TransZol Up Kit (ET111-01, TransGen Biotech, Beijing, China). The quantity and concentration of RNA were evaluated by 1.2% agarose gel electrophoresis and Nanodrop 2000 (Thermo Fisher, USA). The total RNA was transcribed into cDNA utilizing a High Capacity cDNA Archive Kit (Applied Biosystems, CA). Primers for the evaluated genes are listed in Table 1. Quantitative real-time RT-PCR (qRT-PCR) was performed in 96-well plates (0.5 μL (10 μM) forward primer, 0.5 μL (10 μM) reverse primer, 1 μL template cDNA (cDNA, 10–15ng/μL), 10 μL Universal Master Mix, and 8 μL of RNAse-free water), all reagents were obtained from Applied Biosystems by Life Technologies, USA. All qRT-PCR reactions were performed at 94°C for 30 s, followed by 40 cycles of 94°C for 5 s, and 62°C for 30 s, using two-step RT-PCR. All qRT-PCR reactions were performed on the ABI 7900 HT system and were conducted in triplicate to ensure methodological reproducibility.
Table 1.
Primers of the genes.
| Gene Name | Primer Sequences (5' → 3') | |
|---|---|---|
| Forward Primer | Reverse Primer | |
| P5CR | ATGTGCTCTTCCTGGCTGTGA | GCGTGAGTACCTGTGGCATAC |
| PRODH | CGTGGACTTGCTGGACTGGAA | CGGCTGATGGCTGGTTGGAA |
| P5CS | ATCATCTGGCTGACCTGCTGAC | GTGAAGAATGCGGTTGCTGTGT |
| GAPDH | CGTCCCGTAGACAAAATGGT | TTGATGGCAACAATCTCCAC |
2.8. Western Blotting Analysis
Total protein in cells or kidney tissue was extracted by a protein extraction kit (Solarbio, Beijing, China). After catalysis and heat treatment, the protein samples were separated on 12% SDS-polyacrylamide gels, the proteins were transferred onto nitrocellulose membranes with Trans-Blot machines (Bio-Rad), and the membranes were blocked with 2% BSA in TBST buffer for 1 h at 25°C. The membranes were then incubated with primary antibodies at 4°C overnight (targeting β-actin, PRODH, P5CR, P5CS, Bcl-2, Bax, and Caspase-3), with β-actin being used as an internal reference to confirm equal loading. After three washes with PBST buffer (15 min × 3), the membranes were incubated with secondary antibodies at 37°C for 1 h and then washed (15 min × 3). Finally, specific protein bands were detected using ECL reagent and analyzed using Image J software [27, 28].
2.9. Statistical Analysis
All the data are presented as mean ± SD. Data analysis was performed using GraphPad Prism 6.0 software (GraphPad, San Diego, USA). Statistical analysis was conducted using Student's t-test and One-Way Analysis of variance (ANOVA). P < 0.05 was considered to indicate a statistically significant difference between the control and treatment groups.
3. Results
3.1. AFB1, AFM1, and AFB1 + AFM1 Inhibit Viability of HEK 293 Cells
To investigate the effects of AFB1, AFM1, and AFB1 + AFM1 on the kidney cells, human embryonic kidney 293 (HEK 293) cells were utilized and viability of HEK 293 cells was detected using CCK-8 kit. At the same concentration, AFB1 showed a stronger inhibitory effect (26% in the 100 mg/L group) on cell viability than AFM1 (44% in the 100 mg/L group), both of which were within the linear dose-effect range. The combination of AFB1 and AFM1 also inhibited HEK 293 cell viability (21% in the 100 + 100 mg/L group), with a steeper dose-effect relationship than the other two groups (P < 0.05), suggesting that the combination of two aflatoxins with high dosage (100 mg/L or above) showed an enhanced suppressed effect on HEK 293 cells when compared with the single aflatoxin treatment group (Figure 2).
Figure 2.
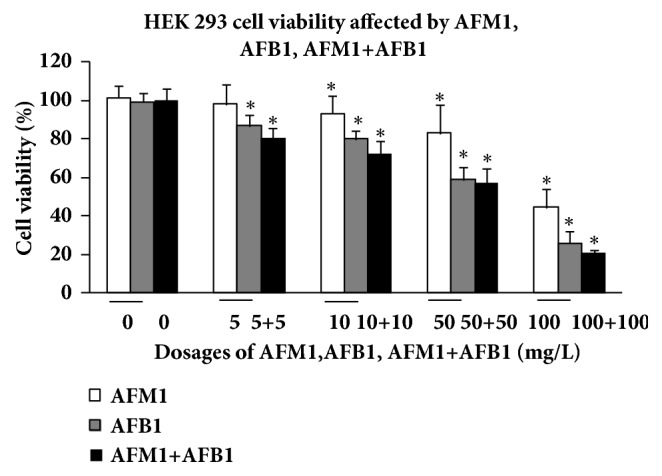
Comparison of HEK 293 cell viability affected by AFM1, AFB1, and AFM1+AFB1. The viability rate was represented as mean ± SD, ∗P < 0.05, compared with control (n=8), #P < 0.05, compared with control (n=8).
3.2. AFB1, AFM1, and AFB1 + AFM1 Affect Serum Biochemistry Indicators
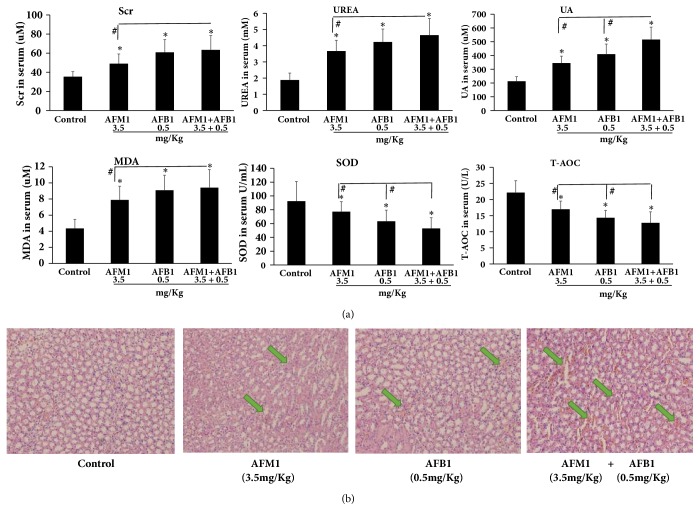
To evaluate the effect of the AFs on kidney function, mouse serum was collected and three markers were measured by ELISA. Twenty-eight days of AFB1, AFM1, or AFB1 + AFM1 administration caused sharp increases in creatinine (Scr), urea (UREA), and uric acid (UA) (all P < 0.05 versus control). To investigate the effect of AFs on oxidative stress, malondialdehyde (MDA), superoxide dismutase (SOD), and total antioxidant capacity (T-AOC) were measured in mouse serum; results revealed that MDA was upregulated and markedly higher, and SOD and T-AOC decreased and were significantly lower, when compared with the control group (P < 0.05). Furthermore, UA, SOD, and T-AOC in the AFB1 + AFM1 group changed significantly compared to the ones in the other two groups (P < 0.05), and Scr, UREA, and MDA in the AFB1 + AFM1 group increased significantly compared to the ones in the other two groups (P < 0.05) (Figure 3(a)).
Figure 3.
Kidney damage caused by AFM1, AFB1, and AFM1+AFB1: biochemical indicators in serum and kidney tissue HE staining. (a) Scr, UREA, UA, MDA, SOD, and T-AOC detection. The values of biochemical indicators were represented as mean ± SD, ∗P < 0.05, compared with control groups; #P < 0.05, compared with AFM1 treatment group (n=8). (b) Kidney tissue pathological detection by pathological staining with hematoxylin and eosin. The pathological pictures were captured at 200 × magnification, and the blue arrows showed the injury area.
3.3. AFB1, AFM1, and AFB1 + AFM1 Induce Kidney Pathology
To further investigate the effects of AFs on kidney, HE staining of histological sections was performed; results showed that aflatoxins caused obvious injury in kidney tissue. Compared with the control group, some areas of sections in AFB1-treated and AFB1 + AFM1-treated groups demonstrated edema and cytomorphosis, and occasional severe inflammatory cell infiltration and hemorrhage, whereas the renal injury induced by AFM1 was less severe (Figure 3(b)).
3.4. Metabonomics Analysis
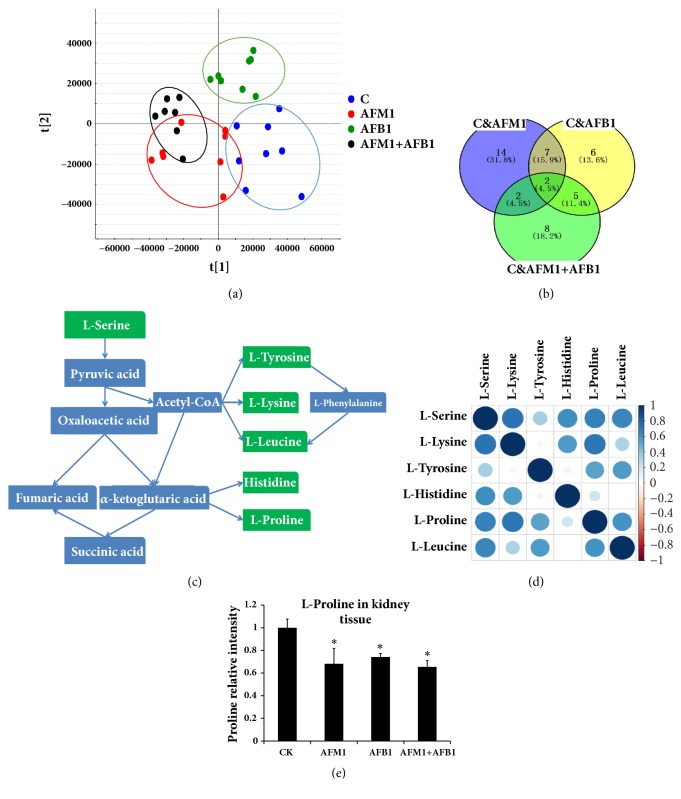
To evaluate the effect of the two aflatoxins on kidney metabolism, the metabonomic detection of kidney tissue from mice treated with AFB1, AFM1, or AFB1 + AFM1 was performed. The metabolites clustering in the AF-treated groups was clearly different from those in the control (Figure 4(a), OPLS-DA scores plot), indicating that sample treatment and data analysis were stable and valid. By comparing the levels of metabolites among the four groups, twenty-five metabolites were found to be changed significantly in AFM1 treatment group when compared with the control, twenty metabolites were expressed significantly in AFB1 treatment group when compared with the control, and seventeen metabolites were screened out in AFM1 group comparing with the AFB1. Finally, two metabolites with VIP value ≥ 1 (L-proline and creatinine) were identified by overlapping three parts of the above results (Figure 4(b), VENN diagram).
Figure 4.
Tissue metabonomics detection and different metabolites analysis. (a) OPLS-DA scores plot. (b) VENN plot. (c) Amino acid metabolic pathway. (d) Relation spot. The depth of colours and the size of the circle stand for value of the correlation: the darker the colour, the bigger the circle; the correlation index was higher. (e) L-proline detection in kidney tissue by mass spectrum. All the data was represented as mean ± SD, ∗P < 0.05, compared with the control (CK) (n=8).
In addition to L-proline, L-serine, L-lysine, L-tyrosine, L-histidine, and L-leucine were all shown in the overlapping area between the AFM1 and AFB1 groups, and the relevant metabolic pathway and relation spot were shown in Figures 4(c) and 4(d). The concentrations of these amino acids were lower in the three aflatoxin treatment groups when compared with the control. The level of L-proline in the four groups was measured by mass spectrometry; results showed that L-proline concentration was lower in AF-treated samples (P < 0.05) than the control level, and there were no obvious differences between the AFB1 + AFM1 group and the other two groups (Figure 4(e)).
3.5. Toxic Effects of AFB1, AFM1, and AFB1 + AFM1 on Kidney via PRODH
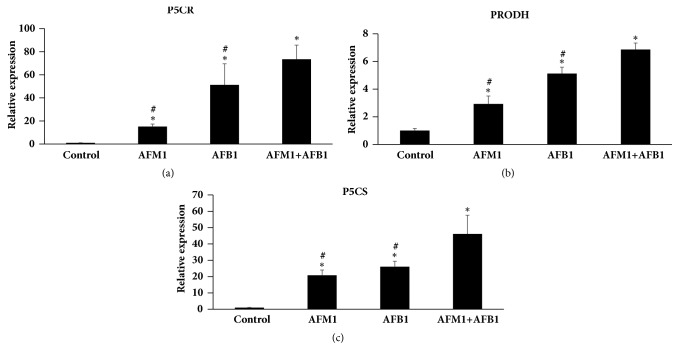
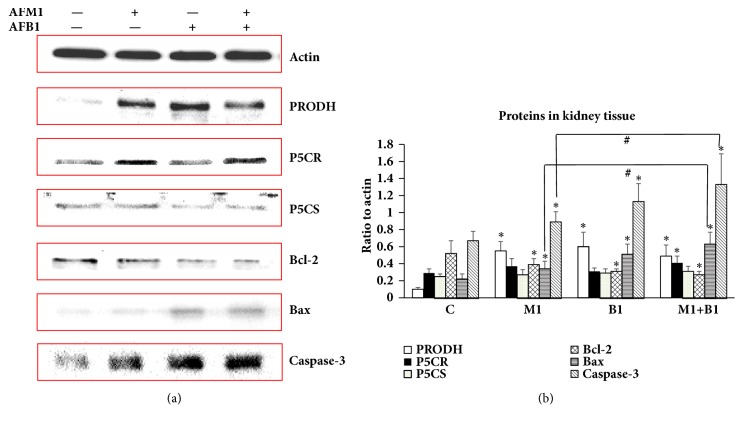
To further investigate the toxic mechanism of the two AFs and to validate the relationship between L-proline and AFB1/AFM1, the expressions of P5CR, P5CS, and PRODH were measured in kidney. q-PCR analysis showed that mRNA expressions of all three factors were higher in the AF-treatment groups than the control (P < 0.05), and their expressions in the combined treatment group were much higher than in the other two aflatoxins treatment groups (P < 0.05) (Figure 5). Results of western blotting detection showed that addition of AFB1, AFM1, or AFB1 + AFM1 also significantly increased protein levels of PRODH, Bcl-2, Bax, and Caspase-3 (P < 0.05), while expressions of P5CR and P5CS were not affected, suggesting that PRODH might be the target of the AFs (Figure 6).
Figure 5.
Detection of PRODH/P5CR/P5CS in kidney tissue by q-PCR. (a) The level of P5CR. (b) The level of PRODH. (c) The level of P5CS. All the value was represented as mean ± SD, ∗P < 0.05, compared with control; #P < 0.05, compared with the one in (AFB1+AFM1) group (n=8).
Figure 6.
Detection of PRODH/P5CR/P5CS/Bcl-2/Bax/Caspase-3 in kidney tissue by western blotting. (a) Gray bands of PRODH/P5CR/P5CS/Bcl-2/Bax/Caspase-3 in western blotting. (b) Quantification of expression levels of PRODH/P5CR/P5CS/Bcl-2/Bax/Caspase-3 by Image J Software. All the values were represented as mean ± SD, ∗P < 0.05, compared with control; #P < 0.05, compared with the one in (AFB1+AFM1) group (n=8).
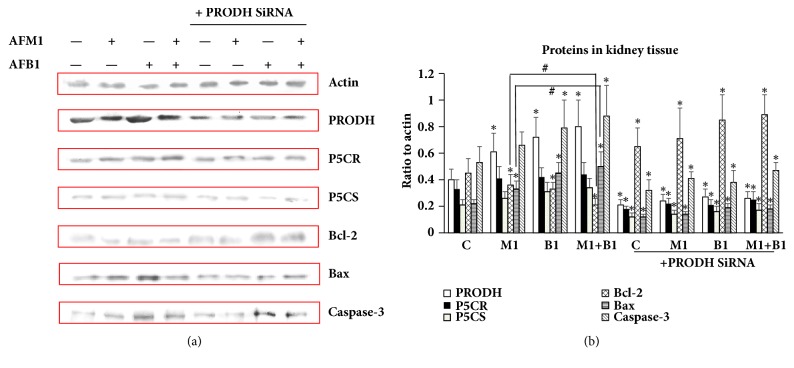
After transfection with PRODH siRNA, the levels of these proteins were markedly lower (P < 0.05) than in the control cells, and when AFs were then added to the cells, the expression of the above proteins did not increase significantly compared to the PRODH siRNA group (Figure 7). These data indicate that PRODH is a direct target of AFs, and that it is responsible for activating downstream apoptosis pathways.
Figure 7.
Detection of PRODH/P5CR/P5CS/Bcl-2/Bax/Caspase-3 in HEK 293 cells by western blotting. (a) Gray bands of PRODH/P5CR/P5CS/Bcl-2/Bax/Caspase-3 in western blotting. (b) Quantification of expression levels of PRODH/P5CR/P5CS/Bcl-2/Bax/Caspase-3 by Image J Software. All the values were represented as mean ± SD, ∗P < 0.05, compared with control; #P < 0.05, compared with the one in (AFB1+AFM1) group (n=8).
4. Discussion
Based on the biochemical measurements demonstrating the presence of higher concentrations of Scr, UREA, and UA, long-term administration of AFs was shown to cause renal damage, which might involve inflammation, cell necrosis, and toxicosis [29–39]. Our histological findings were consistent with renal injury caused by AFs and were in accordance with the biochemical data. Together, these results confirmed that the kidney was one of the main target organs of AFs and indicate that several metabolites might be transferred, produced, or degraded in the kidney, such as proline, which was validated to be a special metabolite in kidney in the present study.
AFs are potent carcinogenic and genotoxic compounds, which exert toxic effects through DNA damage and mutations leading to oxidative damage. With regard to the mechanism of oxidative damage caused by AFs, cell inactivation by proteasomes was regarded as a part of the cellular defense against oxidative stress, and AFB1 and AFM1 were reported to be the most potent activators of proteasome activity [40–43]. In the current study, malondialdehyde (MDA), superoxide dismutase (SOD), and total antioxidant capacity (T-AOC) in mouse serum were measured by ELISA, and it was found that MDA was markedly higher, and that SOD and T-AOC were much lower in AF-treated mice. As a peroxide produced by free radicals, MDA tissue content reflects the degree of oxidative damage [44]. In our study, aflatoxins induced oxidative stress as evidenced by peroxidation of lipids and MDA in the serum. SOD is a classical antioxidant enzyme in various organisms which converts superoxide anion radicals to hydrogen peroxide and protects organisms from oxidative injury. T-AOC reflects the activity of all the antioxidants in an organism and thus is an indicator of overall antioxidative activity [45, 46]. Aflatoxins in our model resulted in releasing free radicals especially superoxide anions in kidney tissue; lots of T-AOC factors including SOD in serum were recruited into the tissue, resulting in downregulation of T-AOC and SOD in serum. The effects of AFs on these parameters are thus consistent with their activation of oxidative reactions in the mice.
Proline is a metabolite of AFB1 and AFM1, and we found that its concentration was significantly lower in mice treated with these AFs than the control mice. Previous studies suggest that, in addition to providing energy, metabolism of proline affects oxidative stress in various organisms [47–53]. Rai et al. found that proline alleviates damage from reactive oxygen species, rather than improving the antioxidant defense system, when cells are placed under metal stress [54]. Krishnan et al. also reported that proline protected cells against H2O2, tert-butyl hydroperoxide, and a carcinogenic oxidative stress inducer [47]. It is reported that, in Gram-negative bacteria, the proline utilization A flavoenzyme containing PRODH and P5C dehydrogenase domains in a single polypeptide could catalyze the oxidation of L-proline to glutamate [55]. Therefore, proline improves oxidative stress tolerance in E. coli by a preadaptive effect involving the production of endogenous hydrogen peroxide and the enhancement of catalase-peroxidase bioactivity [52]. Here, PRODH activity was shown to increase in response to AFs, along with caspase and Bax, suggesting induction of apoptotic cell death.
In our study, PRODH mRNA and protein were significantly higher in AF-treated mice, and cell apoptosis in kidney tissue was also significantly activated, embodied on changing expressions of Bcl-2, Bax, and Caspase-3. Proline concentrations were lower in kidney tissue from AF-treated mice, which was likely the result of PRODH upregulation. PRODH siRNA treatment was used to determine whether PRODH is the direct target of AFs, and we found that the expression of P5CS, P5CR, and proapoptotic factors was no different in AF-treated and siRNA-treated cells, and in cells that were treated with PRODH siRNA alone. These findings confirm that the two AFs activate oxidative reactions and have a toxic effect on mouse kidney, mainly through a reduction in the level of their metabolite, proline, which is regulated by PRODH. In addition, we have shown that downstream apoptotic factors including Bcl-2, Bax, and Caspase-3 are impacted by PRODH siRNA treatment.
Previous research showed that AFB1 and AFM1 acted synergistically with hepatitis B virus (HBV), which resulted in the increased risk of liver carcinoma by 12-fold, while Zhang H. demonstrated similar effects of AFB1 and AFM1 in various cell types [56–58]. Then we found that the sequence of overall toxicity and oxidative damage degree of AF-treated groups was AFB1+AFM1 > AFB1 > AFM1, suggesting that the two aflatoxins might act synergistically, which deserved more attention and data in the further research.
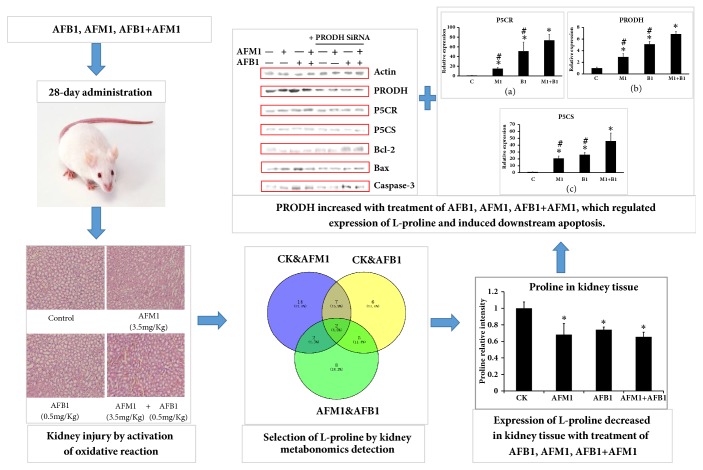
In summary, we have identified a key metabolite of AFB1 and AFM1 treatment, L-proline, by metabonomic screening of liver extracts from mice treated with either AF or a combination. We have also shed light on the effect of the upstream sensor PRODH, which regulates the level of L-proline, leading to kidney damage through the induction of oxidative stress and apoptosis. As Figure 8 (TOC Graphic) showed, L-proline will be utilized to detoxify kidney damage caused by aflatoxins in mice model, and the related mechanism and specific action sites will be revealed and validated through transcriptomics detection and bioinformatic analysis. These findings improve our understanding of the risks associated with the ingestion of AFs and their metabolites and imply that the guidelines for food safety evaluation and AF limits in standard formulations should be modified accordingly.
Figure 8.
TOC Graphic. With the 28-day administration of AFB1, AFM1, and AFB1+AFM1, mice serum biochemical indicators changed significantly; mice kidney tissue showed injury with different degrees, when compared with the control, indicating AFB1, AFM1, and AFB1+AFM1 caused kidney damage and activated oxidative reaction. Through metabonomics detection of kidney tissue, L-proline was verified to be the key metabolite in kidney tissue in response to these aflatoxins. Then in mechanism exploration part, PRODH was validated to be the upstream regulator of L-proline, which also induced downstream apoptosis.
Acknowledgments
This work was supported by two key labs and several grants. The authors acknowledge financial support from two Agriculture-Key Labs, Ministry of Agriculture-Key Laboratory of Quality & Safety Control for Milk and Dairy Products, Institute of Animal Science, Ministry of Agriculture-Laboratory of Quality and Safety Risk Assessment for Dairy Products, China. The authors especially acknowledge Beijing Qiji Biotechnology Co., Ltd., especially scientists from the company who provided them with omics detection and high-level data analysis. This work was supported by Special Fund for Agro-Scientific Research in the Public Interest (201403071), the Ministry of Modern Agro-Industry Technology Research System of China (CARS-36), and the Agricultural Science and Technology Innovation Program (ASTIP-IAS12).
Abbreviations
- AFB1:
Aflatoxin B1
- AFM 1:
Aflatoxin M1
- PRODH:
Proline dehydrogenase
- P5CS:
Δ1-Pyrroline-5-carboxylate synthetase
- P5CR:
Δ1-Pyrroline-5-carboxylate reductase
- Bcl-2:
B-Cell lymphoma-2
- Bax:
Bcl-2 Associated X Protein
- Caspase-3:
Cysteinyl aspartate specific proteinase 3.
Data Availability
The data used to support the findings of this study are included within the article.
Disclosure
The authors alone are responsible for the content and writing of the paper.
Conflicts of Interest
The authors report no conflicts of interest.
References
- 1.Ronchi B., Danieli P., Vitali A., Sabatini A., Bernabucci U., Nardone A. Evaluation of AFB1/AFM1 carry-over in lactating goats exposed to different levels of AFB1 contamination. Book of Abstracts of the 56th Annual Meeting of the European Association for Animal Production; 2005; Uppsala, Sweden; [Google Scholar]
- 2.Battacone G., Nudda A., Palomba M., Pascale M., Nicolussi P., Pulina G. Transfer of aflatoxin B1 from feed to milk and from milk to curd and whey in dairy sheep fed artificially contaminated concentrates. Journal of Dairy Science. 2005;88(9):3063–3069. doi: 10.3168/jds.S0022-0302(05)72987-8. [DOI] [PubMed] [Google Scholar]
- 3.Bedard L. L., Massey T. E. Aflatoxin B1-induced DNA damage and its repair. Cancer Letters. 2006;241(2):174–183. doi: 10.1016/j.canlet.2005.11.018. [DOI] [PubMed] [Google Scholar]
- 4.van Egmond H. P., Dragacci S. Liquid chromatographic method for aflatoxin M1 in milk. Methods in Molecular Biology (Clifton, N.J.) 2001;157:59–69. doi: 10.1385/1-59259-064-0:59. [DOI] [PubMed] [Google Scholar]
- 5.Pong R. S., Nogan G. N. Toxicity and biochemical and fine structural effects of synthetic aflatoxin M1 and B1 in rat liver. Journal of the National Cancer Institute. 1971;47:585–590. [PubMed] [Google Scholar]
- 6.Lafont P., Siriwardana M. G., Lafont J. Genotoxicity of hydroxy-aflatoxins M1 and M4. Microbiologie Aliments Nutrition. 1989;7(1):1–8. [Google Scholar]
- 7.Chou M. W., Tung T. Aflatoxin B1 in the excretion of aflatoxin poisoned rats. Taiwan yi xue hui za zhi. Journal of the Formosan Medical Association. 1969;68(8):389–391. [PubMed] [Google Scholar]
- 8.Allcroft R., Rogers H., Lewis G., Nabney J., Best P. E. Metabolism of aflatoxin in sheep: Excretion of the 'milk toxin'. Nature. 1966;209(5019):154–155. doi: 10.1038/209154a0. [DOI] [PubMed] [Google Scholar]
- 9.Who G. E. IARC Monographs on the Evaluation of Carcinogenic Risk to Humans, Vol. 56, Some Naturally Occurring Substances: Food Items and Constituents, Heterocyclic Aromatic Amines and Mycotoxins. Analytica Chimica Acta. 1994;294(3):p. 341. doi: 10.1016/0003-2670(94)80328-5. [DOI] [Google Scholar]
- 10.Chen B.-Q., Liu H.-L., Meng F.-B. Current situation and development direction of digital image processing technology. Journal of Jishou University (Natural Science Edition) 2009;30(1):63–70. [Google Scholar]
- 11.Dai Y., Huang K., Zhang B., Zhu L., Xu W. Aflatoxin B1-induced epigenetic alterations: An overview. Food and Chemical Toxicology. 2017;109:683–689. doi: 10.1016/j.fct.2017.06.034. [DOI] [PubMed] [Google Scholar]
- 12.Tchana A. N., Moundipa P. F., Tchouanguep F. M. Aflatoxin contamination in food and body fluids in relation to malnutrition and cancer status in Cameroon. International Journal of Environmental Research and Public Health. 2010;7(1):178–188. doi: 10.3390/ijerph7010178. [DOI] [PMC free article] [PubMed] [Google Scholar]
- 13.Cui X., Muhammad I., Li R., et al. Development of a UPLC-FLD Method for Detection of Aflatoxin B1 and M1 in Animal Tissue to Study the Effect of Curcumin on Mycotoxin Clearance Rates. Frontiers in Pharmacology. 2017;8:p. 650. doi: 10.3389/fphar.2017.00650. [DOI] [PMC free article] [PubMed] [Google Scholar]
- 14.Chiavaro E., Cacchioli C., Berni E., Spotti E. Immunoaffinity clean-up and direct fluorescence measurement of aflatoxins B1 and M1 in pig liver: Comparison with high-performance liquid chromatography determination. Food Additives & Contaminants: Part A. 2005;22(11):1154–1161. doi: 10.1080/02652030500307115. [DOI] [PubMed] [Google Scholar]
- 15.Hayes R. B., van Nieuwenhuize J. P., Raatgever J. W., Ten Kate F. J. W. Aflatoxin exposures in the industrial setting: An epidemiological study of mortality. Food and Chemical Toxicology. 1984;22(1):39–43. doi: 10.1016/0278-6915(84)90050-4. [DOI] [PubMed] [Google Scholar]
- 16.Dvorackova I., Stora C., Ayraud N. Evidence for aflatoxin B1 in two cases of lung cancer in man. Journal of Cancer Research and Clinical Oncology. 1981;100(2):221–224. doi: 10.1007/BF00403368. [DOI] [PubMed] [Google Scholar]
- 17.Kelly J. D., Eaton D. L., Guengerich F. P., Coulombe R. A., Jr. Aflatoxin B1 activation in human lung. Toxicology and Applied Pharmacology. 1997;144(1):88–95. doi: 10.1006/taap.1997.8117. [DOI] [PubMed] [Google Scholar]
- 18.Abdel-Wahhab M. A., Ibrahim A., El-Nekeety A. A., Hassan N. S., Mohamed A. A. Panax ginseng C.A. Meyer extract counteracts the oxidative stress in rats fed multi-mycotoxins-contaminated diet. Comunicata Scientiae. 2012;3(3):143–153. [Google Scholar]
- 19.World Health Organisation. Impacts of Aflatoxins on Health and Nutrition. Report of an Expert Group Meeting; 2006. [Google Scholar]
- 20.Sabino M., Milanez T. V., Purchio A. Aflatoxins b1, m1 and aflatoxicol in tissues and urine of calves receiving aflatoxin. Food Additives & Contaminants: Part A. 1995;12(3):467–472. doi: 10.1080/02652039509374331. [DOI] [PubMed] [Google Scholar]
- 21.Polychronaki N., Wild C. P., Mykkänen H., et al. Urinary biomarkers of aflatoxin exposure in young children from Egypt and Guinea. Food and Chemical Toxicology. 2008;46(2):519–526. doi: 10.1016/j.fct.2007.08.034. [DOI] [PubMed] [Google Scholar]
- 22.Turner P. C., Collinson A. C., Cheung Y. B., et al. Aflatoxin exposure in utero causes growth faltering in Gambian infants. International Journal of Epidemiology. 2007;36(5):1119–1125. doi: 10.1093/ije/dym122. [DOI] [PubMed] [Google Scholar]
- 23.Jolly P., Jiang Y., Ellis W., et al. Determinants of aflatoxin levels in Ghanaians: Sociodemographic factors, knowledge of aflatoxin and food handling and consumption practices. International Journal of Hygiene and Environmental Health. 2006;209(4):345–358. doi: 10.1016/j.ijheh.2006.02.002. [DOI] [PubMed] [Google Scholar]
- 24.Ribichini F., Graziani M., Gambaro G., et al. Early creatinine shifts predict contrast-induced nephropathy and persistent renal damage after angiography. American Journal of Medicine. 2010;123(8):755–763. doi: 10.1016/j.amjmed.2010.02.026. [DOI] [PubMed] [Google Scholar]
- 25.Wang J., Tang L., Glenn T. C., Wang J.-S. Aflatoxin B1 induced compositional changes in gut microbial communities of male F344 rats. Toxicological Sciences. 2016;150(1):54–63. doi: 10.1093/toxsci/kfv259. [DOI] [PMC free article] [PubMed] [Google Scholar]
- 26.Li Y., Jin Y., Yang S., et al. Strategy for comparative untargeted metabolomics reveals honey markers of different floral and geographic origins using ultrahigh-performance liquid chromatography-hybrid quadrupole-orbitrap mass spectrometry. Journal of Chromatography A. 2017;1499:78–89. doi: 10.1016/j.chroma.2017.03.071. [DOI] [PubMed] [Google Scholar]
- 27.Zhang Y., Stefanovic B. Akt mediated phosphorylation of LARP6; Critical step in biosynthesis of type i collagen. Scientific Reports. 2016;6 doi: 10.1038/srep22597.22597 [DOI] [PMC free article] [PubMed] [Google Scholar]
- 28.Madan E., Gogna R., Pati U. p53 Ser15 phosphorylation disrupts the p53-RPA70 complex and induces RPA70-mediated DNA repair in hypoxia. Biochemical Journal. 2012;443(3):811–820. doi: 10.1042/BJ20111627. [DOI] [PubMed] [Google Scholar]
- 29.Mahdavi-Mazdeh M., Abdollahi A., Heshmati B. N., Sobhani Z. Comparison of serum and urine neutrophil gelatinase-associated lipocalin (NGAL) with serum creatinine in prediction of kidney suitability for transplantation. Nephro-Urology Monthly. 2013;5(1):679–682. doi: 10.5812/numonthly.5002. [DOI] [PMC free article] [PubMed] [Google Scholar]
- 30.Kwak H.-S., Lee Y.-H., Han Y.-M., Jin G.-Y., Kim W., Chung G.-H. Comparison of renal damage by iodinated contrast or gadolinium in an acute renal failure rat model based on serum creatinine levels and apoptosis degree. Journal of Korean Medical Science. 2005;20(5):841–847. doi: 10.3346/jkms.2005.20.5.841. [DOI] [PMC free article] [PubMed] [Google Scholar]
- 31.Levin A. Cystatin C, serum creatinine, and estimates of kidney function: Searching for better measures of kidney function and cardiovascular risk. Annals of Internal Medicine. 2005;142(7):586–588. doi: 10.7326/0003-4819-142-7-200504050-00016. [DOI] [PubMed] [Google Scholar]
- 32.Wang L. The Significance of Cys-C UREA and Scr Tests in Early Renal Damage Assessment of Acute Glomerulonephritis. Labeled Immunoassays and Clinical Medicine. 2017;4:422–424. [Google Scholar]
- 33.Olearczyk J. J., Quigley J. E., Mitchell B. C., et al. Administration of a substituted adamantyl urea inhibitor of soluble epoxide hydrolase protects the kidney from damage in hypertensive Goto-Kakizaki rats. Clinical Science. 2009;116(1):61–70. doi: 10.1042/CS20080039. [DOI] [PMC free article] [PubMed] [Google Scholar]
- 34.Chu Z., Zhou F., Lu G. To compare the change of the test results of cystatin C and Urea nitrogen, Creatinine in different degree kidney damage. Medical Forum. 2014;18:4258–4260. [Google Scholar]
- 35.Reátegui-Sokolova C., Ugarte-Gil M. F., Gamboa-Cárdenas R. V., et al. Serum uric acid levels contribute to new renal damage in systemic lupus erythematosus patients. Clinical Rheumatology. 2017;36(4):845–852. doi: 10.1007/s10067-017-3538-4. [DOI] [PubMed] [Google Scholar]
- 36.Suzuki K., Konta T., Kudo K., et al. The association between serum uric acid and renal damage in a community-based population: The Takahata study. Clinical and Experimental Nephrology. 2013;17(4):541–548. doi: 10.1007/s10157-012-0743-y. [DOI] [PubMed] [Google Scholar]
- 37.Esfahanizadeh N., Rokn A. R., Paknejad M., Motahari P., Daneshparvar H., Shamshiri A. R. Comparison of lateral window and osteotome techniques in sinus augmentation: histological and histomorphometric evaluation. Journal of Dentistry. 2012;9(3):237–246. [PMC free article] [PubMed] [Google Scholar]
- 38.Solbu M. D., Norvik J. V., Storhaug H. M., et al. The Association between Adiponectin, Serum Uric Acid and Urinary Markers of Renal Damage in the General Population: Cross-Sectional Data from the Tromsø Study. Kidney and Blood Pressure Research. 2016;41(5):623–634. doi: 10.1159/000447931. [DOI] [PubMed] [Google Scholar]
- 39.Alpsoy L., Yildirim A., Agar G. The antioxidant effects of vitamin A, C, and E on aflatoxin B1-induced oxidative stress in human lymphocytes. Toxicology & Industrial Health. 2009;25(2):121–127. doi: 10.1177/0748233709103413. [DOI] [PubMed] [Google Scholar]
- 40.El-Nekeety A. A., Mohamed S. R., Hathout A. S., Hassan N. S., Aly S. E., Abdel-Wahhab M. A. Antioxidant properties of Thymus vulgaris oil against aflatoxin-induce oxidative stress in male rats. Toxicon. 2011;57(7-8):984–991. doi: 10.1016/j.toxicon.2011.03.021. [DOI] [PubMed] [Google Scholar]
- 41.Narasaiah K. V., Sashidhar R. B., Subramanyam C. Biochemical analysis of oxidative stress in the production of aflatoxin and its precursor intermediates. Mycopathologia. 2006;162(3):179–189. doi: 10.1007/s11046-006-0052-7. [DOI] [PubMed] [Google Scholar]
- 42.Amici M., Cecarini V., Pettinari A., et al. Binding of aflatoxins to the 20S proteasome: Effects on enzyme functionality and implications for oxidative stress and apoptosis. biological chemistry. 2007;388(1):107–117. doi: 10.1515/BC.2007.012. [DOI] [PubMed] [Google Scholar]
- 43.Najeeb Q., Bhaskar N., Masood I., Wadhwa S., Kaur H., Ishaq S. Malondialdehyde (MDA) Superoxide dismutase (SOD) levels-distinguishing parameters betweenbenign malignant pleural effusions. Free Radicals & Antioxidants. 2012;2:8–11. [Google Scholar]
- 44.Liu S. X., Li C. G., Dai D. L. Effect of Ligustrazine on MDA, SOD and T-AOC in Erythrocyte Membrane in Patients with Hemoglobin H Disease. Journal of Clinical Experimental Medicine. 2010;11 [Google Scholar]
- 45.Xiang Y., Chen G., Wang S. J., Fang Y. J., Cai R. J., Deng Q. K. The effect of various pulse amplitudes on the amount of SOD, MDA, and T-AOC in the diaphagm of rabbit atter diaphragm pacing. Chinese Journal of Physical Medicine Rehabilitation. 2004;26:269–271. [Google Scholar]
- 46.Kanski J., Aksenova M., Schöneich C., Butterfield D. A. Substitution of isoleucine-31 by helical-breaking proline abolishes oxidative stress and neurotoxic properties of Alzheimer's amyloid β-peptide. Free Radical Biology & Medicine. 2002;32(11):1205–1211. doi: 10.1016/s0891-5849(02)00821-3. [DOI] [PubMed] [Google Scholar]
- 47.Krishnan N., Dickman M. B., Becker D. F. Proline modulates the intracellular redox environment and protects mammalian cells against oxidative stress. Free Radical Biology & Medicine. 2008;44(4):671–681. doi: 10.1016/j.freeradbiomed.2007.10.054. [DOI] [PMC free article] [PubMed] [Google Scholar]
- 48.Rai V., Vajpayee P., Singh S. N., Mehrotra S. Effect of chromium accumulation on photosynthetic pigments, oxidative stress defense system, nitrate reduction, proline level and eugenol content of Ocimum tenuiflorum L. Journal of Plant Sciences. 2004;167(5):1159–1169. doi: 10.1016/j.plantsci.2004.06.016. [DOI] [Google Scholar]
- 49.Tripathi B. N., Gaur J. P. Relationship between copper- and zinc-induced oxidative stress and proline accumulation in Scenedesmus sp. Planta. 2004;219(3):397–404. doi: 10.1007/s00425-004-1237-2. [DOI] [PubMed] [Google Scholar]
- 50.Chen C., Wanduragala S., Becker D. F., Dickman M. B. Tomato QM-like protein protects Saccharomyces cerevisiae cells against oxidative stress by regulating intracellular proline levels. Applied and Environmental Microbiology. 2006;72(6):4001–4006. doi: 10.1128/AEM.02428-05. [DOI] [PMC free article] [PubMed] [Google Scholar]
- 51.Khan M. I. R., Nazir F., Asgher M., Per T. S., Khan N. A. Selenium and sulfur influence ethylene formation and alleviate cadmium-induced oxidative stress by improving proline and glutathione production in wheat. Journal of Plant Physiology. 2015;173:9–18. doi: 10.1016/j.jplph.2014.09.011. [DOI] [PubMed] [Google Scholar]
- 52.Zhang L., Alfano J. R., Becker D. F. Proline metabolism increases katG expression and oxidative stress resistance in Escherichia coli. Journal of Bacteriology. 2015;197(3):431–440. doi: 10.1128/jb.02282-14. [DOI] [PMC free article] [PubMed] [Google Scholar]
- 53.Karayiorgou M. Proline Oxidase (PRODH). Chromium(VI), Oxidative Cell Damage. John Wiley & Sons; 2002. [Google Scholar]
- 54.Sumithra K., Jutur P. P., Carmel B. D., Reddy A. R. Salinity-induced changes in two cultivars of Vigna radiata: Responses of antioxidative and proline metabolism. Plant Growth Regulation. 2006;50(1):11–22. doi: 10.1007/s10725-006-9121-7. [DOI] [Google Scholar]
- 55.Srivastava D., Schuermann J. P., White T. A., et al. Crystal structure of the bifunctional proline utilization A flavoenzyme from Bradyrhizobium japonicum. Proceedings of the National Acadamy of Sciences of the United States of America. 2010;107(7):2878–2883. doi: 10.1073/pnas.0906101107. [DOI] [PMC free article] [PubMed] [Google Scholar]
- 56.Sun Z., Chen T., Thorgeirsson S. S., et al. Dramatic reduction of liver cancer incidence in young adults: 28 Year follow-up of etiological interventions in an endemic area of China. Carcinogenesis. 2013;34(8):1800–1805. doi: 10.1093/carcin/bgt007. [DOI] [PMC free article] [PubMed] [Google Scholar]
- 57.Zhang H. Cytotoxicity and degradation of mycotoxins in Milk [M.S. thesis] Jilin, China: Jilin University; 2017. [Google Scholar]
- 58.Zhang J. Cytotoxic effects of main mycotoxins in milk and feed on Caco-2 cells [M.S. thesis] Gansu, China: Gansu Agricultural University; 2015. [Google Scholar]
Associated Data
This section collects any data citations, data availability statements, or supplementary materials included in this article.
Data Availability Statement
The data used to support the findings of this study are included within the article.


