

Abstract
Hepatocyte proliferation during liver regeneration is a well-coordinated process regulated by the activation of several growth factor receptors, including the insulin receptor (IR). The IR can be localized in part to cholesterol-enriched membrane microdomains, but the role of such domains in insulin-mediated events in hepatocytes is not known. We investigated whether partitioning of IRs into cholesterol-enriched membrane rafts is important for the mitogenic effects of insulin in the hepatic cells. IR and lipid rafts were labeled in HepG2 cells and primary rat hepatocytes. Membrane cholesterol was depleted in vitro with metyl-β-cyclodextrin (MβCD) and in vivo with lovastatin. Insulin-induced calcium (Ca2+) signals studies were examined in HepG2 cells and in freshly isolated rat hepatocytes as well as in whole liver in vivo by intravital confocal imaging. Liver regeneration was studied by 70% partial hepatectomy (PH), and hepatocyte proliferation was assessed by PCNA staining. A subpopulation of IR was found in membrane microdomains enriched in cholesterol. Depletion of cholesterol from plasma membrane resulted in redistribution of the IR along the cells, which was associated with impaired insulin-induced nuclear Ca2+ signals, a signaling event that regulates hepatocyte proliferation. Cholesterol depletion also led to ERK1/2 hyper-phosphorylation. Lovastatin administration to rats decreased hepatic cholesterol content, disrupted lipid rafts and decreased insulin-induced Ca2+ signaling in hepatocytes, and delayed liver regeneration after PH. Therefore, membrane cholesterol content and lipid rafts integrity showed to be important for the proliferative effects of insulin in hepatic cells.
NEW & NOTEWORTHY One of insulin’s actions is to stimulate liver regeneration. Here we show that a subpopulation of insulin receptors is in a specialized cholesterol-enriched region of the cell membrane and this subfraction is important for insulin’s proliferative effects.
Keywords: calcium signaling, hepatocytes, insulin signaling, lipid rafts, liver regeneration
INTRODUCTION
The process of cell proliferation during liver regeneration is mediated largely by several growth factors, which act through specific receptor tyrosine kinases (RTKs) to restore liver function after either liver damage or resection (13, 26). Insulin is one of such growth factors, but the mechanism by which it regulates cell proliferation is less well understood when compared with hepatocyte growth factor (HGF) and epidermal growth factor (EGF) (9). RTK-induced hepatocyte proliferation depends on increases in nucleoplasmic Ca2+ (44), which is mediated by inositol 1,4,5-trisphosphate (InsP3). This pathway is activated when RTKs involved in cell proliferation translocate from the plasma membrane to the nucleus to locally generate InsP3 and increase intracellular Ca2+ (2, 18, 44, 47).
The mechanism by which the RTKs translocate to the nucleus varies among the different growth factors. Translocation of the HGF receptor (c-met) to the nucleus depends on the adaptor protein Gab1 and importin β1 (18). In contrast, EGF receptor (EGFR) internalization occurs in a dynamin/clathrin-dependent manner (9), while the insulin receptor (IR) reaches the nuclear compartment in a clathrin/caveolin-dependent event (2). Even though the internalization pathways differ among these receptors, at the plasma membrane each RTK is suggested to be differentially associated with cholesterol-enriched membrane microdomains known as lipid rafts (42, 53, 68). Lipid rafts are dynamic assemblies of cholesterol and sphingolipids in the lipid bilayer that can include or exclude proteins to variable extents, working as signaling scaffolds for a number of receptors (53). Association of IR to lipid rafts in the membrane has been described in preadipocytes in which these structures are essential for insulin-induced cell metabolism (48). In addition, caveolae, which are a subtype of lipid rafts, participate in the functioning and endocytosis of the IR (2, 12, 55). Moreover, depleting caveolin in hepatocytes, the major raft protein involved in the assembly of caveolae, significantly reduces translocation of IR to the nucleus and cell proliferation (2). However, the effect of cholesterol depletion on insulin-mediated Ca2+ signaling and the importance of cell membrane integrity for liver regeneration and insulin signaling are so far unknown. Here we investigated the role of cholesterol-enriched membrane microdomains in hepatocyte insulin signaling and liver regeneration.
MATERIALS AND METHODS
Animals.
Male Wistar rats (200 g) obtained from Centro de Bioterismo-Federal University of Minas Gerais (CEBIO-UFMG, Minas Gerais, Brazil) were used for all studies. Animals were maintained on a standard diet and housed under a 12-h light-dark cycle. All procedures were approved by the Ethics Committee in Animal Experimentation of UFMG and followed National Institutes of Health Guidelines For The Care And Use Of Laboratory Animals.
Cells and cell culture.
The liver cancer cell line HepG2 was obtained from the American Type Culture Collection (ATCC HB-8065). Cells were cultured at 37°C in 5% CO2 in DMEM (Invitrogen/Thermo Fisher Scientific, Carlsbad, CA) supplemented with 10% fetal bovine serum, 1 mM sodium pyruvate, 50 units/ml penicillin, and 50 mg/ml streptomycin. Rat hepatocytes were isolated from livers of male Wistar rats (200 g; CEBIO-UFMG). Briefly, livers from control and lovastatin-treated animals were perfused with Hank’s A and then Hank’s B medium containing 0.05% collagenase (Roche Applied Science, Indianapolis, IN) and passed through a 40-µm nylon mesh filter. Primary hepatocytes were cultured at 37°C in 5% CO2-95% O2 in Williams’ medium E (Invitrogen/Thermo Fisher Scientific, Carlsbad, CA) containing 10% fetal bovine serum, 50 units/ml penicillin, and 50 g/ml streptomycin and plated on collagen-coated coverslips (50 μg/ml; BD Biosciences, San Jose, CA). Hepatocytes were used 4–6 h after isolation, as previously described (14). The round shape of the cells is the proper and well-accepted morphology of this cell type to study calcium and other intracellular signaling events in hepatocytes in vitro. Hepatocytes viability was greater than 85% assessed by trypan blue exclusion test.
To disrupt the cholesterol-bearing lipid rafts in vitro, hepatocytes or HepG2 cells were incubated with 10 mM metyl-β-cyclodextrine (MβCD) or (2-hydroxypropyl)-γ-cyclodextrin (HYCD) for 45 min at 37°C (40, 46, 50). Control dishes were treated with culture medium alone.
Detection of Ca2+ signals.
Cells were loaded with 6 µM Fluo-4/AM (Invitrogen, Grand Island, NY) for 30 min at 37°C in 5% CO2. Then, coverslips containing the cells were transferred to a custom-built perfusion chamber on the stage of a Zeiss LSM 510 confocal microscope. Nuclear and cytosolic Ca2+ signals were monitored in individual cells during stimulation with 300 nM insulin, 100 nM AVP, 50 ng/ml EGF, or 100 ng/ml HGF (Sigma, St. Louis, MO) using a ×63, 1.4 NA objective lens, as previously described (14, 17, 18). Changes in fluorescence were normalized by the initial fluorescence (F0) and were expressed as (F/F0) × 100 (11, 29).
Imaging Ca2+ signaling in vivo.
Control or lovastatin-treated rats were starved for 6–8 h and then submitted to a surgical procedure for in vivo liver imaging as previously described (32). All the experiments were performed according to the circadian timing of the animal. Then, livers were loaded with the Ca2+ probe Fluo-4/AM at 50 µM in saline solution for 10 min by soaking the organ into a chamber containing the probe. Careful preparation of the Fluo-4 AM dye, as well as optimization of incubation time and temperature, were necessary to ensure an optimal labeling of the organ. Ca2+ signals were detected and measured by time-lapse confocal microscopy (Nikon A1). Insulin (600 nM) was injected intravenously during 2 min after 30 s of imaging, and changes in fluorescence were normalized by the initial fluorescence (F0) and expressed as (F/F0) × 100. Another control group was constituted of nontreated animals injected with saline instead of insulin (data not shown).
Immunobloting.
HepG2 cells and primary hepatocytes were harvested as described, and protein content was quantified according to Bradford protein assay. Whole cell protein lysate (25 µg) was separated by 12% SDS-PAGE gel. For protein detection, specific primary antibodies against IR (rabbit, 1:1,000; Abcam, Cambidge, UK), β-actin (mouse, 1:1,000; Santa Cruz Biotechnology, Dallas, TX), Caveolin-1 (rabbit, 1:1,000; Santa Cruz Biotechnology, Dallas, TX), ERK1/2-pERK1/2 (mouse, 1:1,000; Abcam, Cambridge, UK) and AKT-p-AKT (rabbit, 1:1,000; Sigma-Aldrich) were used. The primary antibody incubation proceeded for 2 h at room temperature. After being washed, blots were incubated with horseradish peroxidase-conjugated specific secondary antibody (anti-mouse or anti-rabbit, 1:5,000; Sigma-Aldrich) at room temperature for 1 h. Immuno detection was carried out using enhanced chemiluminescence. Western blot digital images (8-bit) were used for densitometric analysis in ImageJ (National Institutes of Health, Bethesda, MD). In brief, the mean gray value, expressed in arbitrary units for each band, was calculated by subtracting the mean gray value of a region of interest in a background area from the mean gray value of individual ROIs of identical dimensions encompassing each individual band. To measure relative phosphorylation of ERK1/2, cell protein lysates (25 μg/lane) were separated in parallel in two gels. The first gel was used to probe for the phosphorylated form of ERK1/2 (pERK1/2), and the second gel was used to detect total ERK1/2 (ERK total). The relative expression of pERK1/2 was then calculated by dividing the densitometric values of pERK1/2 by those of ERK total. Western blot analysis was performed with protein extracts from three independent experimental conditions.
Immunofluorescence.
Confocal immunofluorescence was performed as previously described (11). To microscopically visualize membrane domains enriched with GM1, a marker of cholesterol-enriched microdomains, hepatocytes or HepG2 cells were plated onto coverslips and incubated for 10 min with CTxB-Alexa 555 (1 g/ml) (goat, 1:250; Cayman Chemical, Ann Harbor, MI), washed, and then incubated for 10 min with anti-CTxB antibody for the same time for patching. After being washed, cells were fixed with paraformaldehyde (4% in PBS) at 25°C for 20 min. Cells were then labeled with the specific primary antibodies against c-met (mouse, 1:250; Abcam), EGFR (rabbit, 1:250; Abcam), or IR (rabbit, 1:250; Abcam) and subsequently incubated with appropriate fluorescent secondary antibody conjugated to Alexa 488 (1:5,000) (Invitrogen, Grand Island, NY). For Cav-1 labeling in tissue, liver sections from control and lovastatin-treated animals were fixed in 10% neutral buffered formalin and embedded in paraffin. Five-micromolar tissue sections were dewaxed, and antigen retrieval was performed in citrate buffer containing 0.6% hydrogen peroxide. Then, sections were incubated overnight anti-Cav-1 (rabbit, 1:200; Santa Cruz Biotechnology, Dallas, TX) and subsequently incubated with a specific secondary antibody conjugated to Alexa 555 (Invitrogen, Grand Island, NY). Images were obtained using a Zeiss LSM 510 confocal microscope using a ×63, 1.4 NA objective lens. Single slices were collected with a length of 0.2 µm. Z-stacks were reconstructed from a 30-slice image. At least 20 slices from 30 cells of each group were individually analyzed in different regions of interest at the cell membrane. Fluorescence intensity of each slice and channel were quantified using ImageJ (National Institutes of Health).
MTT assay.
MTT assay is widely used for measuring the metabolic activity of cells based on their reduction potential. Studies in mammalian cells showed that the reduced pyridine nucleotide cofactor NADH is responsible for most MTT reduction (4). Therefore, to perform the assay, 104 HepG2 cells were seeded per well in a 96-well plate with 200 μl of DMEM containing 10% FBS, 1% antibiotic-antimitotic and kept for 24 h. Cultured cells were exposed to 10 mM MβCD or HYCD for 45 min. After the exposition period, the drugs were removed and 60 μl of fresh medium were added in each well. Then, 50 μl of 2H-tetrazolium (Thermo Fisher Scientific, Walthan, MA) solution (5 mg/ml) were added and the cells were incubated for 4 h. Afterwards, 40 μl of SDS solution/4% HCl were placed and incubated for 12 h. Absorbance was quantified at 595 nm in a spectrophotometer. For each experimental condition, four different measurements were taken.
Glucose quantification.
Glucose content in the blood or media was measured using an enzymatic colorimetric assay method (Analisa, Belo Horizonte, Brazil), according to the manufacturer’s instructions. Concentration was calculated through the equation: (standard concentration/standard absorbance) × sample absorbance and expressed by percentage of control (2).
Measurement of bromodeoxyuridine incorporation.
Cell proliferation was measured by bromodeoxyuridine (BrdU) incorporation using an enzyme linked immunosorbent assay (Roche Applied Science, Indianapolis, IN), according to the manufacturer’s instructions. HepG2 cells were plated in 96-well culture plates, starved for 24 h after adhered, and then treated with MβCD or HγCD for 45 min. Cells were then treated with 10% serum or different concentrations of insulin (300, 600, 1,200 nM) for 15 min, washed with PBS, and subsequently incubated with BrdU labeling solution in serum-free medium. BrdU incorporation was measured with a multiplate reader after 16 h, as described previously (2).
Lovastatin treatment and partial hepatectomy.
Animals were treated intraperitoneally with saline solution or 15 mg·kg−1·day−1 of lovastatin solution during 14 days before partial hepatectomy (PH) (5). The 70% PH was performed in adult male Wistar control and lovastatin-treated rats, as described (2, 23). Animals continued to be administrated with saline or lovastatin until the day of death. After 48 or 120 h of regeneration, livers were surgically removed and analyzed for measurement of liver/body weight ratio and cell proliferation index. Livers of nontreated and nonhepatectomized animals subjected to surgical stress (sham) were considered as controls.
Quantification of serum and liver cholesterol.
Liver samples were collected during hepatectomy and submitted to lysis for 1.5 h in a 4°C ice-cold buffer solution containing 100 mM Tris·HCl (pH 8.0), 150 mM NaCl, 2 mM MgCl2, 1% Triton X-100, 5 mM iodoacetamide, 0.025% NaN3, 1 mM PMSF, 1 mM di-isopropylfluorophosphate, and 0.02 U/ml of aprotinin, with gentle stirring. Then, lysates were submitted to the Folch lipid extraction method, as described previously (14). For serum cholesterol analysis, blood samples were collected previously to the hepatectomy surgery, centrifuged and also submitted to Folch lipid extraction (14). Dried nonpolar lipids were subjected to cholesterol quantification using an Amplex Red Cholesterol Assay Kit (Invitrogen, Carlsbad, CA) according to the manufacturer’s instructions.
Immunohistochemistry.
Sections from sham, control, and lovastatin-treated animals’ livers were fixed in 10% neutral buffered formalin and embedded in paraffin. Sections of 5μm were dewaxed and antigen retrieval was performed in citrate buffer containing 0.6% hydrogen peroxide. Nonspecific binding was blocked with 10% normal goat serum. Then, liver sections were immunostained with PCNA antibodies (1:50; DAKO Corporation, England, UK) or anti-insulin antibody (1:100, Abcam, Cambridge, UK) for 2 h at room temperature. After being washed in Tris·HCl buffer, sections were incubated for 30 min at room temperature with the byotinylated Link Universal Streptavidin-HRP (DAKO). The reactions were revealed by applying 3,3′-diaminobenzidine in chromogenic solution (DAKO). Sections were mounted in Hydromount (Fisher Scientific, Leicestershire, UK). Controls in which primary antibodies were omitted showed no specific staining. Histological images were obtained on a micro-camera (Olympus Q-color 5) coupled to a light microscope (Olympus BX43), captured with a plan-apochromatic objective (×20), and analyzed with Image-Pro Plus 4.5 (Media Cybernetics). To evaluate proliferation pattern, slice fields were randomly selected and a binary image was created to perform automatic quantification of positive PCNA nuclei.
Statistics.
Results are expressed as mean values ± SD. Prism (GraphPad, La Jolla, CA) was used for data analysis. Groups of data were compared using Student’s t-test or one-way ANOVA (which was used because data sets included only one independent variable) followed by Bonferroni posttests, and P < 0.05 was taken to indicate statistical significance.
RESULTS
The IR resides in cholesterol-enriched membrane microdomains.
Insulin regulates multiple effects in the liver, including metabolism and hepatocyte proliferation (2, 37). It has been suggested that membrane integrity and spatial localization of the IR in the plasma membrane are key regulators of insulin-mediated signaling events (63). Therefore, to investigate whether the IR is associated with cholesterol-enriched membrane domains, primary rat hepatocytes and HepG2 cells were stained for IR and the lipid raft marker GM1 and visualized by confocal microscopy. We observed that IR colocalizes with GM1 in both cell types (Fig. 1, A and C, top, and D). The peak of fluorescence emission intensity for IR and GM1, captured in a 0.2 µm-single-slice image, confirmed the close proximity of IR with GM1-enriched membrane microdomains (Fig. 1B, top left, and E). Besides insulin, other growth factors such as EGF and HGF are well known to regulate proliferation in hepatocytes (37). In addition, the EGF receptor is also localized to these membrane domains in different cancer cell lines (27, 30, 63, 67). However, less is known about the membrane location of EGFR and c-met in hepatocytes. We observed that, similar to the IR, EGFR colocalizes with GM1-enriched membrane area, while c-met does not (Fig. 1A, middle and bottom, and Fig. 1B, top right for EGFR and bottom for c-met). Therefore, the degree of association between RTKs and cholesterol-enriched domains at the plasma membrane varies among different receptors.
Fig. 1.

The insulin receptor (IR) is located in membrane microdomains enriched in cholesterol. A: representative confocal immunofluorescence of a single confocal slice of the IR, epidermal grwoth factor receptor (EGFR), and c-Met receptors (each receptor was labeled in green at left) and GM1 ganglioside labeled in red (middle) in HepG2 cells. Merged images show colocalization of IR and EGFR with GM1 but not c-Met with GM1 (right). B: quantification of fluorescence intensity on regions of interest, as represented by the tiny white squares in A. Superposition of the peaks indicates colocalization of green and red structures. (At least 20 slices from 30 cells of each group were individually analyzed). C: single confocal plane images of rat hepatocytes labeled for IR in green and GM1 in red (top) and z-stack images of the same cells (bottom). Merged images show colocalization of IR with GM1. D: high-resolution images of 3 regions of interest showing colocalization of green (IR) and red (GM1) structures. E: quantification of fluorescence intensity on delimited membrane regions of interest selected from several single slices of the merged images represented on D (representative small squares). Superposition of the peaks indicates colocalization of green and red structures. (At least 20 slices from 30 cells imaged of each group were individually analyzed). Scale bar = 10 µM.
Disruption of lipid rafts redistributes the IR in hepatocytes and impairs insulin-induced Ca2+ signaling.
IR activation in hepatocytes leads to InsP3-dependent nucleoplasmic Ca2+ signaling that induces proliferation (2, 47). In 3T3-L1 preadipocytes, inhibition of cholesterol biosynthesis disrupts lipid rafts, which affects IR activation (48). Thereby, we tested whether disruption of lipid rafts through cholesterol depletion would affect insulin signaling in the liver. Cells were treated with 10 mM MβCD for 45 min. MβCD efficiently disrupted GM1-enriched microdomains, as expected (46), observed by the reduction of fluorescence intensity and change in the pattern of cholera toxin labeling (Fig. 2, A and B). MβCD treatment did not affect cell viability (Fig. 2, C and D). Triton-X treatment was used as a positive control and treatment with HYCD, an inactive analogue of MβCD (46), was used as negative control (Fig. 2, C and D). A reduction in the cell surface area labeled with IR was also observed (Fig. 2, E–H). To exclude the possibility of IR sequestration by MβCD, we performed Western blot of the cells after treatment with the drug. As observed, this IR reorganization was not due to a reduction of the total content IR in the cell, as demonstrated by Western blot (Fig. 2I).
Fig. 2.
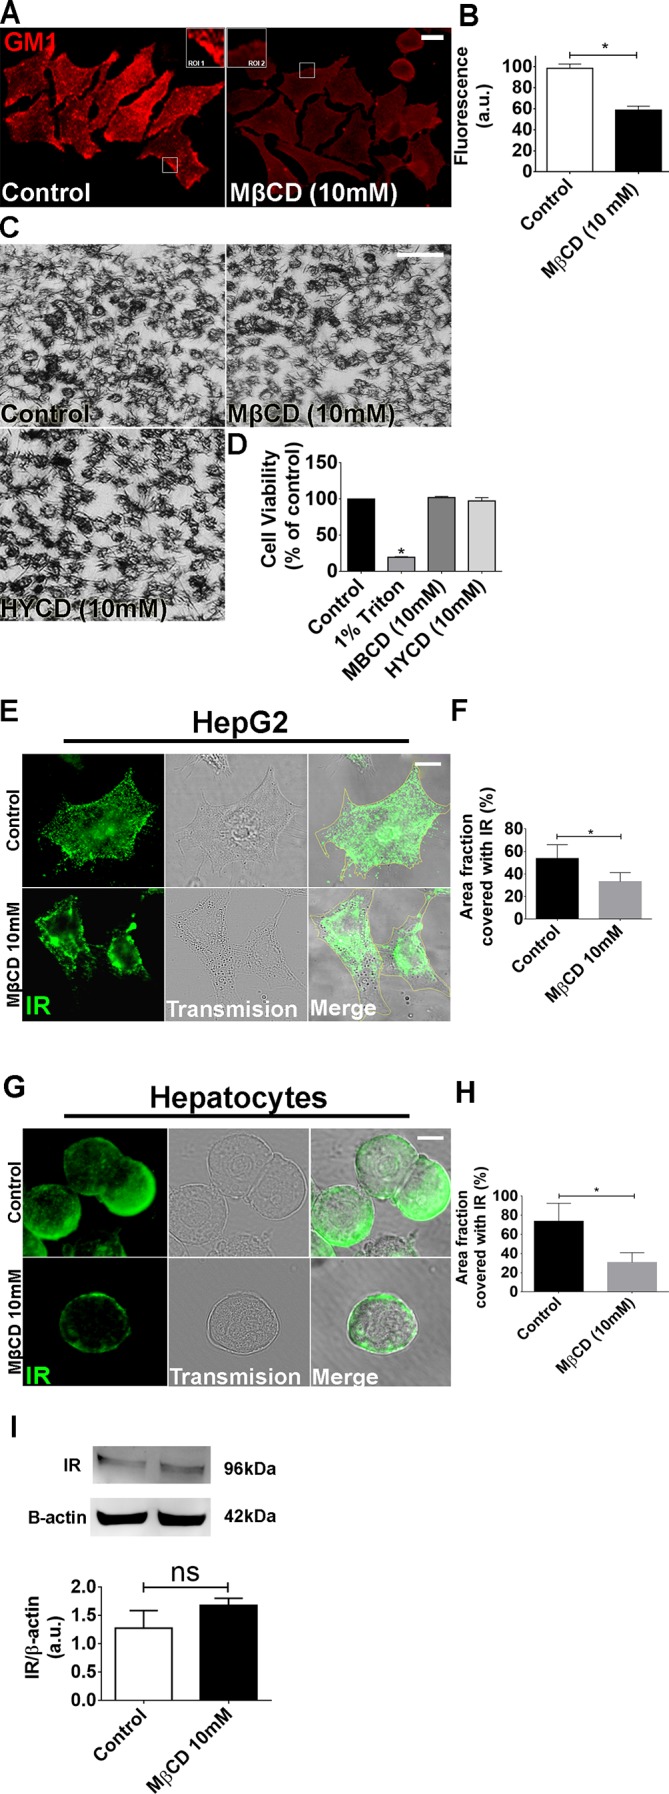
Metyl-β-cyclodextrin (MβCD; 10 mM) treatment efficiently disrupts the lipid rafts without compromising cell viability. A: control and MβCD (10 mM)-treated HepG2 cells were labeled with CTxB to identify the lipid rafts. Regions of interest (ROI 1 and 2) show a zoom of the GM1 labeling in certain membrane areas. B: quantification of fluorescence intensity of A [control cells: 98.65 ± 4 arbitrary units (a.u.) vs. MβCD-treated cells: 58.8 ± 3.7 a.u.; *P < 0.05; n = 159 cells analyzed for each group]. C: bright-field images of MTT assay show cellular viability of control, MβCD, and (2-hydroxypropyl)-γ-cyclodextrin (HYCD)-treated cells. D: quantification of MTT assay in C. 1% Triton was used as a positive control of the technique (control: 100 ± 0%; Triton-X: 19.63 ± 0.4%; MβCD: 97.41 ± 2.3%; HYCD: 102.2 ± 0.7%; *P < 0.05; n = 3 individual experiments). E: Z-stack of control and MβCD-treated HepG2 cells immunostained for the insulin receptor (IR) (green). F: quantification of delimited (yellow traces) cell area covered with IR in HepG2 cells (n = 55 cells of 3 different experiments for each group were analyzed). G: Z-stack of control and MβCD-treated hepatocytes immunostained for IR (green). H: quantification of delimited (yellow traces) cell area covered with IR in hepatocytes (n = 55 cells of each 3 different experiments were analyzed; *P < 0.05; values expressed as means ± SD). I: immunoblots for IR shows that there is no difference in the expression of IR between control and MβCD-treated HepG2 cells (control: 1.25 ± 0.27 vs. MβCD: 1.53 ± 0.11; n = 3 individual experiments). The values indicate the means ± SD. *P < 0.05, difference between groups was statistically significant; ns, not significant. Data were analyzed by one-way ANOVA followed by Bonferroni posttests.
To verify the relative importance of lipid raft integrity to insulin-induced Ca2+ signals, HepG2 cells and primary hepatocytes were treated with MβCD (10 mM) for 45 min and then stimulated with insulin (300 nM). HepG2 cells and primary hepatocytes loaded with the Ca2+-sensitive dye Fluo-4/AM were examined by time-lapse confocal microscopy under control and MβCD-treated conditions. Nuclear and cytosolic Ca2+ signals were monitored. In control cells, insulin induced a transient Ca2+ response (Fig. 3, A–C, for HepG2 cells and Fig. 3, G–I, for hepatocytes). However, insulin-induced Ca2+ signaling was abolished in MβCD-treated cells (Fig. 3, D–F for HepG2 cells and Fig. 3, J–L, for hepatocytes). In contrast, cholesterol removal did not alter the pattern of Ca2+ signals induced by either EGF or HGF (Fig. 4). Together, these results provide evidence that lipid rafts are important for proper insulin-induced Ca2+ signaling in particular in hepatocytes.
Fig. 3.

Disruption of lipid rafts abolishes intracellular calcium signaling induced by insulin. A: confocal images of HepG2 cells loaded with Fluo-4/AM (6 µM) and stimulated with insulin (300 nM). A and D: control (A) and metyl-β-cyclodextrin (MβCD)-treated cells (D) were analyzed. Images were pseudocolored according to the scale shown at bottom. Scale bar = 10 μm. B and E: observe that MβCD treatment nearly abolished the amplitude of Ca2+ signaling. Graphical representation of the fluorescence increase in the nucleus (blue traces) and cytosol (red traces) of a control (B) and an MβCD-treated cell (E), stimulated with insulin, pointed with an arrow. C and F: summary of insulin stimulation studies. G and J: confocal images of hepatocytes loaded with Fluo-4/AM (6 µM) and stimulated with insulin (300 nM). Control (G) and MβCD-treated hepatocytes (J) were analyzed. H and K: Graphical representation of the fluorescence increase in the nucleus (blue traces) and cytosol (red traces) of a control (H) and an MCBD-treated cell (K) stimulated with insulin. I and L: summary of insulin stimulation studies (HepG2: control nucleus = 221.3 ± 12%, control cytosol = 164 ± 5%; n = at least 50 cells for each condition; hepatocytes: control nucleus = 142.3 ± 2%, control cytosol = 58 ± 2,2%; n = at least 50 cells for each condition. Values are means ± SD of the peak Fluo-4 fluorescence acquired during the observation period, expressed as %baseline. *P < 0.01, difference between groups was statistically significant; ns, not significant. Data were analyzed by one-way ANOVA followed by Bonferroni posttests.
Fig. 4.

Calcium signaling induced by epidemral growth factr (EGF) or hepatocyte growth factor (HGF) is not affected due lipid rafts disorganization. A: confocal images of HepG2 cells loaded with Fluo-4/AM (6 µM) and stimulated with EGF (50 ng/ml). A and D: control (A) and metyl-β-cyclodextrin (MβCD)-treated cells (D) were analyzed. Images were pseudocolored according to the scale shown at bottom. Scale bar = 10 μm. B and E: graphical representation of the fluorescence increase in the nucleus (blue traces) and cytosol (red traces) of a control (B) and an MβCD-treated cell stimulated with EGF (E), pointed with an arrow. C and F: summary of EGF stimulation studies. (control nucleus = 552.3 ± 18%; control cytosol = 444 ± 11%; n = at least 50 cells for each condition). G: confocal images of HepG2 cells loaded with Fluo-4/AM (6 µM) and stimulated with HGF (100 ng/ml). G and J: control (G) and MβCD-treated cells (J) were analyzed. Images were pseudocolored according to the scale shown at bottom. Scale bar = 10 μm. H and K: graphical representation of the fluorescence increase in the nucleus (blue traces) and cytosol (red traces) of a control (H) and an MβCD-treated cell stimulated with HGF (K). I and L: summary of HGF stimulation studies (control nucleus = 589.3 ± 11%; control cytosol = 498 ± 6%; n = at least 50 cells for each condition). Values are means ± SD of the peak Fluo-4 fluorescence acquired during the observation period (expressed as % of baseline) and include the response from 55 control HepG2 cells and 55 MβCD-treated HepG2 cells, for each stimulus. The values indicate the means ± SD. *P < 0.01, difference between groups was statistically significant; ns, not significant. Data were analyzed by one-way ANOVA followed by Bonferroni post tests.
Removal of membrane cholesterol impairs insulin-induced cell proliferation.
The increase in nuclear Ca2+ triggered by insulin stimulates liver growth (2). Therefore, we investigated whether disruption of lipid rafts affects cell proliferation. HepG2 cells were synchronized in G0 by serum withdrawal and treated with MβCD for 45 min, and then, bromodeoxyuridine (BrdU) incorporation was measured. Insulin (300, 600, and 1,200 nM) and 10% fetal bovine serum each induced significant increases in BrdU uptake when compared with unstimulated control cells, as expected (Fig. 5A). However, BrdU uptake was reduced in cholesterol-depleted cells, relative to insulin-stimulated control cells. HYCD was used as a negative control, showing the specificity of cholesterol removal for the reduction in insulin-induced cell proliferation (Fig. 5B). Additionally, ERK1/2, a MAPK kinase protein involved in the regulation of cell proliferation, was highly phosphorylated in HepG2 cells and primary hepatocytes pretreated with MβCD and then stimulated with insulin in comparison to control cells (Fig. 5, C and D). This finding is consistent with the previous observation that hyperphosphorylation of ERK1/2 inhibits cell proliferation (7, 38). Thus, cholesterol removal impairs the hepatic mitogenic effects of insulin. A role for lipid rafts in the more well-known metabolic effects of insulin has already been demonstrated (21, 59). For instance, in 3T3-L1 adipocytes in which lipid rafts were disrupted, insulin-induced glucose uptake was diminished due to reduced phosphatidylinositol 3-kinase (PI3K)-Akt/PKB activation, a pathway that takes part in cell metabolism (21, 59). We therefore evaluated whether glucose metabolism induced by insulin would also be affected by disrupting lipid rafts in hepatocytes. We observed a significant reduction in Akt phosphorylation in cells previously treated with MβCD (Fig. 6, A and B). In addition, MβCD-treated cells also exhibited diminished medium glucose uptake (Fig. 6, C and D). These data collectively provide evidence that membrane content of cholesterol plays a significant role for the proper regulation by insulin of glucose metabolism as well as cell proliferation in hepatocytes.
Fig. 5.

Cell proliferation induced by insulin is reduced and pERK1/2 levels are increased when lipid rafts are disrupted. A: bromodeoxyuridine (BrdU) uptake in HepG2 cells before and after insulin (300, 600, and 1,200 nM, 14 h) stimulation. Ten percent of serum was used as additional positive control for cell proliferation [0% serum = 100%, 10% serum = 176 ± 12%, insulin (300 nM) = 135 ± 8%, insulin (600 nM) = 146 ± 8%, insulin (1,200 nM) = 157 ± 8%; n = at least 3 individual experiments in triplicate]. B: BrdU uptake in control and metyl-β-cyclodextrin (MβCD)-treated (45min) HepG2 cells before and after insulin (300, 600, and 1,200 nM, 14 h) stimulation. Ten percent serum and (2-hydroxypropyl)-γ-cyclodextrin (HYCD) was used as additional positive and negative controls, respectively, for cell proliferation [0% serum = 100%, 10% serum = 176 ± 12%, MβCD + 10% serum = 110 ± 11%, insulin (300 nM) = 135 ± 8%, MβCD + insulin (300 nM) = 94.2 ± 4.1%, insulin (600 nM) = 146 ± 8%, MβCD + insulin (600 nM) = 85 ± 6%, insulin (1,200 nM) = 157 ± 8%, MβCD + insulin (1,200 nM) = 84 ± 8%; n = 3 experiments in triplicate]. C and D: C and D: HepG2 cells (C) and rat hepatocytes (D) (control, insulin stimulated, MβCD treated) were stimulated with insulin and pERK1/2 levels were evaluated by immunoblot. MβCD + insulin samples shown in C and D were run on a separate gel. Densitometric analysis of the C and D, respectively, shows an increase on pERK1/2 levels in cells treated with MβCD [HepG2: control = 0.29 ± 0.03 arbitrary units (a.u.), insulin (300 nM) = 6.61 ± 1.6 a.u., MβCD + insulin = 30.7 ± 0.5 a.u.; hepatocytes: control = 9.3 ± 1.5 a.u., insulin (300 nM) = 31.19 ± 0.8 a.u, MβCD + insulin = 66.33 ± 9.4 a.u.; n = 3 independent experiments]. pERK and ERK blots shown in C and D are from the same experiments for each sample analyzed. The values indicate the means ± SD. *P < 0.01, difference between groups was statistically significant; ns, not significant. Data were analyzed by one-way ANOVA followed by Bonferroni posttests.
Fig. 6.

The glucose uptake induced by insulin is reduced in cells treated with metyl-β-cyclodextrin (MβCD). A and B: HepG2 (A) and hepatocytes (B) (control, insulin stimulated, MβCD treated) were incubated with insulin for 15 min, and pAKT levels were evaluated by immunoblot. Densitometric analysis of the A and B, respectively, shows a decrease on pAKT levels in cells treated with MβCD [HepG2: control = 0.16 ± 0.01 arbitrary units (a.u.), insulin (300 nM) = 1.09 ± 0.13 a.u., MβCD + insulin = 0.56 ± 0.06 a.u.; hepatocytes: control = 0.80 ± 0.19 a.u., insulin (300 nM) = 2.6 ± 0.40 a.u., MβCD + insulin = 0.84 ± 0.6 a.u; n = at least 3 individual experiments). All samples shown in A were run on the same gel but lanes were removed for final presentation. C and D: quantification of glucose uptake in the culture medium of HepG2 and hepatocytes for the control and MβCD-treated group. Incubation with (2-hydroxypropyl)-γ-cyclodextrin (HYCD) was used as a negative control [HepG2: control = 100%, control + insulin (300 nM) = 50.93 ± 7.2%, MβCD + insulin = 83.15 ± 8.4%, HYCD + insulin = 52.15 ± 5.4%;hepatocytes: control = 100%, insulin (300 nM) = 80.91 ± 2.25%, MβCD + insulin = 96.95 ± 3.9%, HYCD + insulin = 81.22 ± 3.2%; n = 3 individual experiments]. The values indicate the means ± SD. *P < 0.01, difference between groups was statistically significant; ns, not significant. Data were analyzed by one-way ANOVA followed by Bonferroni posttests.
Lovastatin abolishes Ca2+ signaling induced by insulin and delays liver regeneration.
To investigate the importance of lipid rafts for hepatic insulin signaling in vivo, we used lovastatin to inhibit HMG-CoA reductase, the major regulatory enzyme in cholesterol biosynthesis (reviewed by Ref. 62). Rats treated with 15 mg·kg−1·day−1 of lovastatin for 14 days showed a reduction in total liver cholesterol with no significant changes in either their body weight or total serum cholesterol (Fig. 7, A–C). In addition, upon lovastatin treatment, Cav-1, a well-known component of the lipid rafts in hepatocytes (16, 22), changed its labeling pattern (Fig. 7D) as well as increased its expression level in the liver when compared with control saline-treated animals (Fig. 7F). These observed modifications were not accompanied by difference in the expression level of the insulin receptor (Fig. 7E).
Fig. 7.

In vivo treatment with lovastatin reduces total liver cholesterol and induces alteration on Cav-1 distribution and organization. A: in vivo experimental design. B: daily weight along the experiment (n = 5 animals each group). C: analysis of total cholesterol content of serum (left) and liver (right) samples from control and lovastatin-treated animals (serum-control animals: 239 ± 14 mg/dl vs. lovastatin animals: 213 ± 28 mg/dl; liver-control animals: 2.6 ± 0.4 mg/g of tissue vs. lovastatin-treated animals: 1.7 ± 0.2 mg/g of tissue; n = 5 animals, 3 samples each, per group). D: immunofluorescence images of liver section from control and lovastatin-treated animals after 14 days of lovastatin administration show a disruption in caveolin-1 distribution and organization. Regions of interest 1 and 2 (ROI 1 and 2) are shown in right insets (n = 5 animals per condition). E: immunoblots of total liver lysates. Graph at bottom represents densitometric analysis of IR in the liver after lovastatin treatment [control animals = 1.57 ± 0.01 arbitary units (a.u.) vs. lovastatin-treated animals = 1.58 ± 0.01; n = 5 animals per group, in triplicate]. F: immunoblots of total liver lysates. Graph represents densitometric analysis of Cav-1 in the liver after lovastatin treatment (control animals = 5.07 ± 0.7 a.u. vs. lovastatin-treated animals = 10.8 ± 0.2; n = 5 animals per group). The values indicate the means ± SD. *P < 0.01, difference between groups was statistically significant; ns, not significant. Data were analyzed by one-way ANOVA followed by Bonferroni posttests.
To determine the effect of lovastatin on insulin-induced Ca2+ signals, hepatocytes from control and lovastatin-treated animals were isolated, loaded with Fluo-4/AM, and then examined by time-lapse confocal microscopy. Insulin-induced Ca2+ signals were impaired in hepatocytes from the lovastatin-treated animals, while vasopressin-induced Ca2+ signals were not affected. To investigate whether lovastatin abolishment of the Ca2+ signaling induced by insulin was not due to the depletion of intracellular Ca2+ stores, vasopressin, another well-known intracellular Ca2+ mobilizing agonist in liver cells (41), was used to show the integrity of the intracellular Ca2+ store compartments. The ratio between insulin/vasopressin-responsive cells was also diminished in the lovastatin-treated group, when compared with the control group (Fig. 8C).
Fig. 8.

In vivo treatment with lovastatin inhibits calcium signaling induced by insulin on rat hepatocytes and on in vivo intact liver. A and B: graphical representation of the fluorescence increase in the nucleus (blue traces) and cytosol (red traces) of a hepatocyte extracted from a control animal (A) and lovastatin-treated animal (B) stimulated with insulin (300 nM) and vasopressin (100 nM) (control nucleus = 165.3 ± 2.5%; control cytosol = 124 ± 1%; n = 50 cells from 3 animals per condition) (lovastatin nucleus = 102.3 ± 3%; lovastatin cytosol = 124 ± 2.6%; n = 50 cells from 3 animals per condition). C: graph showing the ratio of insulin responsive hepatocytes/vasopressin responsive hepatocytes from control and lovastatin-treated animals. Observe a reduced number of insulin responsive cells on the lovastatin group (control = 1.1 ± 0.3 cells vs. lovastatin = 0.44 ± 0.2 cells; n = 5 individual experiments per group, 50 cells for each group). D: graphical representation of the in vivo fluorescence increase of hepatocytes from the liver of control animals (blue traces) and lovastatin-treated animals (red traces) stimulated with insulin (600 nM) (n = 4 animals per group). E: summary of in vivo calcium studies in the liver induced by insulin (control = 143 ± 3% vs. lovastatin = 111 ± 1%; n = 5 animals per group). F: graph showing the percentage of insulin-responsive cells of control and lovastatin-treated groups. Observe the reduced number of responsive hepatocytes of the liver from lovastatin-treated animals (control = 98 ± 1% vs. lovastatin = 20 ± 4%; n = 5 animals and 5 fields analyzed per group). G: confocal images of livers loaded with Fluo-4/AM (6 µM), stimulated with insulin (600 nM) and imaged in vivo. Images were pseudocolored according to the scale shown at the bottom. Scale bar = 40 µM. Objective lens: ×20. The values indicate the means ± SD. *P < 0.01, difference between groups was statistically significant; ns, not significant. Data were analyzed by one-way ANOVA followed by Bonferroni posttests.
To determine whether lovastatin altered insulin-induced Ca2+ signals in vivo, Ca2+ was measured in hepatocytes in intact livers of control and lovastatin-treated rats. A prominent reduction in the Ca2+ signaling response to intravenous insulin (600 nM) was observed in the livers of lovastatin-treated animals (Fig. 8, D, E, and G; see also supplemental files S1 and S2; supplemental material for this article is available online at the Journal website). The number of insulin-responsive hepatocytes in the lovastatin group was also reduced (Fig. 8F). These findings show that disruption of lipid rafts decreases insulin-induced Ca2+ signaling in hepatocytes in vivo.
Hepatocytes have a unique capability to switch from a quiescent to a proliferative state in response to a reduction in cellular mass after surgical resection (13). The activation of certain membrane receptors is crucial for this process. To investigate the role of lipid rafts in liver regeneration, control and lovastatin-treated animals were subjected to 70% PH. Liver weight/body weight ratio was lower in lovastatin-treated animals than in controls, measured 48 h after PH (Fig. 9, A and B). No differences were observed between the groups 120 h after PH. To complement these observations, PCNA staining was performed in the liver slices of control and lovastatin-treated animals. The number of PCNA-positive cells was significantly greater in the control group than in the lovastatin-treated group, measured 48 h after PH (Fig. 9, C and D). In contrast, the opposite was observed 120 h after PH. Lovastatin-treated animals had a higher number of PCNA-positive cells when compared with the control group (Fig. 9, C and E). Since insulin acts mainly in the first hours during the process of liver regeneration (13, 37), we aimed to check the distribution of the IR after 48 h of PH in liver slices of both groups. Although not very striking, it can be noticed that the control group presents an increased accumulation of the IR in the nucleus, which stimulates cell proliferation (Fig. 10A). On the other hand, lovastatin-treated animals show IR mainly along the cell membrane (Fig. 10A). Taking together, these findings support the idea that cholesterol membrane reduction that might cause disruption of lipid rafts leads to impaired insulin signaling, resulting in delayed liver regeneration.
Fig. 9.

In vivo treatment with lovastatin delays liver regeneration. A and B: liver/body weight ratio in control animals and subjected to lovastatin treatment after 48 [sham = 3.82 ± 0.15%, partial hepatectomy (PH) 48-h control = 2.6 ± 0.14% and PH 48-h lovastatin = 1.6 ± 0.09%; A] and 120 h (sham = 3.82 ± 0.16%, PH 120 h control = 3.6 ± 0.01% and PH 120 h lovastatin = 3.6 ± 0.08%; B) of 70% partial hepatectomy (n = 5 animals per condition). C: immunohistochemistry images of liver section from control and lovastatin-treated animals 48 h (sham = 9.3 ± 2.5%, PH 48-h control = 35 ± 7%, PH 48-h lovastatin = 20 ± 5%) and 120 h (sham = 9.3 ± 2.5%, PH 120-h control = 13.2 ± 1.6%, PH 120-h lovastatin = 27.4 ± 3.2%) after PH (n = 5 slices per animal and 5 animals per group). PCNA staining in the nucleus (red arrows) allows identification of proliferation cells in each group. Scale bar = 50 μm. Objective lens: ×10. D and E: quantification of PCNA-positive cells in control and lovastatin-treated animals after 48 h (D) and 120 h (E) of partial hepatectomy (n = 5 slices per animals and 5 animals per condition). *P < 0.01, difference between groups was statistically significant; ns, not significant. Data were analyzed by one-way ANOVA followed by Bonferroni posttests.
Fig. 10.
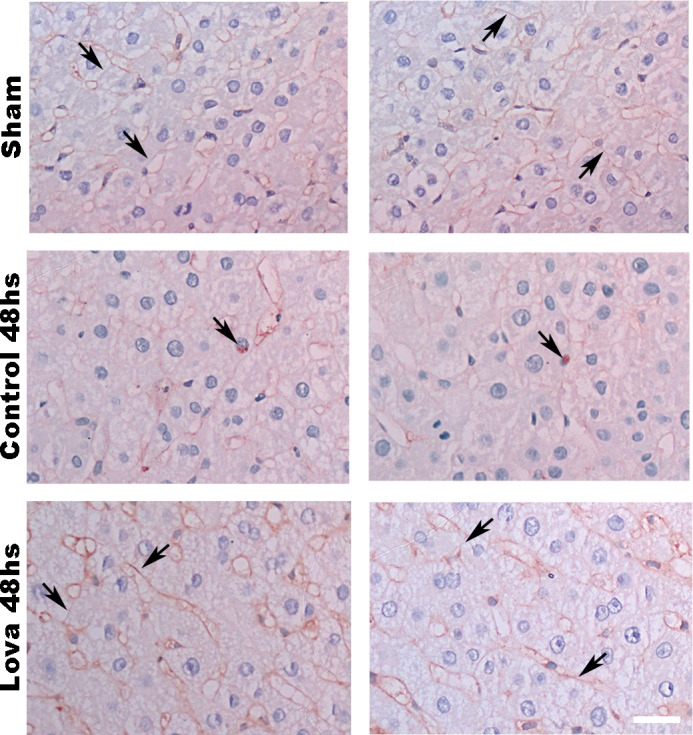
Insulin receptor (IR) changes its distribution after lovastatin treatment followed by 70% hepatectomy. Immunohistochemistry images of liver sections from sham, control and lovastatin-treated animals 48 h after partial hepatectomy (PH). As can be seen immunohistochemistry, images never detect the IR in the hepatocyte nucleus in sham and lovastatin-treated group (observe the membrane concentration of IR) (top and bottom) but occasionally detect it in control animals (middle) 48 h after PH. Arrows: IR staining on cell membrane or in hepatocyte nuclei; scale bar = 40 µm. Objective lens: ×100.
DISCUSSION
This work suggests that membrane cholesterol removal impairs insulin-induced Ca2+ signals, which in turn contributes to a reduced hepatic cell proliferation.
Liver regeneration after partial hepatectomy can be divided into several phases (13, 37, 66). In the first 2 h after injury, hepatocytes are activated to reenter cell cycle to proliferate. Thereby, an intense proliferation of hepatocytes leads to the restoration of much of the liver parenchyma during the following 48 h. Finally, the regeneration process finishes with replacement of liver mass occurring mainly because of proliferation of preexisting hepatocytes rather than by the activation of a progenitor cell compartment (10, 13). This entire process is coordinated by growth factors, cytokines, hormones, and factors from the extracellular matrix, a number of which have the ability to initiate and modulate the intracellular Ca2+ signals in hepatocytes (2, 20, 24), including insulin.
Since its discovery, insulin has been described as an anabolic hormone with a wide range of effects on cellular metabolism, inducing the uptake of glucose from the bloodstream, as well as stimulating synthesis and inhibiting the degradation of glycogen, proteins, and lipids (57). In addition to these well-known effects on metabolism, insulin plays an important role in stimulating cell proliferation. Insulin-induced mitogenic effects were first described nearly 100 yr ago (17) by observation of the effects of insulin addition to chicken fibroblasts in culture. Multiple subsequent lines of evidence also point to insulin as a potent mitogen, including for 3T3 cells (25), rat hepatocytes, and hepatoma cells (2, 28), renal cell lines (60), and melanoma cells (33) among others (reviewed by Ref. 57). In the liver, insulin has strong metabolic (35, 49); revised by Ref. 1) and mitogenic effects (2, 23, 36), having significant functions during the process of hepatic regeneration through the activation of its receptor, located in the plasma membrane. Here we show that there is a close interaction between the IR and the cholesterol-enriched membrane microdomains in liver cells. As we clearly demonstrated here, HGF as well as EGF, other important growth factors also involved in liver regeneration, do not depend on membrane cholesterol integrity to trigger nuclear Ca2+ increase in hepatocytes and therefore cell proliferation. In addition, we also showed that cholesterol integrity at the plasma membrane level is important for the insulin/IR pathway that triggers signaling events that culminate in nuclear Ca2+ increase, known to be an absolute requirement for insulin to regulate hepatocyte proliferation (2).
The metabolic actions of insulin in the liver are mainly mediated by the PI3K-Akt/PKB pathway. Akt is activated at the plasma membrane upon IR-mediated phosphorylation of PI3K (59). Previous studies have shown that when membrane cholesterol is depleted in 3T3-L1 adipocytes, AKT phosphorylation and glucose uptake are reduced (48). The current work extends this concept by providing evidence that disruption of cholesterol-enriched membrane microdomains due to cholesterol removal impairs the metabolic effects induced by insulin, as well as liver regeneration after PH.
Since its formulation more than 20 yr ago (6, 52, 54), the lipid raft theory became a turning point regarding cell signaling, especially with regards to membrane receptors. Treatment with MβCD, which disrupts rafts due to cholesterol removal (39, 40, 46), provides insights regarding how insulin signaling is affected once lipid content of liver cell membranes is modified. However, it is important to mention that although treatment of cells with this cyclodextrin leads to a selective extraction of cholesterol from the plasma membrane, hence disrupting the lipid rafts, it may also impair the formation of clathrin-coated endocytic vesicles (45). In addition, it was previously showed that acute cholesterol depletion specifically decreased the rate of internalization of transferrin receptor, nevertheless, receptor trafficking back to the cell surface was not affected (58). Thereby, the precise mechanism by which cholesterol depletion with MβCD impairs insulin signaling is still opened to further investigation.
It has been shown that a subpopulation of IR on the plasma membrane is associated with caveolin-enriched membrane domains (3, 15), but the functional significance of this has not been clear. We showed that lovastatin treatment rearranged caveolin organization on the cell membrane and led to an overexpression of this protein. This may be due to ERK activation, because there is a close cross talk between Cav-1 and ERK (19), in which phosphorylation of ERK leads to upregulation of Cav-1 in hepatocytes (34). A relevant increase in hepatic Cav-1 was also found in cirrhosis and chronic alcoholic fatty liver (51, 65), indicating its essential role for cholesterol trafficking and lipid homeostasis (43, 55). In addition, although ERK activation is closely related to cell proliferation, in the setting of chronically increased p-ERK, proliferative activity becomes inhibited due to accumulation of p21cip1, an inhibitor of cell cycle entry (7, 38). Therefore, besides contributing to Cav-1 overexpression, hyperactivation of ERK also led to arrest of hepatocytes in the cell cycle causing an impairment in cell proliferation.
Lovastatin is a potent inhibitor of HMG-CoA reductase, which decreases cholesterol biosynthesis (reviewed by Ref. 62). In fact, we observed that animals treated with lovastatin had a marked reduction in total cholesterol in the liver, without weight loss. It is suggested that lovastatin may induce cell cycle arrest in G1 phase. This robust antiproliferative activity remains intact in many cancer cells (64). Lovastatin is a potent mitotic inhibitor in several cell types, including B-lymphocytes, glial cells, and mesangial cells (8, 56, 61). However, the precise mechanism by which this drug is able to induce cell arrest is not completely understood. Uptake of glucose in cells treated with statins is also significantly reduced, which may contribute to the antiproliferative effect of this drug (31). Regarding liver cell proliferation, lovastatin reduced the size and number of preneoplastic nodules in a model of chemical carcinogenesis in rat liver (5). In addition, Ca2+ signals induced by insulin, HGF, EGF, etc. in the liver are important for hepatocyte proliferation (18, 44, 47). The current work provides evidence that lovastatin impairs insulin-induced Ca2+ signaling in the liver, resulting in delayed liver regeneration. In our current work, we are not stating that statins are preventing liver regeneration, since after 120 h of hepatectomy both control and statin-treated animals presented the same level of regeneration. Hence, it is possible that the impairment in insulin-induced Ca2+ signaling affects hepatocyte reentry into cell cycle in the early phase of liver regeneration.
These findings provide the first in vivo evidence for the general importance of cholesterol membrane in liver regeneration. However, further studies are needed to unravel the importance of these membrane microdomains in each specific phase of liver regeneration, as well as their role in different liver cell types throughout the process of regeneration.
GRANTS
This study was financially supported by Conselho Nacional de Desenvolvimento Científico e Tecnológico (CNPq); Fundação de Apoio a Pesquisa do Estado de Minas Gerais (FAPEMIG); Coordenação de Aperfeiçoamento de Pessoal de Nível Superior, and Instituto Nacional de Ciência e Tecnologia (Brazil); National Institute of Diabetes and Digestive and Kidney Diseases Grants P01-DK-57751, P30-DK-34989, R56-DK-99470, and R01-DK-45710; CNPq/Ministério da Ciência, Tecnologia, Inovações e Comunicações Grant 300990/201476; National Institute on Alcohol Abuse and Alcoholism Grant 1U01-AA-021908; and FAPEMIG/Région Hauts de France.
DISCLOSURES
No conflicts of interest, financial or otherwise, are declared by the authors.
AUTHOR CONTRIBUTIONS
M.d.C.F., A.G.O., and M.F.L. conceived and designed research; M.d.C.F., A.F., R.M.F., R.C.F., A.C.M., and P.T.V.V. performed experiments; M.d.C.F., A.F., A.G.O., and M.F.L. analyzed data; M.d.C.F., A.F., and M.F.L. interpreted results of experiments; M.d.C.F. prepared figures; M.d.C.F., A.G.O., and M.F.L. drafted manuscript; M.d.C.F., M.H.N., and M.F.L. edited and revised manuscript; M.d.C.F., P.T.V.V., A.G.O., L.D., M.H.N., and M.F.L. approved final version of manuscript.
Supplemental Data
ACKNOWLEDGMENTS
We acknowledge the technical assistance of Gilson Nogueira, Conselho Nacional de Desenvolvimento Científico e Tecnológico, Fundação de Apoio a Pesquisa do Estado de Minas Gerais, Coordenação de Aperfeiçoamento de Pessoal de Nível Superior, National Insitutes of Health, and National Institute on Alcohol Abuse and Alcoholism for funding this work. We also thank the Liver Center at Federal University of Minas Gerais for technical support.
REFERENCES
- 1.Agius L. Glucokinase and molecular aspects of liver glycogen metabolism. Biochem J 414: 1–18, 2008. doi: 10.1042/BJ20080595. [DOI] [PubMed] [Google Scholar]
- 2.Amaya MJ, Oliveira AG, Guimarães ES, Casteluber MC, Carvalho SM, Andrade LM, Pinto MC, Mennone A, Oliveira CA, Resende RR, Menezes GB, Nathanson MH, Leite MF. The insulin receptor translocates to the nucleus to regulate cell proliferation in liver. Hepatology 59: 274–283, 2014. doi: 10.1002/hep.26609. [DOI] [PMC free article] [PubMed] [Google Scholar]
- 3.Balbis A, Baquiran G, Mounier C, Posner BI. Effect of insulin on caveolin-enriched membrane domains in rat liver. J Biol Chem 279: 39348–39357, 2004. doi: 10.1074/jbc.M404280200. [DOI] [PubMed] [Google Scholar]
- 4.Berridge MV, Tan AS. Characterization of the cellular reduction of 3-(4,5-dimethylthiazol-2-yl)-2,5-diphenyltetrazolium bromide (MTT): subcellular localization, substrate dependence, and involvement of mitochondrial electron transport in MTT reduction. Arch Biochem Biophys 303: 474–482, 1993. doi: 10.1006/abbi.1993.1311. [DOI] [PubMed] [Google Scholar]
- 5.Björkhem-Bergman L, Acimovic J, Torndal UB, Parini P, Eriksson LC. Lovastatin prevents carcinogenesis in a rat model for liver cancer. Effects of ubiquinone supplementation. Anticancer Res 30: 1105–1112, 2010. [PubMed] [Google Scholar]
- 6.Brown DA, London E. Functions of lipid rafts in biological membranes. Annu Rev Cell Dev Biol 14: 111–136, 1998. doi: 10.1146/annurev.cellbio.14.1.111. [DOI] [PubMed] [Google Scholar]
- 7.Chambard JC, Lefloch R, Pouysségur J, Lenormand P. ERK implication in cell cycle regulation. Biochim Biophys Acta 1773: 1299–1310, 2007. doi: 10.1016/j.bbamcr.2006.11.010. [DOI] [PubMed] [Google Scholar]
- 8.Choi JW, Jung SE. Lovastatin-induced proliferation inhibition and apoptosis in C6 glial cells. J Pharmacol Exp Ther 289: 572–579, 1999. [PubMed] [Google Scholar]
- 9.De Angelis Campos AC, Rodrigues MA, de Andrade C, de Goes AM, Nathanson MH, Gomes DA. Epidermal growth factor receptors destined for the nucleus are internalized via a clathrin-dependent pathway. Biochem Biophys Res Commun 412: 341–346, 2011. doi: 10.1016/j.bbrc.2011.07.100. [DOI] [PMC free article] [PubMed] [Google Scholar]
- 10.Duncan AW, Dorrell C, Grompe M. Stem cells and liver regeneration. Gastroenterology 137: 466–481, 2009. doi: 10.1053/j.gastro.2009.05.044. [DOI] [PMC free article] [PubMed] [Google Scholar]
- 11.Echevarría W, Leite MF, Guerra MT, Zipfel WR, Nathanson MH. Regulation of calcium signals in the nucleus by a nucleoplasmic reticulum. Nat Cell Biol 5: 440–446, 2003. doi: 10.1038/ncb980. [DOI] [PMC free article] [PubMed] [Google Scholar]
- 12.Fagerholm S, Ortegren U, Karlsson M, Ruishalme I, Strålfors P. Rapid insulin-dependent endocytosis of the insulin receptor by caveolae in primary adipocytes. PLoS One 4: e5985, 2009. doi: 10.1371/journal.pone.0005985. [DOI] [PMC free article] [PubMed] [Google Scholar]
- 13.Fausto N, Campbell JS, Riehle KJ. Liver regeneration. Hepatology 43, Suppl 1: S45–S53, 2006. doi: 10.1002/hep.20969. [DOI] [PubMed] [Google Scholar]
- 14.Folch J, Lees M, Sloane Stanley GH. A simple method for the isolation and purification of total lipides from animal tissues. J Biol Chem 226: 497–509, 1957. [PubMed] [Google Scholar]
- 15.Foti M, Porcheron G, Fournier M, Maeder C, Carpentier JL. The neck of caveolae is a distinct plasma membrane subdomain that concentrates insulin receptors in 3T3-L1 adipocytes. Proc Natl Acad Sci USA 104: 1242–1247, 2007. doi: 10.1073/pnas.0610523104. [DOI] [PMC free article] [PubMed] [Google Scholar]
- 16.Garg A, Agarwal AK. Caveolin-1: a new locus for human lipodystrophy. J Clin Endocrinol Metab 93: 1183–1185, 2008. doi: 10.1210/jc.2008-0426. [DOI] [PMC free article] [PubMed] [Google Scholar]
- 17.Gey GT, Thalhimer W. Observations on the effects of insulin introduced into the medium of tissue cultures. JAMA 82: 1609–1609, 1924. doi: 10.1001/jama.1924.26520460003014d. [DOI] [Google Scholar]
- 18.Gomes DA, Rodrigues MA, Leite MF, Gomez MV, Varnai P, Balla T, Bennett AM, Nathanson MH. c-Met must translocate to the nucleus to initiate calcium signals. J Biol Chem 283: 4344–4351, 2008. doi: 10.1074/jbc.M706550200. [DOI] [PMC free article] [PubMed] [Google Scholar]
- 19.Gortazar AR, Martin-Millan M, Bravo B, Plotkin LI, Bellido T. Crosstalk between caveolin-1/extracellular signal-regulated kinase (ERK) and β-catenin survival pathways in osteocyte mechanotransduction. J Biol Chem 288: 8168–8175, 2013. doi: 10.1074/jbc.M112.437921. [DOI] [PMC free article] [PubMed] [Google Scholar]
- 20.Guerra MT, Fonseca EA, Melo FM, Andrade VA, Aguiar CJ, Andrade LM, Pinheiro AC, Casteluber MC, Resende RR, Pinto MC, Fernandes SO, Cardoso VN, Souza-Fagundes EM, Menezes GB, de Paula AM, Nathanson MH, Leite MF. Mitochondrial calcium regulates rat liver regeneration through the modulation of apoptosis. Hepatology 54: 296–306, 2011. doi: 10.1002/hep.24367. [DOI] [PMC free article] [PubMed] [Google Scholar]
- 21.Gustavsson J, Parpal S, Strålfors P. Insulin-stimulated glucose uptake involves the transition of glucose transporters to a caveolae-rich fraction within the plasma membrane: implications for type II diabetes. Mol Med 2: 367–372, 1996. [PMC free article] [PubMed] [Google Scholar]
- 22.Hayashi YK, Matsuda C, Ogawa M, Goto K, Tominaga K, Mitsuhashi S, Park YE, Nonaka I, Hino-Fukuyo N, Haginoya K, Sugano H, Nishino I. Human PTRF mutations cause secondary deficiency of caveolins resulting in muscular dystrophy with generalized lipodystrophy. J Clin Invest 119: 2623–2633, 2009. doi: 10.1172/JCI38660. [DOI] [PMC free article] [PubMed] [Google Scholar]
- 23.Higgins GM, Anderson RM. . Experimental pathology of the liver–restoration of the liver of the white rat following partial surgical removal. Arch Patol 12: 186–202, 1931. [Google Scholar]
- 24.Hirata K, Pusl T, O’Neill AF, Dranoff JA, Nathanson MH. The type II inositol 1,4,5-trisphosphate receptor can trigger Ca2+ waves in rat hepatocytes. Gastroenterology 122: 1088–1100, 2002. doi: 10.1053/gast.2002.32363. [DOI] [PubMed] [Google Scholar]
- 25.Holley RW, Kiernan JA. Control of the initiation of DNA synthesis in 3T3 cells: low-molecular weight nutrients. Proc Natl Acad Sci USA 71: 2942–2945, 1974. doi: 10.1073/pnas.71.8.2942. [DOI] [PMC free article] [PubMed] [Google Scholar]
- 26.Huang W, Ma K, Zhang J, Qatanani M, Cuvillier J, Liu J, Dong B, Huang X, Moore DD. Nuclear receptor-dependent bile acid signaling is required for normal liver regeneration. Science 312: 233–236, 2006. doi: 10.1126/science.1121435. [DOI] [PubMed] [Google Scholar]
- 27.Irwin ME, Bohin N, Boerner JL. Src family kinases mediate epidermal growth factor receptor signaling from lipid rafts in breast cancer cells. Cancer Biol Ther 12: 718–726, 2011. doi: 10.4161/cbt.12.8.16907. [DOI] [PMC free article] [PubMed] [Google Scholar]
- 28.Leffert H. Glucagon, insulin and their hepatic receptors: an endocrine pattern characterizing hepatoproliferative transitions in the rat. In: Glucagon: Its Role in Physiology and Clinical edicine. New York, Springer, 1977. [Google Scholar]
- 29.Leite MF, Thrower EC, Echevarria W, Koulen P, Hirata K, Bennett AM, Ehrlich BE, Nathanson MH. Nuclear and cytosolic calcium are regulated independently. Proc Natl Acad Sci USA 100: 2975–2980, 2003. doi: 10.1073/pnas.0536590100. [DOI] [PMC free article] [PubMed] [Google Scholar]
- 30.Liu L, Brown D, McKee M, Lebrasseur NK, Yang D, Albrecht KH, Ravid K, Pilch PF. Deletion of Cavin/PTRF causes global loss of caveolae, dyslipidemia, and glucose intolerance. Cell Metab 8: 310–317, 2008. doi: 10.1016/j.cmet.2008.07.008. [DOI] [PMC free article] [PubMed] [Google Scholar]
- 31.Malenda A, Skrobanska A, Issat T, Winiarska M, Bil J, Oleszczak B, Sinski M, Firczuk M, Bujnicki JM, Chlebowska J, Staruch AD, Glodkowska-Mrowka E, Kunikowska J, Krolicki L, Szablewski L, Gaciong Z, Koziak K, Jakobisiak M, Golab J, Nowis DA. Statins impair glucose uptake in tumor cells. Neoplasia 14: 311–323, 2012. doi: 10.1593/neo.12444. [DOI] [PMC free article] [PubMed] [Google Scholar]
- 32.Marques PE, Antunes MM, David BA, Pereira RV, Teixeira MM, Menezes GB. Imaging liver biology in vivo using conventional confocal microscopy. Nat Protoc 10: 258–268, 2015. doi: 10.1038/nprot.2015.006. [DOI] [PubMed] [Google Scholar]
- 33.Mather JP, Sato GH. The growth of mouse melanoma cells in hormone-supplemented, serum-free medium. Exp Cell Res 120: 191–200, 1979. doi: 10.1016/0014-4827(79)90549-4. [DOI] [PubMed] [Google Scholar]
- 34.Meyer C, Dzieran J, Liu Y, Schindler F, Munker S, Müller A, Coulouarn C, Dooley S. Distinct dedifferentiation processes affect caveolin-1 expression in hepatocytes. Cell Commun Signal 11: 6, 2013. doi: 10.1186/1478-811X-11-6. [DOI] [PMC free article] [PubMed] [Google Scholar]
- 35.Michael MD, Kulkarni RN, Postic C, Previs SF, Shulman GI, Magnuson MA, Kahn CR. Loss of insulin signaling in hepatocytes leads to severe insulin resistance and progressive hepatic dysfunction. Mol Cell 6: 87–97, 2000. doi: 10.1016/S1097-2765(05)00015-8. [DOI] [PubMed] [Google Scholar]
- 36.Michalopoulos G, Pitot HC. Primary culture of parenchymal liver cells on collagen membranes. Morphological and biochemical observations. Exp Cell Res 94: 70–78, 1975. doi: 10.1016/0014-4827(75)90532-7. [DOI] [PubMed] [Google Scholar]
- 37.Michalopoulos GK, DeFrances MC. Liver regeneration. Science 276: 60–66, 1997. doi: 10.1126/science.276.5309.60. [DOI] [PubMed] [Google Scholar]
- 38.Mirza AM, Gysin S, Malek N, Nakayama K, Roberts JM, McMahon M. Cooperative regulation of the cell division cycle by the protein kinases RAF and AKT. Mol Cell Biol 24: 10868–10881, 2004. doi: 10.1128/MCB.24.24.10868-10881.2004. [DOI] [PMC free article] [PubMed] [Google Scholar]
- 39.Munro S. Lipid rafts: elusive or illusive? Cell 115: 377–388, 2003. doi: 10.1016/S0092-8674(03)00882-1. [DOI] [PubMed] [Google Scholar]
- 40.Nagata J, Guerra MT, Shugrue CA, Gomes DA, Nagata N, Nathanson MH. Lipid rafts establish calcium waves in hepatocytes. Gastroenterology 133: 256–267, 2007. doi: 10.1053/j.gastro.2007.03.115. [DOI] [PMC free article] [PubMed] [Google Scholar]
- 41.Nicou A, Serrière V, Prigent S, Boucherie S, Combettes L, Guillon G, Alonso G, Tordjmann T. Hypothalamic vasopressin release and hepatocyte Ca2+ signaling during liver regeneration: an interplay stimulating liver growth and bile flow. FASEB J 17: 1901–1903, 2003. doi: 10.1096/fj.03-0082fje. [DOI] [PubMed] [Google Scholar]
- 42.Pike LJ. Growth factor receptors, lipid rafts and caveolae: an evolving story. Biochim Biophys Acta 1746: 260–273, 2005. doi: 10.1016/j.bbamcr.2005.05.005. [DOI] [PubMed] [Google Scholar]
- 43.Pol A, Luetterforst R, Lindsay M, Heino S, Ikonen E, Parton RG. A caveolin dominant negative mutant associates with lipid bodies and induces intracellular cholesterol imbalance. J Cell Biol 152: 1057–1070, 2001. doi: 10.1083/jcb.152.5.1057. [DOI] [PMC free article] [PubMed] [Google Scholar]
- 44.Resende RR, Andrade LM, Oliveira AG, Guimarães ES, Guatimosim S, Leite MF. Nucleoplasmic calcium signaling and cell proliferation: calcium signaling in the nucleus. Cell Commun Signal 11: 14, 2013. doi: 10.1186/1478-811X-11-14. [DOI] [PMC free article] [PubMed] [Google Scholar]
- 45.Rodal SK, Skretting G, Garred O, Vilhardt F, van Deurs B, Sandvig K. Extraction of cholesterol with methyl-beta-cyclodextrin perturbs formation of clathrin-coated endocytic vesicles. Mol Biol Cell 10: 961–974, 1999. doi: 10.1091/mbc.10.4.961. [DOI] [PMC free article] [PubMed] [Google Scholar]
- 46.Rodrigues HA, Lima RF, Fonseca MC, Amaral EA, Martinelli PM, Naves LA, Gomez MV, Kushmerick C, Prado MA, Guatimosim C. Membrane cholesterol regulates different modes of synaptic vesicle release and retrieval at the frog neuromuscular junction. Eur J Neurosci 38: 2978–2987, 2013. [DOI] [PubMed] [Google Scholar]
- 47.Rodrigues MA, Gomes DA, Andrade VA, Leite MF, Nathanson MH. Insulin induces calcium signals in the nucleus of rat hepatocytes. Hepatology 48: 1621–1631, 2008. doi: 10.1002/hep.22424. [DOI] [PMC free article] [PubMed] [Google Scholar]
- 48.Sánchez-Wandelmer J, Dávalos A, Herrera E, Giera M, Cano S, de la Peña G, Lasunción MA, Busto R. Inhibition of cholesterol biosynthesis disrupts lipid raft/caveolae and affects insulin receptor activation in 3T3-L1 preadipocytes. Biochim Biophys Acta 1788: 1731–1739, 2009. doi: 10.1016/j.bbamem.2009.05.002. [DOI] [PubMed] [Google Scholar]
- 49.Sanger F. Fractionation of oxidized insulin. Biochem J 44: 126–128, 1949. doi: 10.1042/bj0440126. [DOI] [PMC free article] [PubMed] [Google Scholar]
- 50.Sarnataro D, Campana V, Paladino S, Stornaiuolo M, Nitsch L, Zurzolo C. PrP(C) association with lipid rafts in the early secretory pathway stabilizes its cellular conformation. Mol Biol Cell 15: 4031–4042, 2004. doi: 10.1091/mbc.e03-05-0271. [DOI] [PMC free article] [PubMed] [Google Scholar]
- 51.Shah V, Toruner M, Haddad F, Cadelina G, Papapetropoulos A, Choo K, Sessa WC, Groszmann RJ. Impaired endothelial nitric oxide synthase activity associated with enhanced caveolin binding in experimental cirrhosis in the rat. Gastroenterology 117: 1222–1228, 1999. doi: 10.1016/S0016-5085(99)70408-7. [DOI] [PubMed] [Google Scholar]
- 52.Simons K, Ikonen E. Functional rafts in cell membranes. Nature 387: 569–572, 1997. doi: 10.1038/42408. [DOI] [PubMed] [Google Scholar]
- 53.Simons K, Toomre D. Lipid rafts and signal transduction. Nat Rev Mol Cell Biol 1: 31–39, 2000. doi: 10.1038/35036052. [DOI] [PubMed] [Google Scholar]
- 54.Simons K, van Meer G. Lipid sorting in epithelial cells. Biochemistry 27: 6197–6202, 1988. doi: 10.1021/bi00417a001. [DOI] [PubMed] [Google Scholar]
- 55.Smart EJ, Ying Y, Donzell WC, Anderson RG. A role for caveolin in transport of cholesterol from endoplasmic reticulum to plasma membrane. J Biol Chem 271: 29427–29435, 1996. doi: 10.1074/jbc.271.46.29427. [DOI] [PubMed] [Google Scholar]
- 56.Song X, Liu BC, Lu XY, Yang LL, Zhai YJ, Eaton AF, Thai TL, Eaton DC, Ma HP, Shen BZ. Lovastatin inhibits human B lymphoma cell proliferation by reducing intracellular ROS and TRPC6 expression. Biochim Biophys Acta 1843: 894–901, 2014. doi: 10.1016/j.bbamcr.2014.02.002. [DOI] [PMC free article] [PubMed] [Google Scholar]
- 57.Straus DS. Effects of insulin on cellular growth and proliferation. Life Sci 29: 2131–2139, 1981. doi: 10.1016/0024-3205(81)90482-3. [DOI] [PubMed] [Google Scholar]
- 58.Subtil A, Gaidarov I, Kobylarz K, Lampson MA, Keen JH, McGraw TE. Acute cholesterol depletion inhibits clathrin-coated pit budding. Proc Natl Acad Sci USA 96: 6775–6780, 1999. doi: 10.1073/pnas.96.12.6775. [DOI] [PMC free article] [PubMed] [Google Scholar]
- 59.Taniguchi CM, Emanuelli B, Kahn CR. Critical nodes in signalling pathways: insights into insulin action. Nat Rev Mol Cell Biol 7: 85–96, 2006. doi: 10.1038/nrm1837. [DOI] [PubMed] [Google Scholar]
- 60.Taub M, Chuman L, Saier MH Jr, Sato G. Growth of Madin-Darby canine kidney epithelial cell (MDCK) line in hormone-supplemented, serum-free medium. Proc Natl Acad Sci USA 76: 3338–3342, 1979. doi: 10.1073/pnas.76.7.3338. [DOI] [PMC free article] [PubMed] [Google Scholar]
- 61.Terada Y, Inoshita S, Nakashima O, Yamada T, Kuwahara M, Sasaki S, Marumo F. Lovastatin inhibits mesangial cell proliferation via p27Kip1. J Am Soc Nephrol 9: 2235–2243, 1998. [DOI] [PubMed] [Google Scholar]
- 62.Tobert JA. Lovastatin and beyond: the history of the HMG-CoA reductase inhibitors. Nat Rev Drug Discov 2: 517–526, 2003. doi: 10.1038/nrd1112. [DOI] [PubMed] [Google Scholar]
- 63.Vainio S, Heino S, Mansson JE, Fredman P, Kuismanen E, Vaarala O, Ikonen E. Dynamic association of human insulin receptor with lipid rafts in cells lacking caveolae. EMBO Rep 3: 95–100, 2002. doi: 10.1093/embo-reports/kvf010. [DOI] [PMC free article] [PubMed] [Google Scholar]
- 64.Vosper J, Masuccio A, Kullmann M, Ploner C, Geley S, Hengst L. Statin-induced depletion of geranylgeranyl pyrophosphate inhibits cell proliferation by a novel pathway of Skp2 degradation. Oncotarget 6: 2889–2902, 2015. doi: 10.18632/oncotarget.3068. [DOI] [PMC free article] [PubMed] [Google Scholar]
- 65.Wang X, Abdel-Rahman AA. Effect of chronic ethanol administration on hepatic eNOS activity and its association with caveolin-1 and calmodulin in female rats. Am J Physiol Gastrointest Liver Physiol 289: G579–G585, 2005. doi: 10.1152/ajpgi.00282.2004. [DOI] [PubMed] [Google Scholar]
- 66.Xu C, Chen X, Chang C, Wang G, Wang W, Zhang L, Zhu Q, Wang L, Zhang F. Transcriptome analysis of hepatocytes after partial hepatectomy in rats. Dev Genes Evol 220: 263–274, 2010. doi: 10.1007/s00427-010-0345-1. [DOI] [PubMed] [Google Scholar]
- 67.Zhang Z, Wang L, Du J, Li Y, Yang H, Li C, Li H, Hu H. Lipid raft localization of epidermal growth factor receptor alters matrix metalloproteinase-1 expression in SiHa cells via the MAPK/ERK signaling pathway. Oncol Lett 12: 4991–4998, 2016. doi: 10.3892/ol.2016.5307. [DOI] [PMC free article] [PubMed] [Google Scholar]
- 68.Zundel W, Swiersz LM, Giaccia A. Caveolin 1-mediated regulation of receptor tyrosine kinase-associated phosphatidylinositol 3-kinase activity by ceramide. Mol Cell Biol 20: 1507–1514, 2000. doi: 10.1128/MCB.20.5.1507-1514.2000. [DOI] [PMC free article] [PubMed] [Google Scholar]
Associated Data
This section collects any data citations, data availability statements, or supplementary materials included in this article.