

Abstract
Basal-like breast cancer is an aggressive form of breast cancer with limited treatment options. The subgroup can be identified immunohistochemically, by lack of hormone receptor expression combined with expression of basal markers such as CK5/6 and/or epidermal growth factor receptor (EGFR). In vitro, several regulators of the actin cytoskeleton are essential for efficient invasion of basal-like breast cancer cell lines. Whether these proteins are expressed in vivo determines the applicability of these findings in clinical settings. The actin-regulating formin protein FHOD1 participates in invasion of the triple-negative breast cancer cell line MDA-MB-231. Here, we measure the expression of FHOD1 protein in clinical triple-negative breast cancers by using immunohistochemistry and further characterize the expression of another formin protein, INF2. We report that basal-like breast cancers frequently overexpress formin proteins FHOD1 and INF2. In cell studies using basal-like breast cancer cell lines, we show that knockdown of FHOD1 or INF2 interferes with very similar processes: maintenance of cell shape, migration, invasion, and proliferation. Inhibition of EGFR, PI3K, or mitogen-activated protein kinase activity does not alter the expression of FHOD1 and INF2 in these cell lines. We conclude that the experimental studies on these formins have implications in the clinical behavior of basal-like breast cancer.
Keywords: Formin, FHOD1, INF2, cytoskeleton, actin, triple-negative breast cancer, basal-like breast cancer, BT-549, MDA-MB-231
Introduction
Breast cancer is currently regarded a group of diseases, with at least 5 molecular subtypes based on gene expression profiling. These include basal-like, human epidermal growth factor receptor 2 (HER2) enriched, luminal A and B, and normal-like.1,2 Basal-like cancers are particularly aggressive with a tendency for hematogenous spread and poor outcome. They express genes that are normally found in basal/myoepithelial cells of mammary glands.
In clinical practice, all breast cancers are immunohistochemically screened for the expression of estrogen receptor (ER), progesterone receptor (PR), and HER2, as the presence of these offer targets for therapy. If none are present, the term triple-negative breast cancer (TNBC) is applied. A vast majority of TNBCs also express basal markers. However, the terms TNBC and basal-like breast cancer should not be considered as synonymous.3 The gene expression profile of the basal-like subtype of TNBC differs markedly from other breast cancer types and should biologically be regarded as a distinct type of cancer.4 In diagnostic routine, basal-like breast cancer is defined by immunohistochemical triple-negativity combined with presence of basal cytokeratins, for example, cytokeratins 5 and 6 and/or epidermal growth factor receptor (EGFR).5,6 A large study has shown that the basal-like subgroup identified by these 5 markers comprises a 9% subgroup with similar prognosis to that found in gene expression studies.7
There is currently no effective treatment for metastatic basal-like breast cancers. The success of EGFR inhibitors and EGFR monoclonal antibodies in treating colorectal cancer and non-small cell lung cancer has raised hopes for efficacy in basal-like breast cancer. Unfortunately, trials have revealed that very few basal-like breast cancer patients respond to such treatments.8 Further research is needed to help identify potential responders for EGFR treatment, and to refine understanding of cancer-associated signaling in basal-like breast cancer, keeping the possibility of multiple pathway inhibition in mind.
The cytoskeletal regulators that participate in the notably invasive behavior of basal-like cancer are largely unknown. Formins are a family of large, multi-domain proteins that remodel the actin cytoskeleton in both physiological and cancer-associated processes.9 The principal activity of formins is effective elongation of actin filaments.10 We have earlier found expression of leukocyte formin FMNL1 protein in a small number of basal-like breast cancers.11 However, studying cultured basal-like breast cancer cells, we have been unable to identify a significant functional role for FMNL1 (unpublished observation).
Formins FHOD1 and INF2 have functional properties that distinguish them from the rest of the family. FHOD1 has no actin elongating activity, but rather caps and bundles actin filaments into stress fibers.12 FHOD1 has been found at actin stress fibers and focal adhesions in cultured cells.13,14 INF2 can not only polymerize actin but also depolymerize and side-bind actin filaments.15,16 Formins are generally inactive until bound by Rho GTPases. Our 2 proteins are, however, differentially regulated—FHOD1 being activated through phosphorylation and INF2 possibly lacking direct regulation.16,17
FHOD1 has been studied in association with cancer. An increase of FHOD1 expression has been found in cancer-associated epithelial to mesenchymal transition (EMT), and knockdown has resulted in reduced migration and invasion of cultured squamous cell carcinoma, breast cancer, and melanoma cells.18–20 INF2 is also associated with human disease. Mutations in the INF2 gene cause kidney disease focal segmental glomerulosclerosis (FSGS) and FSGS-associated Charcot-Marie-Tooth neuropathy.21,22 INF2 exists as 2 isoforms, with variation in the far C-terminus. The non-CAAX variant is cytosolic, while the INF2-CAAX variant is bound to endoplasmic reticulum.23,24 In vitro, INF2 has been found to participate in several specific actin- and microtubule-related processes, such as mitochondrial fission, centrosome polarization in T cells and contractility of macrophage podosomes.25–27 Recently, INF2 depletion by shRNA in the prostate cancer line DU145 was shown to reduce migration and invasion.28 The potential association of INF2 with clinical cancer has to our knowledge not been studied.
In this study, we studied the expression of FHOD1 and INF2 in a large TNBC cohort. We found that increased expression of FHOD1 and INF2 is associated with basal-like breast cancer markers CK5/6 and EGFR. In cellular studies, we confirmed that FHOD1 is relevant for migration, invasion, and proliferation in basal-like breast cancer cells. For the first time, we showed that also INF2 participates in all these processes.
Materials and Methods
Patient identification
The study included 148 TNBCs diagnosed and treated at Turku University Hospital, Turku, Finland, during 1998-2015. All patients were treated with surgical resection or mastectomy including sentinel node biopsy and, in case of metastatic disease, axillary evacuation. Postoperative radiation therapy and adjuvant treatments were given in accordance with international guidelines for breast cancer classification and treatment at the time of diagnosis.29 Preoperative adjuvant treatments were not administered. Clinical follow-up information was available from pathology reports, patient files of all patients, and Auria Biobank. The follow-up data included the established prognostic parameters of clinical breast cancer treatment, that is, axillary lymph node status, tumor size, histological grade, hormone receptor and Her2-oncogene status, proliferation marker Ki-67, and intrinsic classification as recommended in the surrogate guidelines by the 12th St Gallen International Breast Cancer Conference (2011) Expert Panel.30 Causes of death were collected from autopsy reports, death certificates, and from the Finnish Cancer Registry. The range of follow-up was from 3 years 2 months to 18 years 0 months (mean 11 years 0 months).
All tissue materials were prepared according to basic clinical histopathology laboratory practice, that is, fixed in buffered formalin (pH 7.0) and embedded in paraffin. Immunohistochemistry was performed on tissue microarrays (TMAs) comprising 2 tissue cores from the tumor of each patient. The TMAs were prepared by punching the paraffin block of each tumor using a 1.5-mm diameter cylinder. Tissue cores from non-neoplastic breast as well as hormone-positive breast cancer were included in the TMAs as controls.
Of the clinicopathological parameters, the oldest part of the cohort lacked data on tumor size and proliferation index in patient journals. Tumor size was recorded for 123 cases, and tumor Ki-67 proliferation index for 126 cases.
The study was approved by the Ethic Committee of the Hospital District of Southwest Finland and the Auria Biobank. In accordance with the Finnish Biobank Act (688/2012), a separate informed consent from each patient was waived.
Immunohistochemistry
To study the expression of basal markers EGFR, CK5/6, and formins FHOD1 and INF2, the TMAs were sectioned at 3.5 μm. Epidermal growth factor receptor and CK5/6 were stained with a Ventana Benchmark XT staining device and reagents from Ventana (Ventana Medical Systems, Tucson, AZ). FHOD1 and INF2 stainings were performed according to the streptavidin-peroxidase method using a Labvision staining device (Thermo Fisher Scientific, Fremont, CA). For formin stainings, rabbit anti-human polyclonal monospecific antibodies were used (FHOD1: Sigma-Aldrich, St Louis, MA; catalogue number HPA024468 and INF2: Proteintech, Chicago, IL; catalogue number 20466-1-AP). FHOD1 was stained using a 1:150 dilution, INF2 using a 1:500 dilution. The INF2 target sequence is present in both the INF2-CAAX and non-CAAX isoforms.
Staining intensity was evaluated by 2 pathologists (NM and MG). In cases of disagreement, the cases were re-evaluated and discussed until consensus was reached. Both tissue samples from each patient were scored. CK5/6 an EGFR were scored as 0 (negative), 1 (>10% of tumor cells positive), or 2 (>50% of tumor cells positive). Any score ⩾1 in CK5/6 and/or EGFR staining was categorized as basal-like breast cancer. Formin FHOD1 and INF2 stainings were scored as 0 (negative), 1 (mild), 2 (moderate), or 3 (strong). The grading scheme is presented in Figure 1A.
Figure 1.

FHOD1 and INF2 immunohistochemistry in triple-negative breast cancer and in non-neoplastic breast. (A) The scoring scheme used for evaluation of FHOD1 (upper row) and INF2 (lower row) expression in breast cancer tissues. Negative staining was scored as 0. Endothelial cells were a positive internal control. Weak staining was scored as 1, intermediate as 2, and strong as 3. (B) FHOD1 and INF2 staining in lobular and ductal epithelium is generally weak or absent. In a minority of ductal cells, moderate INF2 staining is seen. Scale bar: 100 μm. (C) Graphical presentation of association between FHOD1 and INF2 staining intensity sums in the TNBC samples. FHOD1 and INF2 staining intensity sums from each sample gave a score of 0 to 6. The expression of FHOD1 is indicated on the x-axis, INF2 expression as colors on the y-axis. TNBC indicates triple-negative breast cancer.
Both tissue samples from each patient were evaluated, and immunohistochemical scores were summed across each sample pair to give 0 to 6 for FHOD1 and INF2, and 0 to 4 for CK5/6 and EGFR. FHOD1 and INF2 score sums 0 to 2 were regarded as negative/low expression, and sums 3 to 6 as moderate/high expression.
Cell lines and culture conditions
MDA-MB-231 cells were purchased from American Type Culture Collection (Manassas, VA, USA). BT-549 cells were from Cell Lines Service (Eppelheim, Germany). Both cell lines tested negative for mycoplasma and were not passaged longer than 6 months after being received or resuscitated from frozen aliquots. Both cell lines were cultured in RPMI 1640 (Gibco-BRL; Paisley, UK) supplemented with 10% fetal bovine serum (FBS), 5 mM ultraglutamine, and 100 U/mL penicillin-streptomycin (Gibco-BRL).
Transcriptomic analysis
For an overview of FHOD1 and INF2 expression in breast cancer cell lines of different subtypes, we took advantage of the online open science resource EMBL-EBI Expression Atlas.31 A search for FHOD1 and INF2 expression in breast cancer cell lines retrieved data from the Cancer Cell Line Encyclopedia.32
Transfection with small interfering RNAs
FHOD1 or INF2 expression was silenced in BT-549 and MDA-MB-231 cells using SMARTpool small interfering RNA (siRNA) (Dharmacon Research, Lafayette, CO). Non-targeting Pool siRNA was used as a control. Cells were transfected in suspension using Dharmafect 1 transfection reagent (Dharmacon), according to the manufacturer’s instructions. FHOD1 or INF2 expression was silenced at 50 nM siRNA concentration. For simultaneous knockdown of FHOD1 and INF2, 25 nM of each siRNA was used. The knockdown efficacy was examined 72 hours after transfection by immunoblotting.
Western blotting
Cells were harvested and lysed in RIPA buffer (50 mM Tris-HCl, 150 mM NaCl, 1% NP-40, 0.5% sodium deoxycholate, 0.1% sodium dodecyl sulfate (SDS)) supplemented with inhibitors (1 × Complete Mini-protease inhibitor cocktail [Roche, Basel, Switzerland] and 1 × PhosStop, a phosphatase inhibitor cocktail [Roche]). Insoluble cell debris was removed by centrifugation (21 000 g for 30 minutes at 4°C). The protein concentration of lysates was determined by the Bradford method (BioRad, Berkeley, CA) before adding 5x Laemmli to samples. Equal amounts of total protein were separated by SDS-PAGE and transferred to nitrocellulose membrane (Whatman PROTRAN, PerkinElmer, Shelton, CT). The membranes were blocked with 5% dry milk in TBST (Tris-buffered saline (TBS), 0.1% Tween) and immunoblotted with different antibodies diluted in 5% bovine serum albumin (BSA) in TBST.
The rabbit anti-human antibodies for FHOD1 (Sigma-Aldrich) and INF2 (Proteintech) were used at a 1:1000 and 1:2000 dilution, respectively. The secondary antibodies were HRP-conjugated swine anti-rabbit and HRP-conjugated rabbit anti-mouse immunoglobulins (1:2500, Dako, Glostrup, Denmark) diluted in block solution. Mouse HRP-conjugated GADPH antibody (Abcam, Cambridge, UK) was used as loading control. Membranes were washed 3 times with TBST between the different steps.
Cell immunofluorescence staining and microscopy
Cells were plated on gelatin (Sigma-Aldrich) precoated coverslips (13 mm) and grown in complete medium for 24 hours. These cells were fixed with 4% paraformaldehyde for 10 minutes at room temperature. The coverslips were washed with PBS and blocked with 5% BSA, 0.5% triton X-100 in PBS for 45 minutes. The rabbit anti-human FHOD1 or INF2 (1:200, Sigma-Aldrich or Proteintech, respectively) antibody was incubated for 1 hour at room temperature. Next, the coverslips were incubated with Alexa Fluor 568 goat anti-rabbit IgG (1:500, Invitrogen, Carlsbad, CA) or Alexa Fluor 488 goat anti-mouse IgG (1:500, Invitrogen).
Alexa Fluor 488- or 546-conjugated phalloidin (1:100, Invitrogen) was incubated together with the secondary antibodies to visualize filamentous actin. The mounting media contained DAPI for staining nuclei (ProLong Gold Antifade Mountant with DAPI, Thermo Fisher). After each staining step, the cells were washed 3 times with PBS. Images were taken with an Olympus BX60 fluorescence microscope and analyzed with ImageJ 1.49b software (http://rsbweb.nih.gov/ij/) for quantification of changes in morphology. For Figure 3B, images were taken with a Zeiss LSM780 confocal microscope (Carl Zeiss, Göttingen, Germany). Cell area in square pixels and AR (aspect ratio; major axis/minor axis) were calculated as shape descriptors of the morphology of the cells. An increasing AR indicates an increasingly elongated shape.
Figure 3.

Localization of FHOD1 and INF2 in basal-like breast cancer cell lines. (A) FHOD1 (red) is mostly seen as cytoplasmic dots in BT-549 and MDA-MB-231 cells. Clear co-localization with actin filament bundles (green) can be seen. (B) INF2 (red) is also distributed as dots in the cytoplasm. Co-localization with actin filaments (green) is present in both cell lines. Right panel shows higher magnification images of the marked (white box) areas.
Erlotinib treatment
To inhibit the EGFR signaling pathway, 70% confluent BT-549 and MDA-MB-231 cells were cultured with serum free medium overnight followed by a 5-hour incubation in medium containing 10 μM EGFR small molecule inhibitor Erlotinib (Cell Signaling Technology, Beverly, MA). Epidermal growth factor receptor inhibition was verified by immunoblotting with rabbit anti-Phospho-EGF Receptor (Tyr1068) (Cell Signaling Technology). The PI3K pathway was analyzed using rabbit anti-p-Akt and rabbit anti-Akt antibodies (Cell Signaling Technology), and mitogen-activated protein kinase (MAPK) pathway inhibition by immunoblotting with a rabbit anti-p-ERK 1/2 antibody (Cell Signaling Technology) and a rabbit anti-ERK 2 antibody (Santa Cruz Biotechnology, Santa Cruz, CA).
Migration, invasion, and transwell assays
In all, 50 × 103 cells were grown overnight in 96-well Essen BioScience ImageLock microplates (Essen Bioscience, Ann Arbor, MI) precoated with 100 μg/mL of Matrigel (Corning, Lowell, MA) in medium. Wounds were precisely made by the 96-pin Wound-Maker provided with the IncuCyte FLR (Essen Bioscience). After washing thoroughly with PBS to remove the detached cells, wounds were covered with 50 μL of Matrigel (for invasion) or 50 μL of medium (for migration). After 30 min in the incubator, 100 μL of complete medium was added and the cells were placed in the IncuCyte FLR. The wound images were automatically acquired from the incubator at 2-hour intervals for 48 hours. The kinetics of the relative wound density was analyzed by IncuCyte software (Essen Bioscience).
Single cell migration was studied by using a transwell migration assay. The 50 × 103 cells in 150 μL of medium without FBS were loaded into Boyden chambers (Millipore, Temecula, CA) placed in 24 well plates containing 900 μL of complete medium with 10% FBS. Cells were allowed to migrate through porous (8 µm) membranes for 48 hours. After medium removal, the chambers and wells were washed once with PBS. Non-migrating cells were removed from the upper chamber with a cotton swab, whereas migrating cells adherent to the underside of the filter were fixed and stained with Crystal Violet solution (0.05% Crystal Violet, 1% Formaldehyde, 1% methanol, PBS) for 10 minutes. The inserts were washed with water and allowed to dry overnight. To quantify the migrated cells, 1% SDS (400 μL per membrane in 24 well plate) was added to solubilize the stain from cells. The plate was agitated on an orbital shaker for 30 minutes until the color of the membranes was uniform. The absorbance of each sample was measured at 570 nm with the Multiskan FC Machine (Thermo Scientific).
Proliferation assessment
Cell proliferation was evaluated by calculating the percentage of Ki-67 positive cells stained with mouse anti-Ki-67 antibody (Dako) (1:100) followed by Alexa Fluor 488 goat anti-mouse IgG (1:500, Invitrogen). Images were taken with an Olympus BX60 fluorescence microscope and analyzed with ImageJ.
Statistical analysis
Statistical analyses were performed with SPSS, version 24 (SPSS, Chicago, IL). The chi-square and Fisher exact tests were used to compare frequencies between groups (Triple-negative nonbasal vs Triple-negative basal-like). The Spearman correlation test was used to evaluate relationships between variables. One-way analysis of variance (ANOVA) was performed using Tukey multiple comparison procedure to identify the differences between cell treatments. Error bars represent SD or SEM, as indicated. A value of P < .05 was taken to indicate statistical significance. All experiments were repeated at least 3 times.
Results
Expression of FHOD1 and INF2 in normal breast, breast cancer, and triple-negative breast cancer
Non-neoplastic breast tissue controls in the TMAs were studied to appreciate the baseline staining intensity of INF2 and FHOD1 formins in mammary epithelium. INF2 and FHOD1 staining intensity was low in non-neoplastic epithelium of breast, whereas positive INF2 and FHOD1 staining was seen in endothelium (Figure 1B). Endothelial staining was subsequently regarded as an internal positive control in the tumor samples.
The TMAs also included hormone-positive cancer tissues as controls: 5 breast cancers that were ER positive. FHOD1 and INF2 expression was absent/low in 4 cases and moderate/high in 1 case. This indicates that FHOD1 and INF2 expression is not specific for triple-negative cancer but can be found in other breast cancer types as well.
Among triple-negative cancers, when present, FHOD1 and INF2 staining was detected in cancer cell cytoplasm with uniform staining intensity within the tumor samples.
Of the 148 TNBCs, 147 samples could be reliably assessed for basal marker and formin expression. A total of 123 (83.7%) were positive for EGFR and/or CK5/6 expression, and were grouped as basal-like cancer, while 24 (16.3%) were negative for both markers and grouped as triple-negative nonbasal cancer (Table 1). The triple-negative nonbasal cancer patients were slightly younger than the basal-like cancer patients at diagnosis (mean age 54.6 vs 61.3 years, P = .05). There was no significant difference between tumor size, proliferation, or prevalence of lymph node metastases at surgery.
Table 1.
Characteristics of study population.
| Variable | Triple-negative nonbasal, n = 24 |
Triple-negative basal-like, n = 123 |
P | |||
|---|---|---|---|---|---|---|
| N or mean | % or SD | N or mean | % or SD | |||
| Age at surgery (y) | 54.6 | 9.8 | 61.3 | 16.2 | .050 | |
| Tumor diameter (mm) | 24.7 | 16.3 | 25.4 | 13.2 | .813 | |
| Ki-67 index (%) | 43.3 | 24.7 | 51.4 | 20.9 | .140 | |
| Lymph node positive | 7 | 30.4 | 40 | 32.5 | .844 | |
| FHOD1 | Moderate/high | 3 | 12.5 | 44 | 35.8 | .030 |
| Negative/low | 21 | 87.5 | 79 | 64.2 | ||
| INF2 | Moderate/high | 7 | 29.2 | 70 | 56.9 | .015 |
| Negative/low | 17 | 70.8 | 53 | 43.1 | ||
Statistically significant p-values are indicated in bold.
The expression of FHOD1 and INF2 differed between the nonbasal and basal-like TNBCs. Moderate/high expression of FHOD1 was significantly more common among basal-like cancers than triple-negative nonbasal cancers (35.8% vs 12.5%, P ⩽ .05). Moderate/high INF2 expression was also significantly more common among basal-like cancers (56.9% vs 29.2%, P ⩽ .05). Breast cancer specific survival was similar in FHOD1/INF2 moderate/high and negative/low groups, suggesting that the expression level of these formins does not have practical prognostic utility.
Next, we asked whether the FHOD1 or INF2 expression levels (0-6) among TNBCs associated with expression of basal markers EGFR or CK5/6 (0-4), tumor size, proliferation, or lymph node metastasis. A significant positive correlation was found between several of these variables using Spearman Rho test (Table 2). Not unexpectedly, a positive correlation between tumor size and Ki-67 proliferation index as well as lymph node metastasis was found. Another anticipated finding was a correlation between expression levels of the 2 basal markers EGFR and CK5/6. Epidermal growth factor receptor expression level furthermore covaried with the Ki-67 index. Interestingly, FHOD1 and INF2 expression highly significantly correlated with each other as well as with EGFR expression (P ⩽ .001). Of the 2 formins, only FHOD1 significantly correlated with CK5/6 expression (P ⩽ .05). A correlation between INF2 expression and Ki-67 index was also noted. The association between FHOD1 and INF2 immunohistochemical score sums is illustrated in Figure 1C.
Table 2.
Correlations between expression of FHOD1, INF2, EGFR, CK5/6, Ki-67, tumor size, and LN metastasis in TNBC.
| FHOD1 | INF2 | EGFR | CK5/6 | Ki-67 | Tumor size | LN status | ||
|---|---|---|---|---|---|---|---|---|
| FHOD1 | Correlation coefficient | 0.454** | 0.365** | 0.192* | −0.022 | −0.025 | 0.022 | |
| Sig. (2-tailed) | 0.000 | 0.000 | 0.020 | 0.810 | 0.769 | 0.795 | ||
| N | 147 | 147 | 147 | 126 | 142 | 146 | ||
| INF2 | Correlation coefficient | 0.454** | 0.404** | 0.070 | 0.231** | −0.064 | 0.090 | |
| Sig. (2-tailed) | 0.000 | 0.000 | 0.399 | 0.009 | 0.448 | 0.281 | ||
| N | 147 | 147 | 147 | 126 | 142 | 146 | ||
| EGFR | Correlation coefficient | 0.365** | 0.404** | 0.289** | 0.192* | 0.072 | −0.024 | |
| Sig. (2-tailed) | 0.000 | 0.000 | 0.000 | 0.031 | 0.393 | 0.773 | ||
| N | 147 | 147 | 147 | 126 | 142 | 146 | ||
| CK5/6 | Correlation coefficient | 0.192* | 0.070 | 0.289** | −0.040 | 0.005 | −0.026 | |
| Sig. (2-tailed) | 0.020 | 0.399 | 0.000 | 0.656 | 0.950 | 0.756 | ||
| N | 147 | 147 | 147 | 126 | 142 | 146 | ||
| Ki-67 | Correlation coefficient | −0.022 | 0.231** | 0.192* | −0.040 | 0.314** | 0.085 | |
| Sig. (2-tailed) | 0.810 | 0.009 | 0.031 | 0.656 | 0.000 | 0.343 | ||
| N | 126 | 126 | 126 | 126 | 123 | 126 | ||
| Tumor size | Correlation coefficient | −0.025 | −0.064 | 0.072 | 0.005 | 0.314** | 0.220** | |
| Sig. (2-tailed) | 0.769 | 0.448 | 0.393 | 0.950 | 0.000 | 0.009 | ||
| N | 142 | 142 | 142 | 142 | 123 | 142 | ||
| LN status | Correlation coefficient | 0.022 | 0.090 | −0.024 | −0.026 | 0.085 | .220** | |
| Sig. (2-tailed) | 0.795 | 0.281 | 0.773 | 0.756 | 0.343 | 0.009 | ||
| N | 146 | 146 | 146 | 146 | 126 | 142 |
Abbreviation: EGFR, epidermal growth factor receptor; LN, lymph node; TNBC, triple-negative breast cancer.
Correlation is significant at the .01 level; *Correlation is significant at the .05 level (Spearman Rho test).
Statistically significant p-values are indicated in bold.
FHOD1 and INF2 expression in breast cancer cell lines
The general level of FHOD1 and INF2 mRNA expression in breast cancer cell lines was compared by searching the EMBL-EBI Expression Atlas for breast cancer cell lines (https://www.ebi.ac.uk/). We found that the expression was highly variable across cell lines of different types. FHOD1 and INF2 expressions were to some extent found in cell lines of all studied subtypes. The mRNA levels of FHOD1 and INF2 were higher in the basal-like cell line MDA-MB-231 than in BT-549. FHOD1 and INF2 mRNA levels in cell lines of different phenotypes and expression patterns according to Kao et al33 are presented in Figure 2.
Figure 2.
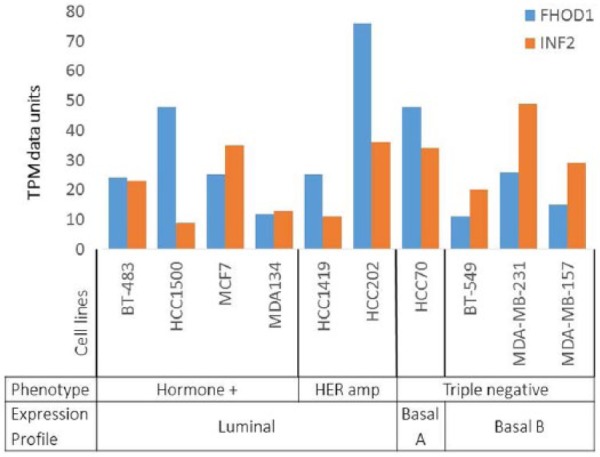
Expression of FHOD1 and INF2 mRNA in breast cancer cell lines of different type. FHOD1 and INF2 mRNA expression is not specific for basal-like breast cancer cell lines. Expression is found in all subtypes at variable levels. TPM indicates transcripts per million.
Next, we focused our functional studies on 2 basal-like breast cancer cell lines that express FHOD1 and INF2. The cell lines BT-549 and MDA-MB-231 have a basal-like transcriptional signature.33 In western blotting of lysates from these cell lines, bands of expected molecular weight were detected using both FHOD1 and INF2 antibodies. Of the 2 cell lines, higher expression of INF2 protein was found in the MDA-MB-231 cell line. Immunofluorescence double staining of BT-549 and MDA-MB-231 cells with phalloidin and either anti-FHOD1 or anti-INF2 and showed endogenous FHOD1 and INF2 to be localized in the cytoplasm, mostly as small dots. Co-localization of FHOD1 and INF2 and actin filament bundles was clear (Figure 3A and B). No association of FHOD1 or INF2 with invadopodia-like ventral actin structures was observed.
FHOD1 and INF2 expression is not dependent on MAPK-, PI3K-, or EGFR activity in basal-like breast cancer cells
We have shown previously that FHOD1 expression depends on active PI3K signaling but not MAPK signaling in cultured oral squamous cell carcinoma (SCC) cells and melanoma cell lines.18,20 To investigate whether similar regulation is found in basal-like breast cancer, we treated BT-549 and MDA-MB-231 cells with the PI3K inhibitor LY294002 and the MAPK inhibitor U0126.
Western blotting showed that in BT-549 cells, both PI3K and MAPK signaling was active; pAkt and pMAPK bands were present in western blotting. In MDA-MB-231 cell, a strong pMAPK band was present, but no pAkt band, indicating that MAPK signaling but not PI3K signaling was active.
We found that addition of U0126 or LY294002 efficiently inhibited MAPK and PI3K signaling as seen by loss of pMAPK and pAkt bands, respectively. Inhibition of these pathways did not influence the intensity of FHOD1 and INF2 bands, indicating that the expression of FHOD1 and INF2 is independent of MAPK and PI3K signaling in these cell lines (not shown).
Next, we asked whether EGFR activity is a prerequisite for FHOD1 and INF2 expression. To test this, BT-549 and MDA-MB-231 cells were treated with the EGFR small molecule inhibitor erlotinib for 5 hours. The treatment efficiently reduced phosphorylation of EGFR as studied by western blotting. However, the FHOD1 and INF2 expression levels remained unchanged (not shown). Our findings suggest that EGFR activity does not under these circumstances regulate the expression of FHOD1 and INF2.
Effects of FHOD1 and INF2 silencing on breast cancer cell morphology, migration, and invasion
To explore the functional roles of FHOD1 and INF2 in basal-like breast cancer cell lines, BT-549 and MDA-MB-231 cells were transfected with siRNA either targeting FHOD1 or INF2, or with control siRNA. The efficiency of knockdown was confirmed by western blotting (Figure 4A). Knockdown of FHOD1 or INF2 did not reduce expression of the other. This suggests that these formins are not dependent on each other for expression.
Figure 4.

Knockdown of FHOD1 and INF2 expression is accompanied by morphological and functional alterations in basal-like breast cancer cell lines. (A) Western blotting confirms that the expression of both formins is markedly reduced by siRNA treatment. (B) Quantification of Transwell migration experiments show that migration is significantly reduced in both cell lines on knockdown of FHOD1 or INF2. (C) The cell area significantly increases on FHOD1 or INF2 knockdown in BT-549 cells as compared with control cells. Cellular axis ratio is decreased, indicating that cells were less elongated and more round than control cells. The reduction of axis ratio is statistically significant only for INF2 knockdown. (D) Knockdown of INF2 alters the morphology of MDA-MB-231 cells in a similar way: cell area and roundness are increased. FHOD1 knockdown has a minor effect on morphology in this cell line. (E) Graph illustrating wound confluence of BT-549 cells as a function of time. Wound healing and invasion is significantly slower after FHOD1 and INF2 depletion. (F) Graphs from wound healing and invasion assays using MDA-MB-231 cells. Wound healing and invasion is slower in FHOD1 or INF2 knockdown groups than control cells. (G) The proliferation index, measured as percent of Ki-67 positive cells, is reduced by FHOD1 and especially by INF2 depletion. Error bars indicate standard deviation. AR indicates axis ratio; OD, standardised extracted crystal violet optical density; px, pixels.
*P ⩽ .05; **P ⩽ .01; ***P ⩽ .001.
To test whether single cell migration was influenced by FHOD1 or INF2 knockdown, a Boyden chamber migration assay was conducted. In this assay, we found that that BT-549 and MDA-MB-231 cells migrated less efficiently after FHOD1 or INF2 knockdown. The reduction was statistically significant in both BT-549 and MDA-MB-231 cells when compared with control siRNA treated cells (P < .05 and P < .01, respectively; Figure 4B).
Next, we wanted to quantify the change in cell morphology. Roundness was described by calculating an axis ratio, where the length of the cell long axis is divided by the short axis. Statistically significant increases of cell areas and roundness were detected in INF2 knockdown in both cell lines. FHOD1 knockdown had a modest effect on morphology and a trend of increased roundness and area was seen, but only the increase of cell area in BT-549 cells reached statistical significance.
To further test FHOD1 and INF2 knockdown effects on cell motility and invasion, a wound healing experiment and invasion assay using Matrigel as matrix was conducted using the Incucyte system. This method enables monitoring of conventional 2-dimensional wound healing and cell invasion into a Matrigel plug. For this experiment, we also carried out double knockdown of both FHOD1 and INF2. In this assay, we found a healing delay as well as reduced invasion in comparison with control cells in both FHOD1 and INF2 depleted cells. The double knockdown cells healed the wound and invaded similarly as INF2 or FHOD1 depleted cells. No significant additional effect was detected. The reduction of wound healing and invasion was statistically significant for all siRNA treatments in both BT-549 cells (Figure 4E) and MDA-M-231 cells (Figure 4F) (P ⩽ .01, ANOVA).
FHOD1 and INF2 knockdown reduces proliferation
As immunohistochemical analysis indicated a correlation between INF2 expression and tumor cell proliferation, we wanted to test this link in vitro. For this purpose, FHOD1 and INF2 depleted cells and control cells were stained with proliferation marker Ki-67. The percentage of Ki-67 positive nuclei was calculated in each group. A marked reduction of proliferation was seen in the INF2 (P < .01) and FHOD1 (P < .05) depleted cells. The reduction was highly similar in BT-549 and MDA-MB-231 cells (Figure 4G).
Discussion
Of the breast cancer subtypes, TNBC has the highest probability of recurrence but still awaits the targeted therapies available for most other breast cancers. It is therefore of crucial importance to better understand the biology of TNBC and reveal the mechanisms that drive its aggressive behavior. Although it is known that alterations in cytoskeletal components contribute to cell migration, invasion, and cell survival, their expression and functions in TNBC is still poorly studied.
Here we characterized a large set of TNBC tumors is for expression of basal-like markers and the formin proteins FHOD1 and INF2. Both formins have been the focus of intense research in vitro but have barely been studied at the protein level in clinical cancer. We found that FHOD1 and INF2 are frequently overexpressed in TNBC in comparison with normal epithelium and are associated with presence of markers for the basal-like subgroup, above all the expression of EGFR. We further describe the very similar effects of FHOD1 or INF2 depletion on basal-like breast cancer cell lines BT-549 and MDA-MB-231: rounder cell shape, inferior capacity to migrate/invade, and reduced proliferation.
A profound change of cell morphology, from cobblestone-like to elongated, mesenchymal-like is required when cells migrate, invade, and metastasize. Such a transition requires substantial rearrangement of the cytoskeleton, a process made possible through EMT. In a study on a TNBC cell line, Jurmeister et al19 found that FHOD1 is a target of the EMT repressing miRNA-200c. Furthermore, they found an inverse correlation of miRNA-200c and FHOD1 mRNA in breast cancer samples. However, it has not been established whether FHOD1 protein is expressed in clinical TNBC. We found that 32% of our sample of TNBCs overexpress FHOD1. Patients with high versus low FHOD1 expression did not, however, differ in survival analysis. Thus, progression of TNBC is clearly not entirely dependent on overexpression of FHOD1. Nevertheless, the results from this study show that in a subgroup of TNBC patients, FHOD1 is overexpressed and may consequently partly mediate the cytoskeletal change required for invasion.
On a cellular level, we found that knockdown of FHOD1 in 2 basal-like breast cancer cell lines resulted in larger cell areas and inferior capacity to migrate, invade, and proliferate. These results are in line with previous studies identifying FHOD1 as a key player in maintaining elongated cell shape and migration.13,34 Furthermore, in basal-like breast cancer cells, FHOD1 expression has further been linked to EMT and invasion.18,19 Our previous study on a melanoma xenograft model showed that FHOD1 plays an important role in tumor growth and tumor cell proliferation in vivo, and that FHOD1 depletion was accompanied by cell cycle arrest.20 Taken together, the results from these studies suggest that FHOD1 has very similar effects on cell morphology, motility, and possibly also proliferation across different cell types.
Germline INF2 mutations have previously been associated with human disease. A mutation in the INF2 gene causes kidney and peripheral nerve disease.21,22 INF2 expression or function has, to our knowledge, not previously been studied in clinical cancer. In samples from non-neoplastic breast, we found that INF2 expression was low. In the TNBC cohort, however, 52% had moderate/high INF2 expression. INF2 overexpression was even more common among the basal-like TNBCs (57%). Of interest, we found a clear positive correlation of INF2 expression with both EGFR expression and proliferation index. In cell studies, we found that INF2 knockdown was accompanied by significant decrease of proliferation. This association is to our knowledge a novel finding. We have not yet studied the molecular basis of this reduction further. However, a potential mechanism could be the actin-mediated effects that formins have on transcription. Both FHOD1 and INF2 can, through their effect on the globular actin pool, activate the serum response factor (SRF). The SRF activates transcription from a multitude of cytoskeleton- and even cell cycle-associated genes.35 The association of FHOD1 with SRF activation has been shown in MDA-MB-231 basal-like breast cancer cells, and for INF2 in retinal pigmented epithelial cell line RPE-1.19,36 Whether FHOD1 and INF2 generally participate in maintaining proliferation in cell lines, and whether this is a direct mechanism of formins or mediated by indirect, actin-mediated alteration of transcription remains to be discovered.
In addition, we found that INF2 silencing had very similar effects on cell morphology and function as seen in FHOD1 depletion: an increase in cell area and roundness and a reduced capacity to migrate and invade. Simultaneous knockdown of both INF2 and FHOD1 was also conducted but without evidence for additive effect on morphology, migration, or invasion. This suggests that the formins regulate different aspects of a common process. Such interplay has been reported previously: In macrophages, FHOD1 and INF2 were both found in the actin-rich and contractile adhesion structures, that is, macrophage podosomes. FHOD1 was found to mediate actomyosin contractility between podosomes, while INF2 regulated intra-podosomal contractility. Both proteins were necessary for efficient de novo formation of podosomes.27 In addition to the lack of synergistic effect of knockdown, we are inclined to think that the prevalent co-expression of FHOD1 and INF2 in clinical samples supports the idea of alliance. Nevertheless, extensive future studies are essential to confirm significance and detailed mechanism of the interplay between FHOD1 and INF2 in basal-like breast cancer.
The regulation of FHOD1 and INF2 expression is incompletely characterized. FHOD1 has been found to be a target of miRNAs in breast cancer EMT, where TGFβ-induced EMT was found to be mediated by FHOD1.19 Furthermore, FHOD1 has been found to be induced by EMT-associated transcription factors Snail and ZEB1 in squamous cell carcinoma cells.18. In the same cell line, inhibition of PI3K signaling markedly reduced FHOD1 expression. Here, we found that in clinical TNBC samples, FHOD1 and INF2 expression clearly correlated with EGFR. We considered that EGFR activity might be an upstream regulating factor. However, inhibiting EGFR activity with erlotinib in basal-like cell lines did not reduce FHOD1 or INF2 expression. Our results suggest that FHOD1 and INF2 expression does not rely on EGFR activity in basal-like breast cancer. Inhibition of PI3K and MAPK signaling was equally ineffective, which suggests that the regulation of formin expression is most likely complex and can vary between cell types. EMT-associated transcription factors or miRNAs were not addressed in this study, and they remain possible candidates for further investigation.
The treatment of TNBC includes surgery, radiotherapy, and chemotherapy—no targeted treatment is available. Intensive TNBC research aims to elucidate the mechanistic underspinning of its rapid proliferation and poor prognosis, as well as find potential targets for therapy. The cytoskeleton itself as well as cell migration and EMT are potential future therapeutic targets in TNBC.37 This study shows that 2 formin proteins, FHOD1 and INF2, are not only associated with migration, invasion, and proliferation of cultured cells but are also frequently present at an increased level in TNBC tissue, especially in basal-like cancer. This finding should stimulate formin research, particularly pharmacologic, aiming to inhibit the activity of specific formins in TNBC.
Conclusions
In this study, we report that clinical TNBCs that express markers of basal-like differentiation frequently overexpress actin-regulating proteins FHOD1 and INF2. We further show that knockdown of FHOD1 and INF2 in basal-like breast cancer cells alters their shape, reduces migration and invasion, and further attenuates proliferation activity. Taken together, these findings suggest that FHOD1 and INF2 have a significant role in the malignant behavior of basal-like breast cancer. Their expression may bring about properties that mediate migration, invasion, and proliferation. Accordingly, they are potential targets for pharmacologic inhibition in basal-like cancer.
Acknowledgments
The authors wish to thank the staff at Auria Biobank and Sinikka Kollanus for skilful technical assistance.
Footnotes
Author Contributions: VDH, MG, and OC planned the study. VDH and MG drafted the manuscript. MG and NM evaluated immunohistochemical stainings. VDH and JM conducted cellular experiments. PK and HR selected tissues for TMAs and collected clinical data. SK collected clinical data and performed statistical analyses. All authors contributed to and approved the final manuscript.
Funding:The author(s) disclosed receipt of the following financial support for the research, authorship, and/or publication of this article: This study was supported by funding from the Medical Society of Finland, the Sigrid Juselius Foundation, Turku University Hospital Research Funds, the Cancer Society of South West Finland, and the Perklén Foundation. JM has received financial support from the Academy of Medical Sciences INSPIRE Programme and The Rothley Trust.
Declaration of conflicting interests:The author(s) declared no potential conflicts of interest with respect to the research, authorship, and/or publication of this article.
References
- 1. Perou CM, Sorlie T, Eisen MB, et al. Molecular portraits of human breast tumours. Nature. 2000;406:747–752. [DOI] [PubMed] [Google Scholar]
- 2. Sorlie T, Perou CM, Tibshirani R, et al. Gene expression patterns of breast carcinomas distinguish tumor subclasses with clinical implications. Proc Natl Acad Sci U S A. 2001;98:10869–10874. [DOI] [PMC free article] [PubMed] [Google Scholar]
- 3. Prat A, Adamo B, Cheang MC, Anders CK, Carey LA, Perou CM. Molecular characterization of basal-like and non-basal-like triple-negative breast cancer. Oncologist. 2013;18:123–133. [DOI] [PMC free article] [PubMed] [Google Scholar]
- 4. Prat A, Pineda E, Adamo B, et al. Clinical implications of the intrinsic molecular subtypes of breast cancer. Breast. 2015;24:S26–S35. [DOI] [PubMed] [Google Scholar]
- 5. Nielsen TO, Hsu FD, Jensen K, et al. Immunohistochemical and clinical characterization of the basal-like subtype of invasive breast carcinoma. Clin Cancer Res. 2004;10:5367–5374. [DOI] [PubMed] [Google Scholar]
- 6. Livasy CA, Karaca G, Nanda R, et al. Phenotypic evaluation of the basal-like subtype of invasive breast carcinoma. Mod Pathol. 2006;19:264–271. [DOI] [PubMed] [Google Scholar]
- 7. Cheang MC, Voduc D, Bajdik C, et al. Basal-like breast cancer defined by five biomarkers has superior prognostic value than triple-negative phenotype. Clin Cancer Res. 2008;14:1368–1376. [DOI] [PubMed] [Google Scholar]
- 8. Nakai K, Hung MC, Yamaguchi H. A perspective on anti-EGFR therapies targeting triple-negative breast cancer. Am J Cancer Res. 2016;6:1609–1623. [PMC free article] [PubMed] [Google Scholar]
- 9. Randall TS, Ehler E. A formin-g role during development and disease. Eur J Cell Biol. 2013;93:205–211. [DOI] [PubMed] [Google Scholar]
- 10. Chesarone MA, DuPage AG, Goode BL. Unleashing formins to remodel the actin and microtubule cytoskeletons. Nat Rev Mol Cell Biol. 2010;11:62–74. [DOI] [PubMed] [Google Scholar]
- 11. Gardberg M, Heuser VD, Iljin K, Kampf C, Uhlen M, Carpen O. Characterization of leukocyte formin FMNL1 expression in human tissues. J Histochem Cytochem. 2014;62:460–470. [DOI] [PMC free article] [PubMed] [Google Scholar]
- 12. Schonichen A, Mannherz HG, Behrmann E, et al. FHOD1 is a combined actin filament capping and bundling factor that selectively associates with actin arcs and stress fibers. J Cell Sci. 2013;126:1891–1901. [DOI] [PubMed] [Google Scholar]
- 13. Iskratsch T, Yu CH, Mathur A, et al. FHOD1 is needed for directed forces and adhesion maturation during cell spreading and migration. Dev Cell. 2013;27:545–559. [DOI] [PMC free article] [PubMed] [Google Scholar]
- 14. Schulze N, Graessl M, Blancke Soares A, Geyer M, Dehmelt L, Nalbant P. FHOD1 regulates stress fiber organization by controlling the dynamics of transverse arcs and dorsal fiber. J Cell Sci. 2014;127:1379–1393. [DOI] [PubMed] [Google Scholar]
- 15. Ramabhadran V, Hatch AL, Higgs HN. Actin monomers activate inverted formin 2 by competing with its autoinhibitory interaction. J Biol Chem. 2013;288:26847–26855. [DOI] [PMC free article] [PubMed] [Google Scholar]
- 16. Hegsted A, Yingling CV, Pruyne D. Inverted formins: a sub-family of atypical formins. Cytoskeleton (Hoboken). 2017;74:405–419. [DOI] [PMC free article] [PubMed] [Google Scholar]
- 17. Takeya R, Taniguchi K, Narumiya S, Sumimoto H. The mammalian formin FHOD1 is activated through phosphorylation by ROCK and mediates thrombin-induced stress fibre formation in endothelial cells. EMBO J. 2008;27:618–628. [DOI] [PMC free article] [PubMed] [Google Scholar]
- 18. Gardberg M, Kaipio K, Lehtinen L, et al. FHOD1, a formin upregulated in epithelial-mesenchymal transition, participates in cancer cell migration and invasion. PLoS ONE. 2013;8:e74923. [DOI] [PMC free article] [PubMed] [Google Scholar]
- 19. Jurmeister S, Baumann M, Balwierz A, et al. MicroRNA-200c represses migration and invasion of breast cancer cells by targeting actin-regulatory proteins FHOD1 and PPM1F. Mol Cell Biol. 2012;32:633–651. [DOI] [PMC free article] [PubMed] [Google Scholar]
- 20. Peippo M, Gardberg M, Lamminen T, Kaipio K, Carpen O, Heuser VD. FHOD1 formin is upregulated in melanomas and modifies proliferation and tumor growth. Exp Cell Res. 2017;350:267–278. [DOI] [PubMed] [Google Scholar]
- 21. Brown EJ, Schlondorff JS, Becker DJ, et al. Mutations in the formin gene INF2 cause focal segmental glomerulosclerosis. Nat Genet. 2010;42:72–76. [DOI] [PMC free article] [PubMed] [Google Scholar]
- 22. Boyer O, Nevo F, Plaisier E, et al. INF2 mutations in Charcot-Marie-Tooth disease with glomerulopathy. N Engl J Med. 2011;365:2377–2388. [DOI] [PubMed] [Google Scholar]
- 23. Chhabra ES, Ramabhadran V, Gerber SA, Higgs HN. INF2 is an endoplasmic reticulum-associated formin protein. J Cell Sci. 2009;122:1430–1440. [DOI] [PMC free article] [PubMed] [Google Scholar]
- 24. Ramabhadran V, Korobova F, Rahme GJ, Higgs HN. Splice variant-specific cellular function of the formin INF2 in maintenance of Golgi architecture. Mol Biol Cell. 2011;22:4822–4833. [DOI] [PMC free article] [PubMed] [Google Scholar]
- 25. Korobova F, Ramabhadran V, Higgs HN. An actin-dependent step in mitochondrial fission mediated by the ER-associated formin INF2. Science. 2013;339:464–467. [DOI] [PMC free article] [PubMed] [Google Scholar]
- 26. Andres-Delgado L, Anton OM, Bartolini F, et al. INF2 promotes the formation of detyrosinated microtubules necessary for centrosome reorientation in T cells. J Cell Biol. 2012;198:1025–1037. [DOI] [PMC free article] [PubMed] [Google Scholar]
- 27. Panzer L, Trube L, Klose M, et al. The formins FHOD1 and INF2 regulate inter- and intra-structural contractility of podosomes. J Cell Sci. 2016;129:298–313. [DOI] [PubMed] [Google Scholar]
- 28. Jin X, Wang J, Gao K, et al. Dysregulation of INF2-mediated mitochondrial fission in SPOP-mutated prostate cancer. PLoS Genet. 2017;13:e1006748. [DOI] [PMC free article] [PubMed] [Google Scholar]
- 29. Goldhirsch A, Ingle JN, Gelber RD, et al. Thresholds for therapies: highlights of the St Gallen International Expert Consensus on the primary therapy of early breast cancer 2009. Ann Oncol. 2009;20:1319–1329. [DOI] [PMC free article] [PubMed] [Google Scholar]
- 30. Goldhirsch A, Wood WC, Coates AS, et al. Strategies for subtypes—dealing with the diversity of breast cancer: highlights of the St. Gallen International Expert Consensus on the primary therapy of early breast cancer 2011. Ann Oncol. 2011;22:1736–1747. [DOI] [PMC free article] [PubMed] [Google Scholar]
- 31. Petryszak R, Keays M, Tang YA, et al. Expression Atlas update—an integrated database of gene and protein expression in humans, animals and plants. Nucleic Acids Res. 2016;44:D746–D752. [DOI] [PMC free article] [PubMed] [Google Scholar]
- 32. Barretina J, Caponigro G, Stransky N, et al. The Cancer Cell Line Encyclopedia enables predictive modelling of anticancer drug sensitivity. Nature. 2012;483:603–607. [DOI] [PMC free article] [PubMed] [Google Scholar]
- 33. Kao J, Salari K, Bocanegra M, et al. Molecular profiling of breast cancer cell lines defines relevant tumor models and provides a resource for cancer gene discovery. PLoS ONE. 2009;4:e6146. [DOI] [PMC free article] [PubMed] [Google Scholar]
- 34. Gasteier JE, Schroeder S, Muranyi W, Madrid R, Benichou S, Fackler OT. FHOD1 coordinates actin filament and microtubule alignment to mediate cell elongation. Exp Cell Res. 2005;306:192–202. [DOI] [PubMed] [Google Scholar]
- 35. Olson EN, Nordheim A. Linking actin dynamics and gene transcription to drive cellular motile functions. Nat Rev Mol Cell Biol. 2010;11:353–365. [DOI] [PMC free article] [PubMed] [Google Scholar]
- 36. Fernandez-Barrera J, Bernabe-Rubio M, Casares -Arias J, et al. The actin-MRTF-SRF transcriptional circuit controls tubulin acetylation via alpha-TAT1 gene expression. J Cell Biol. 2018;217:929–944. [DOI] [PMC free article] [PubMed] [Google Scholar]
- 37. Engebraaten O, Vollan HKM, Borresen-Dale AL. Triple-negative breast cancer and the need for new therapeutic targets. Am J Pathol. 2013;183:1064–1074. [DOI] [PubMed] [Google Scholar]