

In Brief
Mocholi et al. show that, following T cell activation, activation of autophagy constitutes a tolerance-avoidance mechanism that, through modulation of cell metabolism and specific signaling pathways, allows T cells to engage in effector responses and avoid anergy. In vivo inhibition of autophagy in T cells induces tolerance and prevents autoimmunity.
In response to activation, CD4+ T cells upregulate autophagy. However, the functional consequences of that upregulation have not been fully elucidated. In this study, we identify autophagy as a tolerance-avoidance mechanism. Our data show that inhibition of autophagy during CD4+ T cell activation induces a long-lasting state of hypo-responsiveness that is accompanied by the expression of an anergic gene signature. Cells unable to induce autophagy after T cell receptor (TCR) engagement show inefficient mitochondrial respiration and decreased turnover of the protein tyrosine phosphatase PTPN1, which translates into defective TCR-mediated signaling. In vivo, inhibition of autophagy during antigen priming induces T cell anergy and decreases the severity of disease in an experimental autoimmune encephalomyelitis mouse model. Interestingly, CD4+ T cells isolated from the synovial fluid of juvenile idiopathic arthritis patients, while resistant to suboptimal stimulation-induced anergy, can be tolerized with autophagy inhibitors. We propose that autophagy constitutes a tolerance-avoidance mechanism, which determines CD4+ T cell fate.

INTRODUCTION
Mechanisms of peripheral T cell tolerance exist to control the activity of T cells that bear self-reactive T cell receptors (TCRs) and may have escaped thymic deletion. Among them, anergy is defined as a state of unresponsiveness that is established in T cells as a consequence of suboptimal stimulation (Schwartz, 2003; Valdor and Macian, 2013). Anergy is important to prevent autoimmunity, and it has also been recently shown to participate in the generation of peripheral regulatory T cells (Treg) (Kalekar et al., 2016). In response to anergizing stimuli, T cells induce an NFAT-dependent program of gene expression that is responsible for the blockade of signaling pathways and the inhibition of cytokine gene expression (Macia´ n et al., 2002; Valdor and Macian, 2013).
Classically, this unresponsive state was defined as resulting from engagement of the TCR in the absence of costimulation (Jenkins et al., 1990). Subsequent studies, however, expanded our understanding of the complex set of inputs that T cells integrate to determine their fate and engage in effector functions or become anergic. Not only the presence of CD28 signaling, but also several other environmental cues, including cytokines, coinhibitory receptors, and nutrient sensors, have a determining role on ultimately deciding T cell fate (Chappert and Schwartz, 2010).
Autophagy is a catabolic process through which different cytosolic cargo, which may range from soluble proteins to whole organelles, is sequestered in de novo formed double-membrane vesicles, named autophagosomes, which fuse with lysosomes where cargo is degraded. This process is tightly controlled by a series of kinase complexes that regulate the orchestrated assembly of autophagy-related proteins (Atg) to modulate autophagosome formation and cargo degradation (Liang et al., 1999; Suzuki et al., 2001). Protein turnover through autophagy is necessary not only to control the accumulation of damaged cell materials and recycle their molecular components for catabolic or anabolic processes, but it also allows for the modification of protein levels in response to extracellular signals. Autophagy has been shown regulate a multitude of cellular processes, including responses to starvation, programs of cell development and differentiation, or elimination of pathogens (Mizushima, 2009). In T cells, basal autophagy modulates organelle homeostasis (Pua et al., 2009); however, autophagy is markedly induced in activated CD4+ T cells, where it becomes important to maintain cell proliferation and cytokine expression (Hubbard et al., 2010; Pua et al., 2007). Autophagy is likely involved in the regulation of the bioenergetic metabolism in activated T cells, because T cells unable to activate autophagy show a dramatic reduction in ATP production following activation (Hubbard et al., 2010). However, whether activation of autophagy is required to determine cell fate and engage effector functions is currently not known. To address this issue, we have explored the possibility that activation of autophagy following TCR engagement might act as a tolerance-avoidance mechanism. Here, we show that autophagy-mediated regulation of signaling events downstreamof the TCR and cell metabolism is required to avoid T cell tolerance. Consequently, autophagy inhibition reduces the severity of spinal cord damage in an experimental autoimmune encephalitis (EAE) mouse model and restores tolerance in T cells from juvenile idiopathic arthritis (JIA) patients. Overall, our studies unveil a specific role for autophagy in T helper cells and identify this essential cell process as a required step to establish efficient T cell responses and avoid T cell tolerance.
RESULTS
Inhibition of Autophagy Induces T Cell Anergy
Signaling from the IL-2 receptor participates in the induction of autophagy in CD4+ T cells (Botbol et al., 2015). Given the central role of IL-2 in the regulation of T cell tolerance (Wells, 2009) and the involvement of autophagy in the regulation of CD4+ T cell activation (Hubbard et al., 2010; Pua et al., 2007), we asked whether induction of autophagy might be required to prevent the establishment of functional anergy. Ex vivo, functional anergy has been best characterized in CD4+ T cell clones and T helper 1 (Th1) cells. In vitro differentiated Th1 cells were thus used to identify whether autophagy could constitute a tolerance-avoidance mechanism. Th1 cells were activated for 24 hr in the presence of 3-methyladenine (3MA) to inhibit PI3-kinase type III, required for autophagosome formation, or leupeptin and ammonium chloride (L/N), which inhibits lysosomal acid hydrolases. Cells were then extensively washed and rested for 5 days before assessing responses to re-stimulation. T cells that were activated in the presence of autophagy inhibitors became hyporesponsive to re-stimulation and proliferated less and produced less IL-2 than control cells, without any significant increase in cell death (Figure 1A; Figure S1). To rule out non-reversible effects of inhibitors on autophagy and at the same time determine whether modulation of basal autophagy might also regulate T cell fate, we incubated resting Th1 cells with 3MA or L/N for 24 hr, profusely washed them, and left them resting for an additional 5-day period. Upon re-stimulation, no differences in T cell responses were observed in any of the tested conditions (Figure 1B). We then analyzed the consequences of silencing essential auto phagy-related genes (Atg) (Mizushima et al., 1998) during activation using a transient small interfering RNA (siRNA)-based approach that ensured that Atg genes would be silenced during the initial activation, but that expression would be restored when responses to re-stimulation were assessed. Twenty-four hours after siRNA transfection, expression of Atg7 was reduced to approximately 20% of control cell levels (Figure 1C). At this point, cells were stimulated for 24 hr and then left resting for 5 additional days, which allowed for full restoration of Atg7 expression (Figure 1C). Similar to what we had seen using 3MA or L/N, cells that were activated after being transfected with Atg7-targeting siRNAs became hypo-responsive to re-stimulation (Figure 1D). Furthermore, the induction of that unresponsive state occurred only when activation-induced autophagy was inhibited, but not when basal autophagy was transiently blocked by Atg7 silencing (Figure 1E). To validate these observations, we performed experiments using siRNAs specific for Atg5 and obtained similar results (Figure S2), further supporting that autophagy might represent a tolerance-avoidance mechanism, because cells that are prevented from inducing autophagy following activation become hypo-responsive to re-stimulation.
Figure 1. Inhibition of Autophagy during Activation Induces a Hyporesponsive State in T Helper Cells.
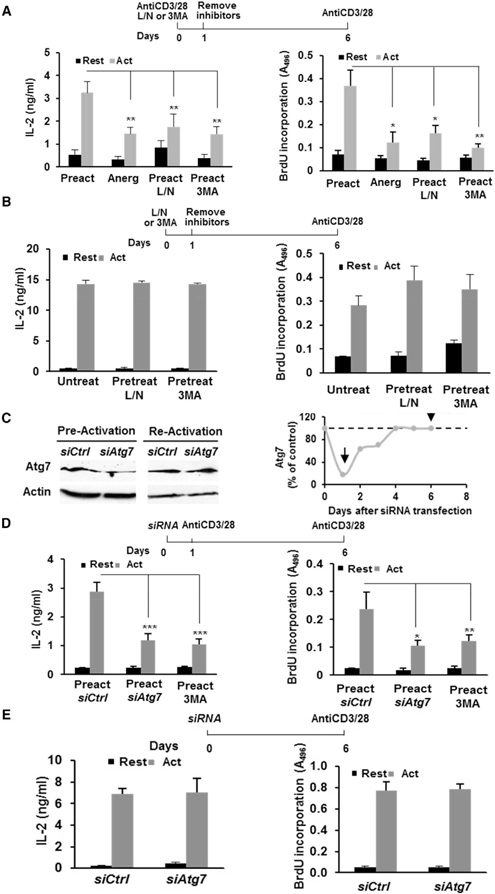
(A) IL-2 production and cell proliferation in Th1 cells pre-activated (Preact) for 24 hr in the presence or absence of L/N or 3MA or anergized (Anerg) with anti-CD3, washed, and re-stimulated after 5 days.
(B)IL-2 production and cell proliferation in Th1 cells cultured in the presence of L/N or 3MA for 24 hr (Pretreat), washed to remove inhibitors, and stimulated.
(C)Immunoblot showing Atg7 levels in Th1 cells transfected with a non-targeting (Ctrl) or an Atg7-specific siRNA, 1 or 6 days after transfection. β-Actin was used as control. Quantification of relative Atg7 levels at different time points after transfection is also shown. Arrows mark times of pre- and re-stimulation.
(D and E) IL-2 production and cell proliferation in Th1 cells transfected with Ctrl or Atg7 siRNAs, pre-activated 1 day after transfection (D) or left untreated (E), and then re-stimulated. T cells pre-activated in the presence of 3MA as in (A) are included as a control.
Data represent mean and SEM from 5 (A), 3 (B), 4 (D), or 3 (E) different experiments. *p < 0.05; **p < 0.01, ANOVA with Tukey post-test for (A)–(D); two-tailed t test for (E). Act, stimulated; Rest, resting. See also Figures S1 and S2.
To determine whether the hyporesponsive state caused by autophagy inhibition could be due to the induction of anergy, we measured the expression of genes that inhibit TCR signaling and cytokine expression in anergic cells (Valdor and Macian, 2013). Inhibition of autophagy during Th1 cell activation resulted in the upregulation of several anergy-associated genes, including Grail, Tle4, Egr2, and Ikzf1 (Figures 2A and2B). These cells, however, did not become Tregs and they did not upregulate expression Foxp3 (Figure 2C) or showed any capacity to suppress activation of T cells (Figure S3). Furthermore, the hypo-responsive state could be reversed by IL-2 receptor signaling (Figures 2D and2E; Figure S2), which bypasses signaling blocks present in anergic T cells, or prevented if exogenous IL-2 was provided during stimulation, even in the presence of autophagy inhibition (Figure S4) (Boussiotis et al., 1997; Dure´ and Macian, 2009). These data support that inhibition of autophagy leads to the establishment of functional hyporesponsiveness associated with expression of anergy-inducing genes that can be reversed by IL-2.
Figure 2. Autophagy Inhibition during Stimulation Induces T Cell Anergy.

(A) Expression of anergy-associated genes (qPCR) in Th1 cells activated in the presence or absence of L/N or 3MA.
(B) Expression of anergy-associated genes (qPCR) in cells transfected with non-targeting (Ctrl) or Atg7-specific siRNAs and activated for 24 hr.
(C) Foxp3 gene expression (qPCR) in Th1 cells activated in the presence or absence of 3MA. mRNA obtained from purified Tregs is included as control.
(D)Th1 cells were anergized with anti-CD3 (Anerg), activated in the absence (Preact) or presence of L/N (Preact-L/N) or 3MA (Preact-3MA) for 24 hr. Cells were washed to remove inhibitors, cultured for 5 days with 50 ng/mL IL-2, and re-stimulated. IL-2 production and cell proliferation were measured.
(E) IL-2 and cell proliferation were measured as in (D) in cells transfected with Ctrl or Atg7 siRNAs 24 hr prior to pre-activation.
(F) Wild-type or NFAT1-deficient Th1 cells were stimulated for 24 hr in the presence or absence of 3MA. Cells were washed and re-stimulated after 5 days to measure IL-2 production and cell proliferation.
Data represent mean + SEM from 3 (A–C), 4 (D and E), or 5 (F) different experiments. *p < 0.05; **p < 0.01; ***p < 0.001, ANOVA with Tukey post-test for (A), (C), (D), and (F); two-tailed t test for (B) and (E). See also Figures S2–S4.
Activation of an anergy-associated program of gene expression is dependent on the transcription factor NFAT1; therefore, T cells that lack NFAT1 are resistant to anergy (Macia´n et al., 2002). Therefore, we determined anergy-resistant NFAT1-deficient cells would also be resistant to anergy mediated by autophagy inhibition. Our data showed that whereas wild-type Th1 cells stimulated in the presence of 3MA became hypo-responsive, NFAT1-deficient cells were not affected by autophagy inhibition (Figure 2F).
Autophagy Is a Tolerance-Avoidance Mechanism in Human CD4+ T Cells
To explore whether human T cells would also require autophagy to avoid anergy, CD4+ T cells isolated from peripheral human blood were activated for 24 hr in the presence or absence 3MA, then washed and left resting for 5 days before assessing their response to re-stimulation. Human T cells that were pre-activated in the presence of 3MA behave as cells anergized by partial stimulation (activated with anti-CD3 without anti-CD28) and became hypo-responsive to re-stimulation (Figure 3A). Supporting the induction of a functional state of anergy in those cells, responses to re-stimulation were rescued by addition of IL-2 (Figure 3B) and they upregulated the expression the anergy-associated genes GRAIL, EGR2, IKZF1, and TLE4 (Figure 3C).
Figure 3. Inhibition of Autophagy during Activation Induces an Anergic State in Human T Cells.
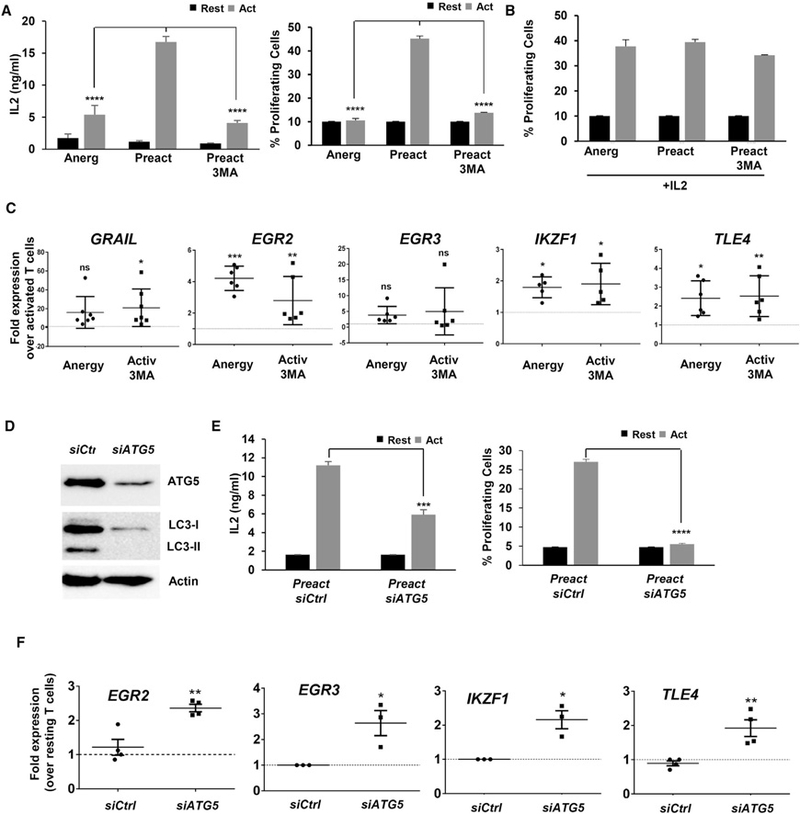
(A) Human CD4+ T cells were stimulated for 24 hr in the presence or absence of 3MA. Cells were washed to remove inhibitors and re-stimulated after 5 days. IL-2 production and cell proliferation were measured after 48 hr and 4 days, respectively. Data show mean + SEM of three experiments. ****p < 0.0001 (ANOVA).
(B) Human CD4+ T cells were activated in the presence or absence 3MA as in (A). After washing, cells were grown for 5 days with 50 ng/mL IL-2 and re-stimulated. Cell proliferation was measured.
(C) Expression of anergy-associated gene (qPCR) in human CD4+ T cells activated in the presence or absence of 3MA for 24 hr. B2M expression was used as normalization control. Values (mean ± SEM) from three experiments are expressed as fold increase relative to control cells activated in the absence of any inhibitor. *p < 0.05; **p < 0.01; ***p < 0.001 (ANOVA). ns, not significant.
(D and E) Human CD4+ T cells activated and transfected with either a non-targeting (Ctrl) or an ATG5-specific siRNA. (D) ATG5 and LC3 detected by immunoblot after activation 24 hr post-siRNA transfection. β-ACTIN was used as control. (E) IL-2 production and cell proliferation in cells re-stimulated 5 days after siRNA transfection. Data are mean + SEM of three experiments. ***p < 0.001; ****p < 0.0001 (two-tailed t test).
(F) Expression of anergy-associated genes (qPCR) in control or ATG5 siRNA-transfected cells activated for 24 hr. B2M expression was used as normalization control. Values (mean ± SEM) of three different experiments are expressed as fold increase relative to control untransfected cells. *p < 0.05; **p < 0.01. Act, stimulated; Rest, resting.
Experiments were then conducted in cells transfected with siRNAs specific for ATG5. As expected, knockdown of ATG5 prevented LC3 lipidation (Figure 3D), and human CD4+ T cells became hypo-responsive to re-stimulation after being activated in the presence of ATG5-silencing siRNAs (Figure 3E). The expression of the anergy-associated genes EGR2, EGR3, IKZF1, and TLE4 was also upregulated (Figure 3F).
n Vivo Inhibition of Autophagy Induces T Cell Tolerance and Decreases Severity of MOG-Induced EAE
To determine whether in vivo inhibition of autophagy would also induce anergy, we used chloroquine to block autophagy. This drug is used to treat autoimmune disorders, although its mechanism of action remains unknown (Ben-Zvi et al., 2012). In vitro inhibition of autophagy with chloroquine during activation also rendered wild-type, but not NFAT1-deficient, T helper cells hypo-responsive to re-stimulation (Figure S4). In vivo, OT-II CD4+ T cells were transferred into congenic mice, which were then immunized by subcutaneous injection with OVA323–339 peptide in complete Freund’s adjuvant (CFA) and treated daily with intraperitoneal injections of PBS or chloroquine for 6 days (Figure 4A). Corroborating our in vitro data, wild-type OT-II T cells isolated from control immunized mice produced, when re-stimulated ex vivo, significantly more IL-2 than cells isolated from mice that were treated with chloroquine (Figure 4B). However, Nfat1−/− OT-II T cells showed similar levels of activation in control mice or mice treated with chloroquine (Figure 4B). Furthermore, whereas chloroquine treatment induced a marked upregulation of the expression of the Grail and Egr2 in wild-type OT-II cells, it failed to do so in NFAT1-deficient cells (Figure 4C).
Figure 4. In Vivo Inhibition of Autophagy Induces CD4+ T Cell Tolerance and Decreases the Severity of MOG-Induced EAE.

(A–C) Wild-type or NFAT1-deficient OT-II (CD90.2+) T cells were transferred into congenic C57BL/6 (CD90.1+) mice (A). 24 hours later, mice were challenged with subcutaneous OVA323–339 in CFA. For each group, half of the mice were randomly treated with chloroquine and half with PBS for 6 days. IL-2 production (B) and Grail and Egr2 expression (C) were determined in purified OT-II T cells from the draining lymph nodes and stimulated ex vivo with T cell-depleted splenocytes loaded with OVA323–339.
(D) Atg7 content and autophagy flux (LC3-II turnover) measured by immunoblot in resting and activated CD4+ T cells isolated from Atg7−/− or wild-type mice.
(E) EAE scores of Atg7−/− or wild-type littermate mice immunized with MOG35–55 peptide.
(F) Histological analyses of lumbar spinal cord sections from EAE Atg7−/− or wild-type mice.
(G) EAE was induced in C57BL/6 mice that were divided in two groups that received daily injections of PBS or chloroquine in PBS (Chloro). EAE scores were recorded daily.
(H) Histological analyses of lumbar spinal cord sections from untreated and chloroquine-treated EAE mice.
(I and J) Experiments were performed as in (G) and (H) but using NFAT1-deficent mice.
Data represent mean + SEM from four different experiments (B and C). *p < 0.05; **p < 0.01; ns, not significant (ANOVA with Tukey post-test in B and two-tailed t test in C). For (E)–(G), data represent mean and SEM from 8 (E), 10 (G), or 4 (I) different mice from 2 independent experiments. *p < 0.05; **p < 0.01; ***p < 0.001 (Mann-Whitney test). See also Figure S4.
We then used the EAE mouse model to test whether autophagy inhibitors could prevent or delay autoimmunity. First, we analyzed the response to immunization with MOG33–55 peptide of mice unable to induce autophagy in T cells. These mice (Cd4-Cre:Atg7flf; termed Agt7−/− from here on) did not express Atg7 in T cells and, therefore, could not lipidate LC3-lI (Figure 4D). When compared with wild-type littermates, Atg7−/− mice showed increased resistance to MOG-induced EAE. Most Agt7−/− mice did not develop any clinical manifestation, and histopathological analysis of the spinal cord revealed much lower T cell infiltration, microglia activation, or demyelination than wild-type littermates (Figures 4E and4F). To avoid any bias on T cell maturation that might have been caused by the absence of Atg7, and at the same time test the possibility of inhibiting autophagy with drugs, we determined the consequences of blocking autophagy using chloroquine in EAE mice. When treated daily with chloroquine, MOG-immunized mice showed markedly reduced EAE scores compared with mock-treated (PBS) immunized mice, which correlated with decreased levels of infiltration in the spinal cord, reduced presence of CD3+ T cells and Iba+ activated microglia, and decreased levels of spinal cord demyelination (Figures 4G and4H). Similar experiments performed in NFAT1-deficient anergy-resistant mice resulted, however, in no significant differences between mock- and chloroquine-treated MOG-immunized mice (Figures 4I and4J).
Blockade of Autophagy Inhibits Mitochondrial Respiration and Reduces Glycolysis in Activated T Cells
We have previously shown that activation of autophagy is necessary to sustain ATP production following activation (Hubbard et al., 2010). To better characterize the consequences of failure to induce autophagy for T cell metabolism, we analyzed the changes in oxygen consumption rate (OCR) and extracellular acidification rate (ECAR) (as indicators of mitochondrial respiration and aerobic glycolysis, respectively) that occurred in activated T cells when autophagy was inhibited. Inhibiting autophagy dramatically reduced OCR and ECAR in activated T cells (Figures 5A and5B). Interestingly, restoration of T cell responses by IL-2 in cells pre-activated in the presence of autophagy inhibitors also restored the ability of those cells to upregulate OCR in response to TCR engagement (Figure S5). We then analyzed the consequences of activating T cells while at the same time inhibiting either mitochondrial ATP production (using oligomycin) or glycolysis (using 2-deoxy-D-glucose [2DG]). Cells pre-activated in the presence of oligomycin, but not 2DG, also became hypo-responsive to re-stimulation (Figures 5C and5D). These effects were only evident when oligomycin was added during the initial stimulation, but no effect was detected when basal oxidative phosphorylation was temporarily inhibited (Figures 5E and5F). These data support that the contribution of autophagy to sustain adequate levels of mitochondrial ATP production is required to prevent anergy. Indeed, adding exogenous ATP when activating cells in the presence of autophagy inhibitors partially restored the ability of those cells to produce IL-2 following re-stimulation (Figure S5). However, addition of ATP could only partially prevent the induction of T cell hypo-responsiveness. This might respond to the requirement of a specific dynamic regulation of mitochondrial ATP production, or alternatively, to the existence of additional mechanisms controlled by autophagy. This would make sustaining mitochondrial ATP levels required but not sufficient to avoid anergy.
Figure 5. Inhibition of Autophagy during T Cell Activation Results in Decreased Metabolic Output.

(A and B) OCR (A) and ECAR (B) measured in activated Th1 cells in the absence or presence of 3MA or L/N.
(C and D) IL-2 production (C) and cell proliferation (D) of Th1 cells pre-activated in the presence or absence of oligomycin (Oligo) or 2-deoxyglucose (2DG) for 24 hr, washed, and re-stimulated 5 days later.
(E and F) IL-2 production (E) and cell proliferation (F) of Th1 cells left untreated or treated with oligomycin for 24 hr, washed, and stimulated 5 days later.
Data represent mean + SEM from four (A and B) or three (C–F) different experiments. *p < 0.05; **p < 0.01 (ANOVA with Tukey post-test). See also Figure S5.
Autophagy Modulates TCR Signaling by Regulating the Degradation of the Protein Tyrosine Phosphatase Non-receptor Type 1
Analysis of signaling downstream of the TCR revealed that inhibition of autophagy in activated Th1 cells allowed for NFAT1 dephosphorylation but had a profound effect on c-Jun and Erk phosphorylation. IκB phosphorylation was unaffected, whereas mammalian target of rapamycin (mTOR) activation was slightly reduced in cells treated with L/N or 3MA (Figure 6A). Selective autophagy has been reported to regulate T cell activation through modulation of specific regulatory proteins (Jia et al., 2015; Paul et al., 2012). To determine whether altered signaling induced by inhibition of autophagy could also be caused by changes in the degradation rates of signaling regulators, we analyzed the autophagy-degraded proteome in activated T cells. Quantitative proteomic analysis of the content of autophagosomes isolated from resting and activated T helper cells identified 50 proteins that were enriched in autophagosomes isolated from activated T cells, compared with resting cells (Figure 6B; Figure S6). Data mining identified a subset of those proteins that could be involved in the regulation of T cell activation (Figure 6B; Table S1). Of those proteins, we focused our attention on the protein tyrosine phosphatase PTPN1. The expression of several protein tyrosine phosphatases (PTPs) is upregulated in anergic T cells (Macia´ n et al.,2002). Furthermore, PTPN1 has been reported to regulate B cell tolerance (Medgyesi et al., 2014), while the closely related PTPN2 phosphatase has been shown to control TCR signaling thresholds (Wiede et al., 2011). Analysis of the kinetics of PTPN1 levels in T helper cells showed a sharp increase following activation that was gradually reduced back to resting levels after 24 hr (Figure 6C). Supporting the involvement of autophagy in PTPN1 turnover, 3MA or L/N prevented or diminished PTPN1 degradation in activated mouse and human CD4+ T cells (Figures 6C and6D). Furthermore, CD4+ T cells isolated from Atg7−/− mice showed increased accumulation of PTPN1 compared with cells from wild-type littermates (Figure 6E). TCR signaling appeared, however, to be required to induce degradation of PTPN1, because IL-2 alone, while able to activate autophagy, failed to induce PTPN1 degradation (Figure S7). This may respond to the requirement of modifications in PTPN1 that either allowed this protein to be recognized by autophagy receptor or may expose LC3-interacting motifs. Alternatively, TCR engagement may induce the expression of specific autophagy receptors or adaptors required to target PTPN1 to the autophagosome. To assess whether the accumulation of PTPN1 caused by autophagy blockade could have a functional role, we determined whether increasing PTPN1 cell content through overexpression would also induce the expression of the anergy-associated genes and make cells hypo-responsive to stimulation. Indeed, human CD4+ T cells transfected with a plasmid directing the expression of human PTPN1 showed a clear increase in the expression of EGR2, EGR3, TLE4, and GRAIL, and a significant inhibition on activation-induced IL-2 production (Figures 6F and 6G).
Figure 6. Autophagy Regulates PTPN1 Turnover in T Helper Cells.
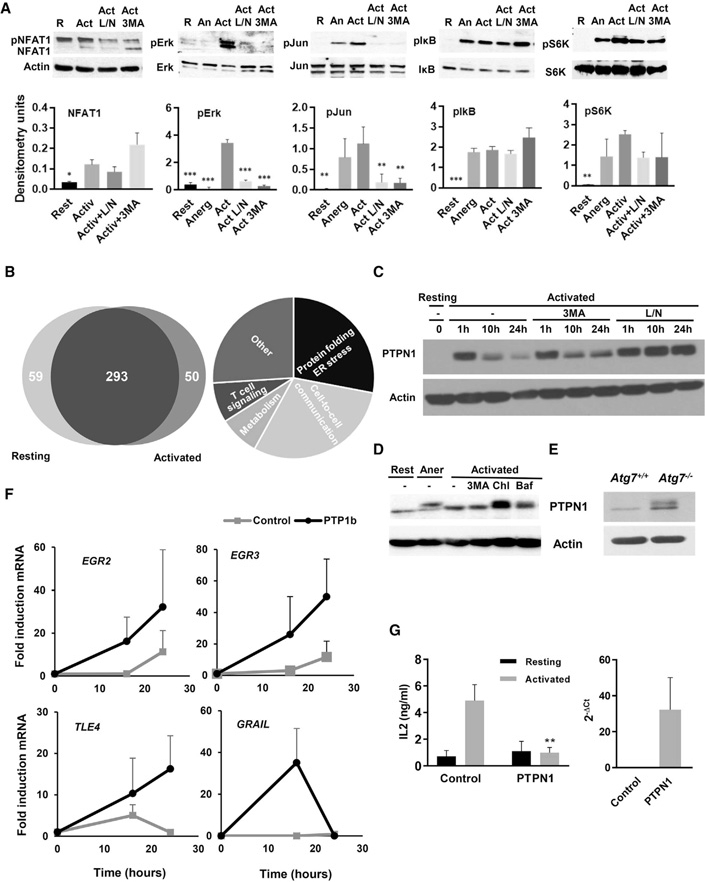
(A) Immunoblots using total cell lysates prepared from resting T cells (R), and cells anergized by stimulation with anti-CD3 (An) or activated for 8–12 hr in the absence (Act) or presence of either leupeptin and L/N or 3MA. Graph bars show mean + SD of quantifications of immunoblots from three different experiments. ANOVA with Tukey post hoc test: *p < 0.05; **p < 0.01; ***p < 0.001, relative to activated cells.
(B) Analysis of the proteome of autophagosomes isolated from resting or activated Th1 cells, showing functional groups representing those proteins enriched in autophagosomes in activated T cells.
(C) Immunoblot of PTPN1 on total cell lysates from resting Th1 cells or cells activated at different time points in the presence or absence of 3MA or L/N.
(D) Immunoblot of PTPN1 on total cell lysates from human resting CD4+ T cells or cells activated in the presence or absence of 3MA, chloroquine (Chl), or bafilomycin (Baf).
(E) Immunoblot of PTPN1 on lysates from CD4+ T cells isolated from Atg7+/+ or Atg7−/− mice.
(F) Expression of EGR2, EGR3, TLE4, and GRAIL (qPCR) at different time points following activation with anti-CD3 and anti-CD28 in human CD4+ T cells transfected with a control plasmid or a plasmid expressing human PTPN1. Data show mean ± SEM from three independent experiments.
(G) IL-2 and PTPN1 expression in human CD4+ T cells transfected with a control plasmid or a plasmid expressing human PTPN1 and stimulated 24 hr later with plate-bound anti-CD3 and anti-CD28 for 24 hr. Data represent mean + SEM from three different experiments (t test; **p < 0.01, comparing activated samples). See also Figure S6.
T Cells from Juvenile Idiopathic Arthritis Patients Are Resistant to Canonical Anergy Induction but Become Hypo-responsive by Autophagy Inhibition
To explore whether targeting autophagy could result in induction of tolerance in autoimmune T helper cells, we analyzed the responses of CD4+ T cells isolated from the synovial fluid of JIA patients. While T cells from JIA patients failed to become anergic following partial stimulation (Figures 7A–7C), activation of those cells in the presence of 3MA led to the induction of a hypo-responsive state, with increased expression of GRAIL, EGR2, EGR3, and TLE4 (Figures 7B and7C). Interestingly, some of those patients’ T cells showed decreased levels of PTPN1, which might be due to dysregulated autophagy (Figure S7). These results indicate that inhibition of autophagy may be able to induce tolerance in T cells from autoimmune patients who may otherwise be refractory to tolerance induction through co-stimulation blockade.
Figure 7. Autophagy Inhibitors Induce Anergy in T Cells from JIA Patients Resistant to Canonical Anergy Induction.
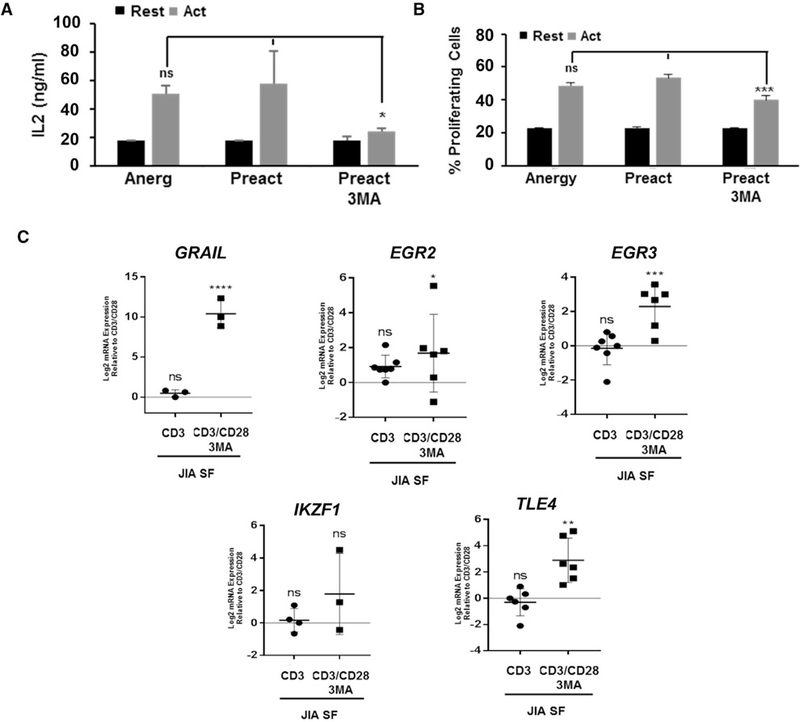
(A and B) IL-2 production (A) and cell proliferation (B) measured in synovial fluid (SF) CD4+ T cells obtained from JIA patients pre-stimulated with plate-bound anti-CD3 and anti-CD28 antibodies for 24 hr (Preact) in the presence or absence of 3MA, washed to remove the inhibitors, and re-stimulated 5 days later. Data show mean ± SEM from three independent experiments. *p < 0.05; ***p < 0.001 (ANOVA). ns, not significant.
(C) Anergy-associated gene expression (qPCR) in SF JIA CD4+ T cells activated with anti-CD3 or with anti-CD3 and anti-CD28 in the presence or absence of 3MA. B2M expression was used as normalization control. Values (mean ± SEM) are expressed as fold increase relative to control activated cells. *p < 0.05; **p < 0.01; ***p < 0.001; ****p < 0.0001 (ANOVA). See also Figure S7.
DISCUSSION
The fate of CD4+ T helper cells is determined by the different signals received when they encounter antigen. In addition to TCR recognition of cognate antigen on major histocompatibility complex class II (MHC class II) complexes, CD4+ T cells integrate a myriad of different cues, including signaling through costimulatory and coinhibitory receptors, other cell populations that may interact and modulate their activity, cytokines, or the availability of nutrients. All those signals modulate the induction of different programs of activation, differentiation, or survival (Pollizzi and Powell, 2014; Wells, 2009). Here, we show that induction of autophagy following activation of T helper cells contributes to determining their fate. Whereas cells that induce autophagy become primed to respond to re-stimulation, cells where activation-induced autophagy is inhibited are rendered anergic to re-stimulation.
Engagement of CD28 and the IL-2 receptor have been shown to act as tolerance-avoidance mechanisms (Jenkins et al., 1990; Wells, 2009). In the absence of CD28 engagement, T helper cells induce an NFAT-dependent program of gene expression that makes them hyporesponsive to new encounters with antigen (Macia´ n et al., 2002; Valdor and Macian, 2013). Signaling though the IL-2 receptor also contributes to the differential induction of programs of gene expression and activates mTOR to regulate the metabolic switch required for CD4+ T cells to adjust to the demands of activation (Zheng et al., 2007). Our data support that autophagy is also as a central mechanism of tolerance avoidance, because inhibition of autophagy, even when T cells are activated in the presence of costimulation, results in the induction of anergy, which is prevented by IL-2 receptor signaling (Botbol et al., 2015)
Changes in T cell metabolism follow T cell activation to fulfill increased metabolic needs. Upregulation of ATP and NADPH production is mostly achieved through enhanced glucose uptake, which is rapidly metabolized, with most of its carbons eliminated as secreted lactate (MacIver et al., 2013; Pearceet al., 2013). Although this pathway is essential to ensure that the metabolic requirements of T cells are met, mitochondrial oxidation of other substrates, including but not limited to glutamine, is also required in activated T cells, contributing to the generation of signaling molecules in key pathways downstream of the TCR (Carr et al., 2010; Sena et al., 2013). Consequently, activated T cells not only show increased glycolytic activity, but also oxidative phosphorylation (Chang et al., 2013; Kolev et al., 2015; Sena et al., 2013). We have reported that ATP production in effector Th1 cells is markedly reduced in T cells deficient in autophagy (Hubbard et al., 2010). Our data show that inhibition of autophagy results in decreased oxygen consumption in activated Th1 cells, suggesting that failure to induce autophagy prevents the adequate maintenance of mitochondrial oxidative phosphorylation. Given the role of autophagy as a starvation response that provides substrates to fuel mitochondrial respiration (Mizushima et al., 2011), it is tempting to speculate that a similar role might be exerted in T cells. The effects of autophagy blockade on T cell fate could be replicated by oligomycin, but not by 2D, which indicates that inhibition of mitochondrial ATP production may underlie the induction of a hyporesponsive state in response to autophagy inhibition. Indeed, export of mitochondrial ATP through pannexin-1 hemichannels controls mitogen-activated protein kinase (MAPK) signaling in activated T cells, through engagement of purinergic receptors. Consequently, inhibition of those receptors leads to the induction of T cell anergy (_Schenk et al., 2008). Recently, it has been shown that autophagy may also regulate mTOR activity in T cells (Whang et al., 2017). We also observed a small decrease in the phosphorylation of the mTOR substrate p70S6K when autophagy was inhibited. This would suggest that the involvement of autophagy in the regulation of T cell metabolism may extend to control different metabolic pathways. Recent reports have highlighted the importance of autophagy for the generation of CD8+ T cell memory, which also appears to respond to the regulation of memory cell metabolism, highly reliant on oxidative phosphorylation (Puleston et al., 2014; Xu et al., 2014).
Our data also support that specific signaling pathways are regulated by autophagy to determine the activation-versus-tolerance decision. Inhibition of autophagy, while allowing for NFAT dephosphorylation, hinders activation of Jun and Erk, a situation that mimics the consequences of partial stimulation that induces anergy in CD4+ T cells (Macia´n et al., 2002). Basal levels of homeostatic autophagy in T cells have been shown to contribute to sustaining organelle homeostasis (McLeod et al., 2012); however, activation-induced autophagy results in preferential degradation of cytosolic components (Hubbard et al., 2010). Consequently, while inhibition of basal autophagy causes accumulation of defective mitochondria and increased production of ROS (Pua et al., 2009), we did not detect any differences in activation-induced production of ROS when autophagy was transiently inhibited in T cells. Autophagy can also be selective and, through autophagy receptors, target specific cargo (Farre´ and Subramani, 2016). Indeed, selective autophagy-mediated degradation of Bcl10 and p27kip has been reported in T cells (Jia et al., 2015; Paul et al., 2012). We have found that PTPN1 is degraded by autophagy in activated T cells and, consequently, accumulates when autophagy is inhibited. Expression of several PTPs is induced in anergic T cells, and they play important roles in the regulation of signaling pathways that prevent the induction of anergy (Davidson et al., 2010; Müller and Rao, 2010). Autophagy thus regulates different events in T cells, including, although possibly not limited to, mitochondrial ATP generation, PTPN1 turnover, or mTOR activity (Whang et al., 2017), that would need to be induced following TCR engagement to ensure activation and prevent tolerance.
Chloroquine has been used as treatment of several autoimmune conditions (Olsen et al., 2013), although its mechanism of action is still poorly understood. Using a model of EAE, we show that chloroquine can decrease the severity of autoimmunity by targeting autophagy in T cells, resulting in levels of protection from EAE similar to those we observe in mice bearing Atg7-deficient T cells. Other studies have also reported protective effects of chloroquine on EAE and have identified other mechanisms, including inhibition of autophagy in dendritic cells and increased Treg differentiation (Thome´ et al., 2013, 2014). Furthermore, Atg5 deletion in dendritic cells prevents presentation of phagocytosed oligodendrocyte proteins and protects against EAE (Keller et al., 2017). It is therefore likely that the role of autophagy in autoimmunity extends beyond the intrinsic regulation of T cell tolerance to include other mechanisms such as T cell differentiation and antigen presentation.
Increased autophagy has been shown in lymphocytes isolated from patients with autoimmune disease, including multiple sclerosis, rheumatoid arthritis, and systemic lupus (Clarke et al., 2015; Gros et al., 2012; van Loosdregt et al., 2016). Dysregulated autophagy might make T cells resistant to tolerance and contribute to the progression of disease. T cells from JIA patients are less susceptible to Treg-mediated suppression (Wehrens et al., 2011), and we found they were also resistant to anergy induction in vitro. However, those cells became anergic when autophagy was inhibited. Interestingly, some patients’ T cells showed decreased levels of PTPN1, possibly a result of increased degradation. However, this did not occur in all patients, which might indicate that dysregulated autophagy may alter T cell function through different mechanisms in different patients.
Together, our data identify autophagy as an important regulator of T cell fate, acting as a tolerance-avoidance mechanism in T helper cells, and support that inhibition of autophagy may overcome the reduced susceptibility of autoimmune T cells to mechanisms of peripheral tolerance. Targeting autophagy may thus represent an effective approach to restore tolerance in autoimmune T cells.
EXPERIMENTAL PROCEDURES
Mice
C57BL/6 mice were purchased from The Jackson Laboratory (Bar Harbor, ME) and were maintained in pathogen-free conditions. Nfat1−/− OT-II mice were generated by crossing B6.Nfat1−/− (Xanthoudakis et al., 1996) with OT-II mice (The Jackson Laboratory). Atg7f/f mice (Komatsu et al., 2005) were crossed with CD4-Cre mice (The Jackson Laboratory) to generate mice that lack Atg7 in the T cell compartment. Experiments were performed using male and female mice 6–10 weeks of age. All animal work was approved and performed according to the guidelines set by the Albert Einstein College of Medicine Institutional Animal Care and Use Committee.
Patient Material
Peripheral blood was obtained from healthy donors under the Minidonor Din Program (University Medical Center Utrecht [UMC] Hospital), and the synovial fluid from oligoarticular JIA patients (n = 7) who had active disease at the time sampling was collected by therapeutic joint aspiration. Synovial fluid mononu- clear cells (SFMCs) and peripheral blood mononuclear cells (PBMCs) were isolated using Ficoll Isopaque density gradient centrifugation. Informed consent was given by patients and/or their parents/caregivers under a study approved by the Ethical Regulation Board of the UMC Hospital.
Cell Culture
Primary CD4+ T cells were isolated from lymph nodes and spleens of mice using anti-CD4-coupled magnetic beads (Life Technologies), and CD4+ T cells were isolated from synovial fluid and PBMCs using MagniSort Human CD4 T cell Enrichment Kit (8804–6811-74; eBioscience). Mouse CD4+ T cells were activated and differentiated to Th1 for 5 days with 10 ng/mL IL-12 (Cell Sciences), 10 mg/mL anti-IL-4, and 10 U/mL recombinant human IL-2 (eBioscience). Human CD4 cells were activated and expanded for 5 days. Mouse CD4+ cells were cultured in DMEM supplemented with 10% FBS, 2 mM L-glutamine, 50 μM β-mercaptoethanol, essential vitamins (Cambrex), 550 nM L-Arg, 240 nM L-Asn, and 14 nM folic acid, and human CD4+ cells were cultured in RPMI supplemented with 10% FBS, 2 mM L-glutamine, and 50 μM β-mercaptoethanol. Where indicated, mouse and human T cells were activated with 0.5 μg/mL plate-bound anti-CD3 and 0.5 μg/mL anti-CD28 for 24 hr, or anergized with 2.5 μg/mL plate-bound anti-CD3. Where indicated, cells were treated with 2.5 mM 3MA or 20 mM ammonium chloride and 100 μM leupeptin or 30 μM chloroquine (Sigma-Aldrich) for 24 hr.
ELISA
T cells (2.5–5 × 10⁴) were stimulated with anti-CD3 and anti-CD28 or using T cell-depleted splenocytes loaded with 10 μM OVA323–339 peptide for 24–48 hr. Supernatants were collected, and IL-2 levels were measured in a sandwich ELISA using purified anti-IL-2 and biotinylated anti-IL-2 antibodies.
Proliferation Assays
Mouse T cells (5 × 10⁴) were stimulated for 48 hr before bromodeoxyuridine (BrdU) was added for 12 additional hours. Incorporation of BrdU was measured using a BrdU labeling detection kit according to the manufacturer’s instructions (Roche). Human T cells (5 × 10⁴) were preincubated with Cell Trace Violet (Thermo Fisher) and stimulated for 48 hr. Proliferation was analyzed by fluorescence-activated cell sorting (FACS) using an LSRII (Becton Dickinson) and data processed with FlowJo software (Tree Star).
Detection of Apoptosis
Apoptosis was determined with an Annexin V-PE apoptosis detection kit (BD Biosciences). Stained cells were acquired by FACS and data analyzed with FlowJo software.
Immunoblotting
Total cellular lysates were prepared using radioimmunoprecipitation assay (RIPA) buffer (1% Triton X-100, 1% sodium deoxycholate, 0.1% SDS, 0.15 M NaCl, 0.01 M sodium phosphate [pH 7.2]). A list of primary antibodies is shown in Table S2. Immunoblotting for actin was used as a loading control.
Real-Time PCR
RNA was isolated from cells using RNeasy Mini Kit (QIAGEN), and cDNA was synthesized using Superscript-III First-Strand Synthesis System (Life Technologies). Real-time PCR was performed with PowerSYBR (Applied Biosystems) using a StepOnePlus Real-Time-PCR system (Applied Biosystems). Expression of each gene was normalized to actin. A list of primers used is shown in Table S3.
Silencing of Atg7 and Atg5
CD4+ T cells were electroporated with a Nucleofector electroporator (Amaxa) following the manufacturer’s recommendations with 20 μg siRNAs (Table S4) and with Human SMARTpool: ON-TARGETplus ATG5 siRNA (Damacio, L-004374–00-0005). Atg7 and Atg5 expression were assessed by immunoblot.
Adoptive Transfer of T Cells
Nfat1−/− or Nfat1+/+ OT-II naive CD4+ T cells were adoptively transferred (5 × 10⁶ cells/mouse) into C57BL/6 mice. Mice were then immunized with subcutaneous injections of OVA323–339 (100 μg) in CFA (Sigma-Aldrich). Mice also received intraperitoneal injections of PBS or 50 mg/kg chloroquine dissolved in PBS (100 μL/mice) for 6 consecutive days.
Metabolic Assays
OCRs and ECARs were measured in T cells activated for 12, 24, and 48 hr using XF media (non-buffered RPMI 1640 containing 10 mM glucose, 2 mM L-glutamine, and 1 mM sodium pyruvate) under basal conditions and in response to glucose 30 mM, on XF-96 Extracellular Flux Analyzers (Seahorse Bioscience).
EAE Induction, Evaluation, and Chloroquine Treatment
Mice were injected with 100 mL MOG35–55 (Rhea-Biotec) mixed with CFA. 500 ng pertussis toxin (Sigma-Aldrich) was administrated intraperitoneally 0 and 48 hr after MOG35–55 inoculation. Clinical signs were followed and graded daily according to the following score scale: 0, no sign; 1, flaccid tail; 2, hindlimb weakness; 3, hindlimb paralysis; 4, hindlimb paralysis and forelimb weakness; 5, full paralysis/dead. 50 mg/kg/day chloroquine or an equal volume of PBS was administered intraperitoneally.
Spinal Cord Dissection, Tissue Preparation, and Immunohistochemistry
Mice were sacrificed and perfused with 4% paraformaldehyde. Spinal cords were dissected and placed in fixative overnight at 4° C, then paraffin-embedded and sectioned. 4-μm sections were incubated with xylenes and descending alcohols, brought to Tris-buffered saline (TBS; pH 7.4; 1× TBS). Antigen retrieval was achieved by boiling the slides for 14 min in H2O in a microwave. All sections were incubated for 30 min with TBS containing 0.25% Triton X-100 and 3% H2O2, followed by a 1-hr block in TBS 5% goat serum and 5% nonfat milk, and incubated with antibodies diluted in TBS 5% nonfat milk overnight at 4° C. Sections were washed, incubated with secondary antibody, followed by incubation with the appropriate Vecta staining kit (Vector Laboratories, Burlingame, CA), and visualized by diaminobenzidine (DAB; Sigma).
Autophagosome Subfractionation and Quantitative Proteomics Analysis
108 resting or activated (24 hr) Th1 cells were incubated with vinblastine (100 μM) 1.5 hr before autophagosome isolation to block autophagosome-lysosome fusion. Cells were washed twice in PBS and once in 0.25 M sucrose, and resuspended in 0.25 M sucrose. Cells were broken using nitrogen cavitation (35 psi for 8 min), homogenized using a Teflon homogenizer, and spun at 2,000 × g for 5 min. Supernatants were collected and spun at 17,000 × g for 12 min. Pellets were washed and resuspended in 0.25 M sucrose 50% metrizamide (Cedarlane Labs). Solution was then loaded at the bottom of a discontinuous metrizamide gradient (50%, 26%, 24%, 20%, and 15%), which was run for 3 hr at 100,000 × g. 15%–20% interface fractions containing light autophagic vacuoles were collected in a pool of more than three independent experiments for proteomic analysis. Quantitative proteomics was performed using iTRAQ multiplex (Applied Biomics) in pooled autophagosomes fractions isolated from nine different mice. Proteins where the ratio content in autophagosomes between activated and resting cells was larger than 2 were identified as proteins that may be preferentially degraded in activated T cells.
Statistical Analysis
Results were analyzed using two-tailed Student’s t test to compare differences between two groups and one-way ANOVA with a Tukey post hoc test to determine differences in experiments where multiple groups were compared. Non-parametric data were analyzed using a Mann-Whitney test. Differences between groups with a p value <0.05 were considered statistically significant. All analyses were performed using GraphPad Prism Software.
Supplementary Material
Highlights.
Activation of autophagy is a tolerance-avoidance mechanism in CD4+ T cells
Autophagy regulates mitochondrial respiration and PTPN1 turnover in activated T cells
Autophagy inhibition following activation induces anergy in human and mouse CD4+ T cells
In vivo inhibition of autophagy prevents autoimmune responses in mice
ACKNOWLEDGMENTS
This work was supported by the NIH (grants AG031782, AI059738, and AI113919 to F.M. and grant GM007288 to S.D.D.), the Dutch Rheumatology Foundation (grant 16–01-301 to E.M.), the Irma T Hirschl Trust Fund, and the Glenn Foundation for Biomedical Research (to F.M.). This study was also supported by research cores funded by the Albert Einstein Institute for Aging Research (AG038072) and Cancer Center (CA013330) NIH Support Grants.
Footnotes
DECLARATION OF INTERESTS
The authors declare no competing interests.
REFERENCES
- Ben-Zvi I, Kivity S, Langevitz P, and Shoenfeld Y (2012). Hydroxychloroquine: from malaria to autoimmunity. Clin. Rev. Allergy Immunol 42, 145–153. [DOI] [PMC free article] [PubMed] [Google Scholar]
- Botbol Y, Patel B, and Macian F (2015). Common γ-chain cytokine signaling is required for macroautophagy induction during CD4+ T-cell activation. Autophagy 11, 1864–1877. [DOI] [PMC free article] [PubMed] [Google Scholar]
- Boussiotis VA, Freeman GJ, Berezovskaya A, Barber DL, and Nadler LM (1997). Maintenance of human T cell anergy: blocking of IL-2 gene transcription by activated Rap1. Science 278, 124–128. [DOI] [PubMed] [Google Scholar]
- Carr EL, Kelman A, Wu GS, Gopaul R, Senkevitch E, Aghvanyan A, Turay AM, and Frauwirth KA (2010). Glutamine uptake and metabolism are coordinately regulated by ERK/MAPK during T lymphocyte activation. J. Immunol 185, 1037–1044. [DOI] [PMC free article] [PubMed] [Google Scholar]
- Chang CH, Curtis JD, Maggi LB Jr., Faubert B, Villarino AV, O’Sullivan D, Huang SC, van der Windt GJ, Blagih J, Qiu J, et al. (2013). Post-transcriptional control of T cell effector function by aerobic glycolysis. Cell 153, 1239–1251. [DOI] [PMC free article] [PubMed] [Google Scholar]
- Chappert P, and Schwartz RH (2010). Induction of T cell anergy: integration of environmental cues and infectious tolerance. Curr. Opin. Immunol 22, 552–559. [DOI] [PMC free article] [PubMed] [Google Scholar]
- Clarke AJ, Ellinghaus U, Cortini A, Stranks A, Simon AK, Botto M, and Vyse TJ (2015). Autophagy is activated in systemic lupus erythematosus and required for plasmablast development. Ann. Rheum. Dis 74, 912–920. [DOI] [PMC free article] [PubMed] [Google Scholar]
- Davidson D, Shi X, Zhong MC, Rhee I, and Veillette A (2010). The phosphatase PTP-PEST promotes secondary T cell responses by dephosphorylating the protein tyrosine kinase Pyk2. Immunity 33, 167–180. [DOI] [PubMed] [Google Scholar]
- Dure´ M, and Macian F (2009). IL-2 signaling prevents T cell anergy by inhibiting the expression of anergy-inducing genes. Mol. Immunol 46, 999–1006. [DOI] [PMC free article] [PubMed] [Google Scholar]
- Farre´ JC, and Subramani S (2016). Mechanistic insights into selective autophagy pathways: lessons from yeast. Nat. Rev. Mol. Cell Biol 17, 537–552. [DOI] [PMC free article] [PubMed] [Google Scholar]
- Gros F, Arnold J, Page N, De´cossas M, Korganow ,AS, Martin T, and Muller S (2012). Macroautophagy is deregulated in murine and human lupus T lymphocytes. Autophagy 8, 1113–1123. [DOI] [PMC free article] [PubMed] [Google Scholar]
- Hubbard VM, Valdor R, Patel B, Singh R, Cuervo AM, and Macian F (2010). Macroautophagy regulates energy metabolism during effector T cell activation. J. Immunol 185, 7349–7357. [DOI] [PMC free article] [PubMed] [Google Scholar]
- Jenkins MK, Chen CA, Jung G, Mueller DL, and Schwartz RH (1990). Inhibition of antigen-specific proliferation of type 1 murine T cell clones after stimulation with immobilized anti-CD3 monoclonal antibody. J. Immunol 144, 16–22. [PubMed] [Google Scholar]
- Jia W, He MX, McLeod IX, Guo J, Ji D, and He YW (2015). Autophagy regulates T lymphocyte proliferation through selective degradation of the cell-cycle inhibitor CDKN1B/p27Kip1. Autophagy 11, 2335–2345. [DOI] [PMC free article] [PubMed] [Google Scholar]
- Kalekar LA, Schmiel SE, Nandiwada SL, Lam WY, Barsness LO, Zhang N, Stritesky GL, Malhotra D, Pauken KE, Linehan JL, et al. (2016). CD4(+) T cell anergy prevents autoimmunity and generates regulatory T cell precursors. Nat. Immunol 17, 304–314. [DOI] [PMC free article] [PubMed] [Google Scholar]
- Keller CW, Sina C, Kotur MB, Ramelli G, Mundt S, Quast I, Ligeon LA, Weber P, Becher B, Münz C and Lünemann JD (2017). ATG-dependent phagocytosis in dendritic cells drives myelin-specific CD4+ T cell pathogenicity during CNS inflammation. Proc. Natl. Acad. Sci. USA 114, E11228–E11237. [DOI] [PMC free article] [PubMed] [Google Scholar]
- Kolev M, Dimeloe S, Le Friec G, Navarini A, Arbore G, Povoleri GA, Fischer M, Belle R, Loeliger J, Develioglu L, et al. (2015). Complement regulates nutrient influx and metabolic reprogramming during Th1 cell responses. Immunity 42, 1033–1047. [DOI] [PMC free article] [PubMed] [Google Scholar]
- Komatsu M, Waguri S, Ueno T, Iwata J, Murata S, Tanida I, Ezaki J, Mizushima N, Ohsumi Y, Uchiyama Y, et al. (2005). Impairment of starvation-induced and constitutive autophagy in Atg7-deficient mice. J. Cell Biol 169, 425–434. [DOI] [PMC free article] [PubMed] [Google Scholar]
- Liang XH, Jackson S, Seaman M, Brown K, Kempkes B, Hibshoosh H, and Levine B (1999). Induction of autophagy and inhibition of tumorigenesis by beclin 1. Nature 402, 672–676. [DOI] [PubMed] [Google Scholar]
- Macia´n F, Garcı´a-Co´ zar F, Im SH, Horton HF, Byrne MC, and Rao A (2002). Transcriptional mechanisms underlying lymphocyte tolerance. Cell 109, 719–731. [DOI] [PubMed] [Google Scholar]
- MacIver NJ, Michalek RD, and Rathmell JC (2013). Metabolic regulation of T lymphocytes. Annu. Rev. Immunol 31, 259–283. [DOI] [PMC free article] [PubMed] [Google Scholar]
- McLeod IX, Jia W, and He YW (2012). The contribution of autophagy to lymphocyte survival and homeostasis. Immunol. Rev 249, 195–204. [DOI] [PMC free article] [PubMed] [Google Scholar]
- Medgyesi D, Hobeika E, Biesen R, Kollert F, Taddeo A, Voll RE, Hiepe F, and Reth M (2014). The protein tyrosine phosphatase PTP1B is a negative regulator of CD40 and BAFF-R signaling and controls B cell autoimmunity. J. Exp. Med 211, 427–440. [DOI] [PMC free article] [PubMed] [Google Scholar]
- Mizushima N (2009). Physiological functions of autophagy. Curr. Top. Microbiol. Immunol 335, 71–84. [DOI] [PubMed] [Google Scholar]
- Mizushima N, Noda T, Yoshimori T, Tanaka Y, Ishii T, George MD, Klionsky DJ, Ohsumi M, and Ohsumi Y (1998). A protein conjugation system essential for autophagy. Nature 395, 395–398. [DOI] [PubMed] [Google Scholar]
- Mizushima N, Yoshimori T, and Ohsumi Y (2011). The role of Atg proteins in autophagosome formation. Annu. Rev. Cell Dev. Biol 27, 107–132. [DOI] [PubMed] [Google Scholar]
- Müller MR, and Rao A (2010). NFAT, immunity and cancer: a transcription factor comes of age. Nat. Rev. Immunol 10, 645–656. [DOI] [PubMed] [Google Scholar]
- Olsen NJ, Schleich MA, and Karp DR (2013). Multifaceted effects of hydroxychloroquine in human disease. Semin. Arthritis Rheum 43, 264–272. [DOI] [PubMed] [Google Scholar]
- Paul S, Kashyap AK, Jia W, He YW, and Schaefer BC (2012). Selective autophagy of the adaptor protein Bcl10 modulates T cell receptor activation of NF-κB. Immunity 36, 947–958. [DOI] [PMC free article] [PubMed] [Google Scholar]
- Pearce EL, Poffenberger MC, Chang CH, and Jones RG (2013). Fueling immunity: insights into metabolism and lymphocyte function. Science 342, 1242454. [DOI] [PMC free article] [PubMed] [Google Scholar]
- Pollizzi KN, and Powell JD (2014). Integrating canonical and metabolic signalling programmes in the regulation of T cell responses. Nat. Rev. Immunol 14, 435–446. [DOI] [PMC free article] [PubMed] [Google Scholar]
- Pua HH, Dzhagalov I, Chuck M, Mizushima N, and He YW (2007). A critical role for the autophagy gene Atg5 in T cell survival and proliferation. J. Exp. Med 204, 25–31. [DOI] [PMC free article] [PubMed] [Google Scholar]
- Pua HH, Guo J, Komatsu M, and He YW (2009). Autophagy is essential for mitochondrial clearance in mature T lymphocytes. J. Immunol 182, 4046– 4055. [DOI] [PubMed] [Google Scholar]
- Puleston DJ, Zhang H, Powell TJ, Lipina E, Sims S, Panse I, Watson AS, Cerundolo V, Townsend AR, Klenerman P, and Simon AK (2014). Autophagy is a critical regulator of memory CD8(+) T cell formation. eLife 3, 03706. [DOI] [PMC free article] [PubMed] [Google Scholar]
- Schenk U, Westendorf AM, Radaelli E, Casati A, Ferro M, Fumagalli M, Verderio C, Buer J, Scanziani E, and Grassi F (2008). Purinergic control of T cell activation by ATP released through pannexin-1 hemichannels. Sci. Signal 1, ra6. [DOI] [PubMed] [Google Scholar]
- Schwartz RH (2003). T cell anergy. Annu. Rev. Immunol 21, 305–334. [DOI] [PubMed] [Google Scholar]
- Sena LA, Li S, Jairaman A, Prakriya M, Ezponda T, Hildeman DA,Wang CR, Schumacker PT, Licht JD, Perlman H, et al. (2013). Mitochondria are required for antigen-specific T cell activation through reactive oxygen species signaling. Immunity 38, 225–236. [DOI] [PMC free article] [PubMed] [Google Scholar]
- Suzuki K, Kirisako T, Kamada Y, Mizushima N, Noda T, and Ohsumi Y (2001). The pre-autophagosomal structure organized by concerted functions of APG genes is essential for autophagosome formation. EMBO J 20, 5971–5981. [DOI] [PMC free article] [PubMed] [Google Scholar]
- Thome R, Moraes AS, Bombeiro AL, Farias Ados S, Francelin C, da Costa TA, Di Gangi R, dos Santos LM, de Oliveira AL, and Verinaud L (2013). Chloroquine treatment enhances regulatory T cells and reduces the severity of experimental autoimmune encephalomyelitis. PLoS ONE 8, e65913. [DOI] [PMC free article] [PubMed] [Google Scholar]
- Thome´ R, Issayama LK, DiGangi R, Bombeiro AL, da Costa TA, Ferreira IT, de Oliveira AL, and Verinaud L (2014). Dendritic cells treated with chloroquine modulate experimental autoimmune encephalomyelitis. Immunol. Cell Biol 92, 124–132. [DOI] [PubMed] [Google Scholar]
- Valdor R, and Macian F (2013). Induction and stability of the anergic phenotype in T cells. Semin. Immunol 25, 313–320. [DOI] [PMC free article] [PubMed] [Google Scholar]
- van Loosdregt J, Rossetti M, Spreafico R, Moshref M, Olmer M, Williams GW, Kumar P, Copeland D, Pischel K, Lotz M, and Albani S (2016). Increased autophagy in CD4+ T cells of rheumatoid arthritis patients results in T-cell hyperactivation and apoptosis resistance. Eur. J. Immunol 46, 2862–2870. [DOI] [PMC free article] [PubMed] [Google Scholar]
- Wehrens EJ, Mijnheer G, Duurland CL, Klein M, Meerding J, van Loosdregt J, de Jager W, Sawitzki B, Coffer PJ, Vastert B, et al. (2011). Functional human regulatory T cells fail to control autoimmune inflammation due to PKB/c-akt hyperactivation in effector cells. Blood 118, 3538–3548. [DOI] [PubMed] [Google Scholar]
- Wells AD (2009). New insights into the molecular basis of T cell anergy: anergy factors, avoidance sensors, and epigenetic imprinting. J. Immunol 182, 7331–7341. [DOI] [PubMed] [Google Scholar]
- Whang MI, Tavares RM, Benjamin DI, Kattah MG, Advincula R, Nomura DK, Debnath J, Malynn BA, and Ma A (2017). The ubiquitin binding protein TAX1BP1 mediates autophagasome induction and the metabolic transition of activated T cells. Immunity 46, 405–420. [DOI] [PMC free article] [PubMed] [Google Scholar]
- Wiede F, Shields BJ, Chew SH, Kyparissoudis K, van Vliet C, Galic S, Tremblay ML, Russell SM, Godfrey DI, and Tiganis T (2011). T cell protein tyrosine phosphatase attenuates T cell signaling to maintain tolerance in mice. J. Clin. Invest 121, 4758–4774. [DOI] [PMC free article] [PubMed] [Google Scholar]
- Xanthoudakis S, Viola JP, Shaw KT, Luo C, Wallace JD, Bozza PT, Luk DC, Curran T, and Rao A (1996). An enhanced immune response in mice lacking the transcription factor NFAT1. Science 272, 892–895. [DOI] [PubMed] [Google Scholar]
- Xu X, Araki K, Li S, Han JH, Ye L, Tan WG, Konieczny BT, Bruinsma MW, Martinez J, Pearce EL, et al. (2014). Autophagy is essential for effector CD8(+) T cell survival and memory formation. Nat. Immunol 15, 1152–1161. [DOI] [PMC free article] [PubMed] [Google Scholar]
- Zheng Y, Collins SL, Lutz MA, Allen AN, Kole TP, Zarek PE, and Powell JD (2007). A role for mammalian target of rapamycin in regulating T cell activation versus anergy. J. Immunol 178, 2163–2170. [DOI] [PubMed] [Google Scholar]
Associated Data
This section collects any data citations, data availability statements, or supplementary materials included in this article.