

Abstract
Background
To reach 90-90-90 targets, differentiated approaches to care are necessary. We describe the experience of delivering multi-monthly ART prescription schedules (MMP) to youth at centers of excellence in six African countries.
Methods
We analyzed data from electronic medical records of patients 0-19 years started on ART. Patients were eligible to transition from monthly prescribing to MMP when clinically stable (improving CD4+, viral load (VL) suppression, or minimal HIV associated morbidity) and ART adherent (pill count 95-105%). Patients were classified as transitioned to MMP after three consecutive visits at intervals of >56 days. We used survival analysis to describe death and lost-to-follow-up (LTFU). We described adherence and acceptable immunologic response by CD4+ using 6-month and VL suppression (<400 copies/ml) using 12-month intervals.
Results
22,658 patients 0-19 years received ART and 14,932 (66%) transitioned to MMP between 2003-2015. Of these 2.6% were LTFU and 2.0% died. Median duration of MMP was 3.9 (IQR: 2.2-5.9) years. There were significant differences in survival (p<0.0001) between age groups; worst amongst those <1 and 15–19 years. The frequency of favorable clinical endpoints was high throughout the first five years of MMP, by year ranging from 87-94% acceptable immunologic response, 75-80% adherent, and 79-85% VL suppression.
Conclusions
These analyses from six African countries demonstrate that youth on ART who transitioned to MMP overall maintained favorable outcomes in terms of death, retention, adherence, immunosuppression, and viral suppression. These results reassure that children and adolescents who are clinically stable and ART adherent, can do well with reduced visit frequencies and extended ART refills.
Keywords: Children Living with HIV & AIDS (CLHIV), Adolescents living with HIV & AIDS (ALHIV), differentiated service delivery, multi-month prescriptions, pediatric, HIV, antiretroviral therapy (ART)
INTRODUCTION
To improve antiretroviral therapy (ART) coverage and help reach the UNAIDS 90-90-90 targets, differentiated approaches to care are necessary.1–3 Differentiated service delivery (DSD) is an approach that has a client-centered focus and seeks to simplify and adapt HIV services to better serve the needs of people living with HIV (PLHIV) and at risk of acquiring HIV and reduce unnecessary burdens on the health system.3 Among the promising DSD models is multi-month prescription (MMP), where stable clients are able to increase the time between their clinic visits and ART refills thereby reducing the amount of time spent at the facility.4,5 Providing MMP for stable patients can potentially help save both patient and health care worker time; reduce facility congestion; and, hypothetically, by simplifying the ART visit schedule, encourage patient engagement in care.6–9
There have been reservations about adapting DSD models such as MMP for children and adolescents living with HIV (ALHIV).10 For children, the misconception that frequent dosing changes are required has led to avoidance of clinic visit spacing and extended ART refills, while for adolescents, the concern of special adherence issues has often precluded them being included in DSD.2,10 These concerns are likely unfounded—for children, only five routine ARV dosing changes would be expected from infancy to age ten;11 and simply increasing the frequency of clinical visits may not improve adolescent adherence to ART. While many arguments can be made for inclusion of these populations in DSD programs, currently there is little empirical data regarding the potential impact of reducing ART clinic visits or extending ART refills on outcomes amongst children and ALHIV.
In partnership with respective Ministries of Health, the Baylor International Pediatric AIDS Initiative (BIPAI) has centers of excellence (COE)s in six African countries. Our main objective was to evaluate the feasibility and describe five-year patient outcomes among children and adolescents on ART who transitioned to MMP at the BIPAI COEs.
METHODS
Ethical Approval
The study protocol was approved, with waiver of the requirement for individual consent/assent, by relevant local Internal Review Boards (IRB)s in each country and by the IRB of Baylor College of Medicine, in Houston, Texas.
Study design, population & eligibility
In partnership with respective Ministries of Health, BIPAI operates COEs in Botswana, Lesotho, Swaziland, Malawi, Uganda and Tanzania (Mbeya and Mwanza). These COEs provide free, comprehensive HIV care for HIV-infected infants, children and adolescents in alignment with national guidelines. We conducted an analysis of de-identified patient data from standardized electronic medical records at these seven COEs in six African countries. This analysis included all patients 0-19 years of age who transitioned to MMP from Jan 1, 2003 to June 30, 2015.
MMP was introduced in each country in accordance with national policy. There were no established, standardized criteria across the clinical network to determine patient eligibility for transition to MMP. The decision to switch to MMP was made on an individual basis and varied by provider and facility. In general patients were transitioned to MMP when deemed to be clinically stable and ART adherent, typically after 6-9 months of monthly prescriptions (MP). Clinically stable was defined as: improving CD4+ cell count/CD4% or viral load (VL) suppression, or minimal HIV associated morbidity. Patients were considered ART adherent if the pill count was measured at 95-105%. Patients receiving second line ART regimens were also eligible for MMP.
ART regimens prescribed at each COE were in-line with contemporary local ART guidelines based on WHO guidance (Table 1). These guidelines generally recommended NNRTI-based regimens although LPV/r became available for those < 3 years in some countries, especially after 2014. Adherence measurement at each COE was mandated from 2008 onwards and was assessed via pill count at each refill visit. CD4+ testing was typically conducted every 6 months- contingent upon availability of testing capacity. VL assessment became routine in most COEs from 2014 onwards (Table 1), and was conducted annually in most countries. The exception to this was Botswana, which implemented routine VL measurements with the launch of its ART program in 2003, and conducted VL monitoring every 3 months.
Table 1.
National and COE policies and practices related to first line ART, ART dispensing policy, and routine viral load
| Country | 1st line ART regimens | ART prescription/dispensing policy | Routine VL testing implementation. year started and frequency |
|---|---|---|---|
| Botswana |
2002: AZT-3TC (CBV)- EFV or NVP. 2008-2011: Child AZT-3TC-NVP (EFV if <3 yr). If neonatal sd-NVP & >6mo: AZT-3TC-LPV/r; Adolescent TDF-FTC (or 3TC)- EFV or NVP. 2012-2015: Child, Tx naïve <3 yr: AZT-3TC-NVP, Tx naïve >3 yr: AZT-3TC-EFV. If ≤3 yr & exposed to sdNVP: AZT-3TC-LPV/r. If >3 yr & exposed to sdNVP: AZT-3TC-EFV; Pre-Pubertal Adolescent (Tanner I-II) AZT-3TC-NVP or EFV. Post-Pubertal Adolescent (Tanner IV & V) TDF-FTC-NVP or EFV |
Monthly or 2 monthly with rare 3 monthly exceptions | 2003 every 3 months |
| Lesotho |
2010-2013: <3y or <10kg w no NNRTI exposure: AZT/ABC-3TC-NVP; <24 mo & NNRTI exposure: AZT /ABC-3TC-LPV/r; >3 yrs & >10 kg: AZT/ABC-3TC-EFV; >12 yrs & >35 kg: TDF -3TC-EFV. 2016: <3 yr: ABC-3TC-LPV/r; 3-9 yr or <35 kg: ABC-3TC-EFV; 10-19 yr & ≥35 kg: TDF-3TC-EFV. |
Variable prescription durations with monthly dispensing | 2016 every 6 months |
| Swaziland |
2006: D4T-3TC-NVP 2010: child: d4T-3TC-NVP; Adolescent TDF-3TC-EFV 2015: 5-12 yrs TDF + 3TC + EFV (adult FDC); 3-5 yrs NVP exposed- ABC + 3TC + LPV/r, NVP unexposed ABC + 3TC + EFV; <3 yrs ABC + 3TC + LPV/r |
MMP for stable patients after 6 to 9 months | 2015 6 mo and 12 mo after ART initiation then ever year if <10 yr & every 6 mo if 10-19 yr |
| Malawi |
Before 2010: d4T-3TC-NVP 2011-2013: <15 yr: AZT-3TC-NVP ; ≥15 yr: d4T-3TC-NVP 2014-2015: <15 yr: AZT-3TC-NVP ; ≥15 yr: TDF-3TC-EFV |
MMP for patients stable after 6 months of ART | 2014 6 mo after ART initiation then every 2 years |
| Uganda |
2003-2007: AZT/d4T-3TC-NVP or EFV; 2008-2011: Child d4T-3TC-NVP or EFV; (≥ 5 yrs): AZT-3TC- NVP or EFV 2012-2015: Child AZT-3TC-NVP or EFV. If exp to NVP during PMTCT: AZT-3TC-LPV/r; Adolescent TDF-3TC-NVP or EFV 2016: Child <3 yr: ABC-3TC-LPV/r. 3-10 yr (<35 kg): ABC-3TC-EFV; Adolescent TDF-3TC-EFV |
MMP with per patient exceptions | 2015 every 6 months |
| Tanzania |
2009-2014: <3 yr: AZT-3TC-NVP; ≥3 yr-15 yr: AZT-3TC-EFV or NVP; >15 yr: AZT-3TC-EFV 2015-2016: <3 yr: ABC-3TC-LPV/r; 3 yr to <35kg: ABC-3TC-EFV; >35 kg: TDF-3TC-EFV |
MMP for patients stable after 6 months ART | 2016 6 mo after ART initiation then every year |
Patients were considered to have transitioned to MMP if they had 3 consecutive visits that occurred between 56 and 180 days of each other. The date of the first MMP-qualifying visit was the MMP start date. Patients who transitioned to MMP < 12 months before the end of the observation period, June 30, 2016, were excluded from the analysis. Patients were analyzed in the MMP group it they ever started MMP.
At all COE’s except Lesotho, when a patient was moved to MMP, they received fewer clinical visits as well as extended ART refills (sufficient ART until their next scheduled appointment). In Lesotho, when a patient was considered stable, clinical visits were spaced beyond one month, but until 2016 they continued to return to the clinic monthly to pick up medication. During these monthly visits, they only saw a pharmacist (and received additional ART).
Variables and definitions
Baseline characteristics included demographics (age, sex), WHO stage, age at ART initiation and transition to MMP. Outcome measures were mortality, lost-to-follow-up (LTFU), ART adherence assessment, immunosuppression as measured by CD4+, and viral load. Mortality was determined by a chart status of “Died” and the date that the electronic chart was closed. If the status was “Died” and the chart had not been closed, then the last visit date was used as the date of death. LTFU was determined by a chart status of “LTFU” and the date the electronic chart was closed. If the status was “LTFU” and the chart was not closed, then the date following the most recent visit was used. In practice, a patient was classified as lost-to-follow up (LTFU) if he/she had not returned for any scheduled visit and could thereafter not be contacted or was unwilling to return for care. LTFU rates were calculated based on the number of patients whose chart status was “lost-to-follow-up” within the timeframe of the examined visits. Transferred out was determined by a chart status of “transfer out”. In practice a patient was classified as transferred out if it was documented that the patient transferred to other facilities for care. Patients on ART at their most recent clinic visit were classified as active.
Patients were classified as attaining acceptable immunological response or not, acceptable being CD4+ cell count > 350 for patients 5 years of age or older and reaching CD4+ percentage > 25% for children less than 5 years of age. Patients were classified as having good adherence when the recorded pharmacy pill count was between 95% and 105%. Viral load measurements were categorized as suppressed or unsuppressed with suppressed defined as < 400 copies/ml.
Statistical analysis
All patient data were de-identified prior to analysis. Statistical analysis was performed using IBM SPSS Statistics 24 (IBM, Chicago, Ill). In keeping with an intent-to-treat analysis, patients once allocated to the MMP group were maintained in that group for the duration of their follow-up, even if they subsequently reverted to monthly prescriptions.
Patient characteristics were described using measures of central tendency (medians and interquartile ranges (IQRs) because they were non-Gaussian) if they were continuous (age at ART initiation, age at MMP initiation, ART duration, and MMP duration) and frequencies if they were categorical (gender, WHO stages, and patient status). In addition to description with medians, age at ART and MMP initiation were categorized and described using frequencies. Patient characteristics were described for the entire patient population and stratified by COE.
Survival analysis was performed to describe patient survival and LTFU. Five-year survival rates were estimated for all study patients and stratified by COE and age of MMP initiation. Kaplan-Meier curves were created for 5 years of MMP follow up for the combined study population. Since LTFU patients may have died, separate survival curves were created for the patient status as categorized (only patients categorized as died are dead) and assuming the worst-case scenario that all LTFU patients also died. Right-censored categories included active, LTFU, and transferred out. In creating the survival curves, time to event (death and LTFU) was estimated from the date of MMP initiation to the date of chart closure or the date of last clinic visit if there was no date of chart closure. Time to right-censoring was estimated from the date of MMP initiation to the date of last clinic visit. Kaplan-Meier curves for time to death were also stratified by COE and age of MMP initiation and comparisons were made between survival using log rank tests.
The frequencies of clinical outcomes (adherence, CD4, viral load) were evaluated over time using repeated measures analysis. Outcomes were grouped into measures taken at 6-month intervals for adherence and CD4+ and 12-month intervals for VL. Because measures were not performed on all patients at exact 6- and 12-month intervals, measures taken closest to the 6- or 12-month intervals, but within 3- to less than 9-month or 6- to less than18-month intervals respectively were used. Some patients did not have measurements for all 6- or 12-month intervals; the frequency of these missing values is described for each outcome as the number of patients tested divided by the number of patients followed at that follow up interval.
For each outcome, the results are presented visually as outcome frequencies (acceptable immunologic response, ART adherent, VL suppression) at baseline (MMP start) and 6- or 12-month intervals (depending on the outcome) up to 5 years of MMP, for all patients and stratified by COE and age group. Statistical comparisons were made using general estimating equations (GEEs).
Sensitivity analysis was performed examining key outcomes between non-Lesotho and Lesotho COE patients. Kaplan-Meier curves for time to death were stratified by non-Lesotho and Lesotho COEs and comparisons were made between survival and LTFU using log rank tests for all groups and stratified by at MMP initiation. Frequencies of VL suppression at baseline (MMP start) and 12-month intervals up to 5 years of MMP, for all patients stratified by non-Lesotho and Lesotho COEs
RESULTS
Patient characteristics
There was a total of 22,658 patients aged 0-19 years receiving ART and potentially eligible for inclusion in the analysis (Figure 1). Of the 5245 patients who received MP but were not transitioned to MMP, 708 patients were LTFU and 870 died. Overall, 17,413 patients were transitioned to MMP, 14,932 of them between January 1, 2003 and June 30, 2015 (Table 2). The largest number of patients was enrolled in the Uganda COE (37.7%), followed by Malawi (16.5%), Botswana (13.2%), Lesotho (13.0%), Swaziland (9.6%), Mbeya, Tanzania (5.6%), and Mwanza, Tanzania (4.4%). The median age at ART initiation was 5.4 years (IQR: 2.0 to 9.6 years). Over the period of observation, patients took ART for a median of 5.8 years (IQR: 3.7 to 8.4 years). The median time on ART prior to transition from MP to MPP was 1.1 year (IQR: 0.4 to 2.5 years) and median age at transition was 7.5 years (IQR: 3.8 to 11.5 years). The median duration on MMP was 3.9 years (IQR: 2.2 to 5.9 years) for all participants, and was longest, at 5.9 (IQR: 2.9 to 8.9 years) in Botswana.
Figure 1.
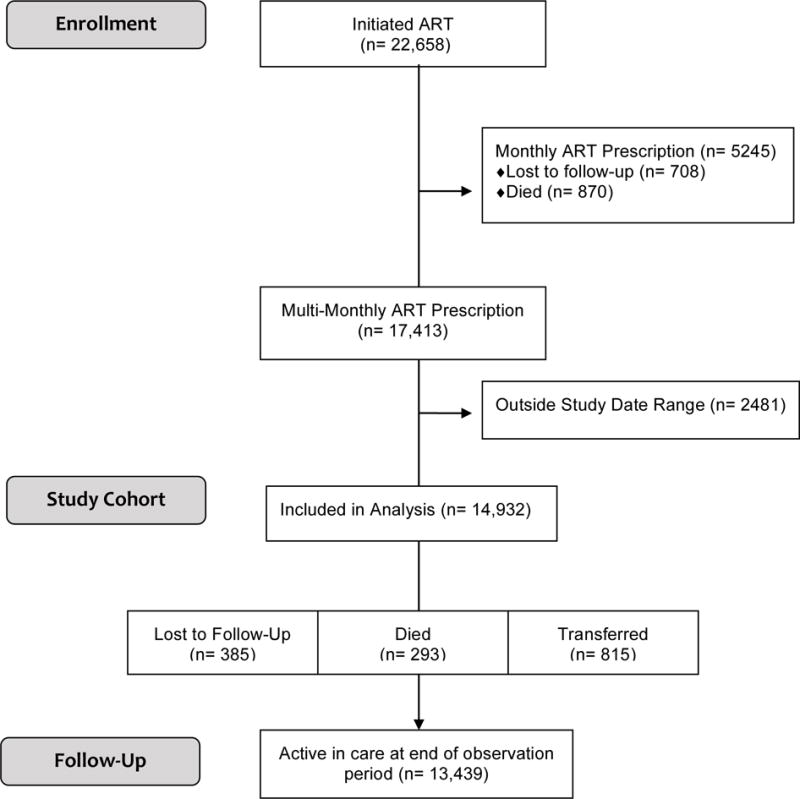
Study Flow Diagram
Table 2.
Patient Characteristics for 14,932 MMP Patients, Stratified by Center of Excellence
| Patient Characteristics | Center of Excellence | |||||||
|---|---|---|---|---|---|---|---|---|
| All | Botswana | Lesotho | Swaziland | Malawi | Uganda | Mbeya | Mwanza | |
| N | 14,932 | 1972 | 1942 | 1432 | 2463 | 5636 | 833 | 654 |
| Gender Female – n (%) | 7458 (49.9) |
936 (47.5) |
935 (48.1) |
698 (48.7) |
1203 (48.8) |
2935 (52.1) |
430 (51.6) |
321 (49.1) |
| Age at ART Initiation in Years – Median (IQR) | 5.4 (2.0, 9.6) |
5.3 (1.9, 8.8) |
5.7 (1.8, 9.4) |
5.2 (1.8, 9.3) |
4.5 (1.7, 9.1) |
5.9 (2.2, 10.3) |
6.4 (2.6, 10.0) |
5.3 (2.0, 9.3) |
| Age at ART Initiation in Years – Categorized – n (%) | ||||||||
| < 1 | 1801 (12.1) |
302 (15.3) |
292 (15.0) |
167 (11.7) |
307 (12.5) |
593 (10.5) |
75 (9.0) |
65 (9.9) |
| 1-4 | 5257 (35.2) |
635 (32.2) |
613 (31.6) |
532 (37.2) |
999 (40.6) |
1973 (35.0) |
257 (30.9) |
248 (37.9) |
| 5-9 | 4442 (29.7) |
691 (35.0) |
621 (32.0) |
421 (29.4) |
642 (26.1) |
1563 (27.7) |
295 (35.4) |
209 (32.0) |
| 10-14 | 2885 (19.3) |
319 (16.2) |
369 (19.0) |
263 (18.4) |
455 (18.5) |
1194 (21.2) |
175 (21.0) |
110 (16.8) |
| 15-19 | 547 (3.7) |
25 (1.3) |
47 (2.4) |
49 (3.4) |
60 (2.4) |
313 (5.6) |
31 (3.7) |
22 (3.4) |
| Age at MMP Initiation in Years – Median (IQR) | 7.5 (3.8, 11.5) |
7.6 (3.8, 10.9) |
7.4 (3.5, 11.1) |
7.0 (3.6, 11.2) |
6.1 (3.1, 10.8) |
7.7 (4.3, 12.0) |
9.0 (4.9, 12.8) |
8.1 (4.5, 12.4) |
| Age at MMP Initiation in Years – Categorized – n (%) | ||||||||
| < 1 | 342 (2.3) |
71 (3.6) |
70 (3.6) |
14 (1.0) |
29 (1.2) |
129 (2.3) |
20 (2.4) |
9 (1.4) |
| 1-4 | 4662 (31.2) |
564 (28.6) |
611 (31.5) |
502 (35.1) |
1027 (41.7) |
1586 (28.1) |
192 (23.0) |
180 (27.5) |
| 5-9 | 4920 (32.9) |
721 (36.6) |
619 (31.9) |
340 (33.0) |
699 (28.4) |
1934 (34.3) |
257 (30.9) |
217 (33.2) |
| 10-14 | 3635 (24.3) |
462 (23.4) |
507 (26.1) |
340 (23.7) |
494 (20.1) |
1400 (24.8) |
260 (31.2) |
172 (26.3) |
| 15-19 | 1373 (9.2) |
154 (7.8) |
135 (7.0) |
103 (7.2) |
214 (8.7) |
587 (10.4) |
104 (12.5) |
76 (11.6) |
| ART Duration in Years – Median (IQR) | 5.8 (3.7, 8.4) |
8.6 (5.4, 11.1) |
6.3 (4.1, 8.4) |
6.0 (3.9, 7.9) |
5.8 (3.9, 8.0) |
5.5 (3.4, 8.1) |
4.0 (2.9, 6.4) |
4.6 (3.0, 6.8) |
| MMP Duration in Years – Median (IQR) | 3.9 (2.2, 5.9) |
5.9 (2.9, 8.9) |
4.1 (2.4, 6.7) |
4.3 (2.2, 6.0) |
4.1 (2.2, 6.5) |
3.9 (2.3, 5.4) |
2.3 (1.4, 3.3) |
2.6 (1.6, 3.6) |
| WHO Stage at ART Initiation – n (%) | ||||||||
| I | 1607 (10.8) |
160 (8.1) |
461 (23.7) |
201 (14.0) |
345 (14.0) |
345 (6.1) |
46 (5.5) |
49 (7.5) |
| II | 2260 (15.1) |
157 (8.0) |
175 (9.0) |
286 (20.0) |
349 (14.2) |
1144 (20.3) |
85 (10.2) |
64 (9.8) |
| III | 3781 (25.3) |
615 (31.2) |
539 (27.8) |
524 (36.6) |
1055 (42.8) |
822 (14.6) |
134 (16.1) |
92 (14.1) |
| IV | 1892 (12.7) |
313 (15.9) |
229 (11.8) |
208 (14.5) |
239 (9.7) |
572 (10.1) |
194 (23.3) |
137 (20.9) |
| Missing | 5392 (36.1) |
727 (36.9) |
538 (27.7) |
213 (14.9) |
475 (19.3) |
2753 (48.8) |
374 (44.9) |
312 (47.7) |
| Acceptable immunologic response at MMP initiation – n (%) | 11,204 (87.4) |
1387 (90.3) |
1674 (88.9) |
1239 (92.8) |
1497 (88.2) |
4384 (85.5) |
559 (80.3) |
464 (86.1) |
| Treatment adherence at MMP initiation – n (%) | 9288 (79.1) |
934 (88.7) |
1199 (85.2) |
1327 (93.6) |
1922 (84.7) |
2900 (69.2) |
473 (60.1) |
533 (86.0) |
| VL <400 copies/ml at MMP initiation – n (%) | 2783 (81.9) |
1116 (89.4) |
177 (89.8) |
91 (85.0) |
430 (85.0) |
963 (72.5) |
0 (0.0) |
6 (50.0) |
| Patient Status | ||||||||
| Active | 13,439 (90.0) |
1831 (92.8) |
1676 (86.3) |
1248 (87.2) |
2177 (88.4) |
5156 (91.5) |
750 (90.0) |
601 (91.9) |
| Transferred | 815 (5.5) |
90 (4.6) |
167 (8.6) |
115 (8.0) |
143 (5.8) |
202 (3.6) |
57 (6.8) |
41 (6.3) |
| LTFU | 385 (2.6) |
17 (0.9) |
64 (3.3) |
48 (3.4) |
82 (3.3) |
160 (2.8) |
7 (1.1) |
5 (0.8) |
| Died | 293 (2.0) |
34 (1.7) |
35 (1.8) |
21 (1.5) |
61 (2.5) |
118 (2.1) |
17 (2.0) |
7 (1.1) |
ART = antiretroviral therapy, IQR = interquartile range, MMP = multi-monthly prescription, WHO = World Health Organization, LTFU = lost to follow up
Outcomes
Death and LTFU
Overall, after transition to MMP, 293 patients died and 385 were classified as LTFU. Of the 293 who died during the study, 187 died in the first 2 years and 263 in the first 5 years. Of the 385 who were LTFU over the study, 258 were lost in the first 2 years and 366 in the first 5 years.
The 5-year KM curve for known deaths (Fig 2a), LTFU (Fig 2b), and combined deaths and LTFU (Fig 2c) indicate an even distribution of deaths and LTFU over time. However, there were significant differences in survival (p < 0.0001) and LTFU (p < 0.0001) between age groups (Fig 2a and 2b). For both mortality and LTFU, the youngest (< 1 year) and oldest (15 – 19 years) age groups had the least favorable KM curves.
Figure 2.
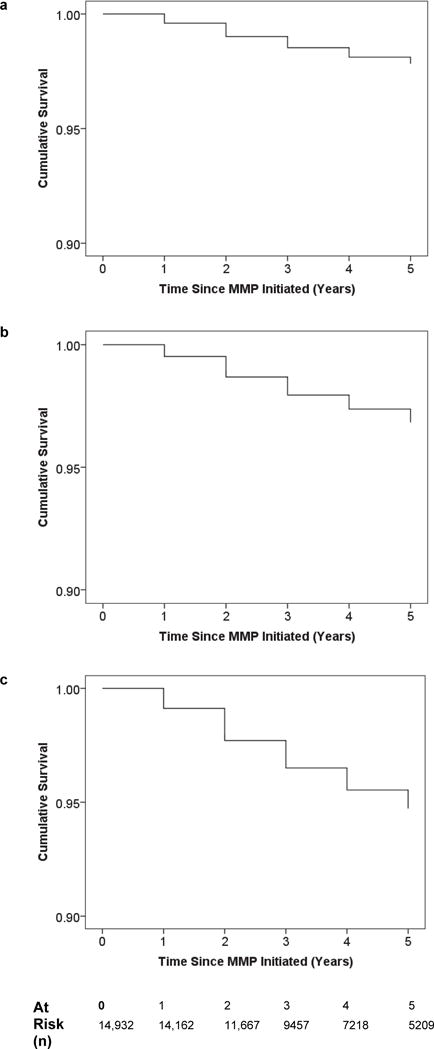
Kaplan-Meier Curves for known Deaths (2a), LTFU (2b) and known deaths and LTFU (2c)
Sub-analyses by COE (Supplementary Figure 1) revealed significant differences for survival (p-value = 0.014) and LTFU (p-value < 0.0001) by center, with Botswana having the most favorable outcomes. The 5-year KM curves for known deaths (Supplementary Figure 4a) and LTFU (Figure 4b) indicate similar distributions of deaths (Log Rank P-value = 0.375) and LTFU (Log Rank P-value = 0.083) over time for non-Lesotho and Lesotho COEs.
Figure 4.
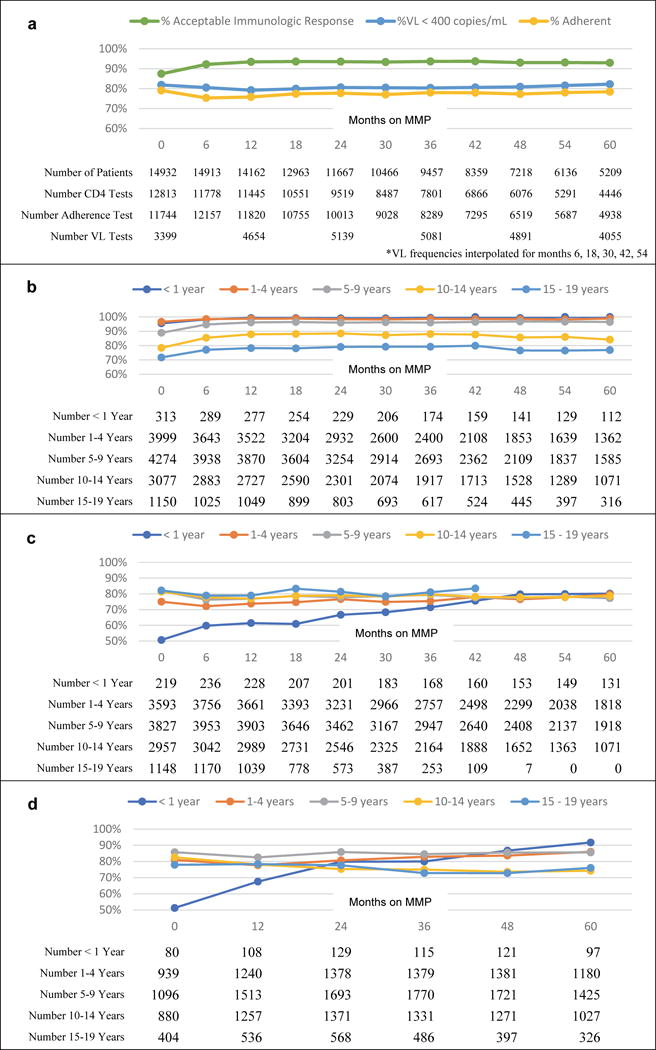
4a. Frequency of favorable immunologic status, adherence assessment, and VL results amongst participants with available results
4b. Frequency of acceptable immunologic response levels by age at MMP initiation
4c. Frequency of treatment adherence by age at MMP initiation
4d. Frequency of VL <400 copies/ml by age at MMP initiation
Adherence, CD4+, viral load
Over the period of observation, CD4+ testing frequency did not change substantially, ranging from 79-86% of children and adolescents undergoing CD4+ testing at each 6-month visit interval. There was a steady increase in the proportion of patients receiving adherence assessment at MMP visits, from a baseline of 79% clients at transition to MMP, to 87% after 5 years of MMP. VL testing also increased considerably, from 23% of children and adolescents receiving a VL test at baseline to 66% at 5 years, consistent with the eventual introduction of routine VL measurements. (Supplemental Figure 2)
The frequency of favorable clinical endpoints (ART adherence, acceptable immunologic status, and VL< 400) was high and relatively stable throughout the first 5 years of MMP follow-up (Figure 4a). Using the last non-missing result for each patient 93.1% (13,688/14,701) had normal CD4+ levels, 76.1% (10,976/14,428) had good adherence, 82.3% (9199/11,179) had VL <400. Stratifying each of these endpoints by COE and age at MMP initiation revealed significant differences by age, but significant differences by COE were only observed for viral load and not for CD4+ or adherence (Supplementary Figure 2). Throughout the 5-year follow up period, the frequency of VL suppression remained favorable for non-Lesotho and Lesotho COEs (Supplementary Figure 4c).
Adherence remained favorable but was statistically (p-value < 0.0001) different between age groups (Figure 4c). In the first 36 months after transition to MMP, adherence was lowest in patients who started MMP under 1 year of age; after 36 of MMP months, the pattern changed and adherence was similar across all age groups, except the oldest group for whom adherence data were lacking. Patients who transitioned to MMP after the age of 14 years had 81.7% adherence when they started and 81.4% at last testing. Patients who transitioned to MMP under the age of 14 years had 79.8% adherence when they started and 78.8% adherence when last tested over the age of 14 years. Reported adherence among MMP patients did not differ by COE (see Supplementary Figure 3).
The frequency of favorable immunologic response remained positive but differed significantly (p-value < 0.0001) by age at MMP initiation (Figure 3b) but not COE (Supplemental Figure 1). The frequency of favorable immunologic response was higher for patients who were started on MMP in the three youngest age groups, than the two oldest age groups (Figure 3b).
Figure 3.
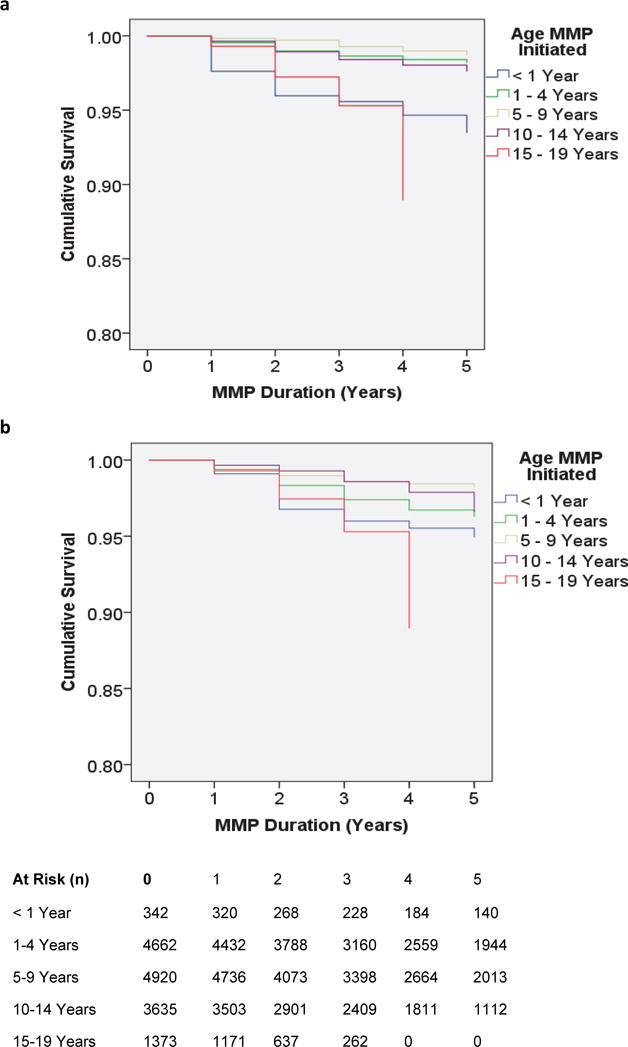
Survival Function for (3a) Known Deaths and (3b) LTFU, Stratified by Age at MMP initiation
The frequency of VL suppression also remained favorable but was significantly (p-value < 0.0001) different between age groups (Figure 4d). In the first 24 months after MMP transition, the frequency of VL suppression was lowest for the youngest patients (<1 years old), after which it was lower for patients in the older age groups (10-14 and 15-19 years old). There were significant differences between study centers in the frequencies of VL suppression (Supplementary Figure 3). VL suppression was more favorable in infants who remained in the study (did not die and were not lost to follow up) than infants who died or were lost to follow up: 55% and 22%, respectively, compared with 51% overall VL suppression in this age group. Furthermore, mortality or LTFU was 11.5% in infants without, and 5.8% in infants with, VL suppression at MMP initiation.
DISCUSSION
This analysis of close to 23,000 children and adolescents from six African countries demonstrates that transition from monthly (MP) to multi-monthly prescription (MMP) schedules was feasible and provides evidence of ongoing favorable health outcomes in terms of mortality, retention, ART adherence, viral suppression, and immunologic status. These results, therefore, may provide reassurance to clinicians that implementing reduced frequency of clinical visits and extending ART refills is doable and can work for these populations. To our knowledge, this is the first study examining the potential impact of MMP on clinical outcomes amongst children and adolescents living with HIV.
Patients transitioned to MMP were, by definition, those who had survived, been retained, were clinically stable and ART adherent. Therefore, it is perhaps not surprising that their outcomes remained favorable by all the measures we were able to assess over time as well as across diverse countries, COEs, and ages. The majority of patients at the COEs transitioned to MMP. Of those who transitioned to MMP only 2.6% of patients were LTFU and 2.0% died over the course of the study. Most LTFUs and deaths occurred in the first 5 years after MMP initiation. Throughout the first 5 years, ART adherence and viral suppression remained high.
Although outcomes remained favorable for each age group and country, there were some noteworthy differences. Patients 15-19 years old or < 1 year of age at the time of transition to MMP were at higher risk for LTFU and mortality compared to other age groups. Although this finding was not surprising, given the known higher mortality amongst these age groups, 4,12,13 importantly, LTFU and mortality were still very low. However, especially given the finding that infants without VL suppression appeared to have worse mortality and LTFU, until additional evidence is available, providers should use caution before moving infants (<1 year of age) to MMP before viral suppression is achieved. Adolescents, 10-19 years old, had worse rates of viral suppression. These findings align with global evidence demonstrating that adolescents are a vulnerable group at risk of poor adherence.14 However, our evidence suggests that MMP does not worsen adherence amongst adolescents, and we are not aware of any other evidence that suggests that increasing the frequency of visits helps to improve adherence amongst ALHIV.15
Comparisons between COEs revealed that participants enrolled in care at the Botswana COE had better survival, LTFU and VL suppression. Botswana’s COE has been better resourced- with earlier access to more robust drug regimens, CD4+ and VL monitoring. However, it is reassuring that outcomes amongst patients from the COEs with fewer resources who transitioned to MMP, remained relatively stable.
Successful implementation of MMP required clinical criteria for assessing adherence to ART and/or clinical progress such as adherence measurement (pill count), CD4+ and VL measurements, as well as clinical determination of HIV associated morbidity. Importantly, staff was trained to interpret measurements and make these clinical assessments. Barriers to MMP may include forecasting and supply chain limitations, such as insufficient supply of ARVs at the facility level. Although, not formally assessed, anecdotally these were issues that arose during implementation of MMP. To some extent this may be mitigated through training of pharmacy staff and the use of good commodity management systems. Furthermore, pharmacy pill counts and CD4+ were used as measures of adherence and response to treatment, however, viral suppression is a better indicator of response to treatment and non-adherence10,16,17 and was not more widely available until later.18–25 Moving forward, more widespread utilization of VL could facilitate more meaningful evaluation of baseline readiness for MMP and further improve clinical outcomes.
A significant benefit of MMP is likely to be time-savings for both health care providers and patients. In this study, we did not specifically explore the impact of MMP on provider and patient time. Anecdotally, the most common provider-reported benefit of MMP at all countries was the consequent reduction in patient load. Other studies have explicitly explored the relationship between MMP and time-savings. A recent study from Myanmar reported that implementing decreased physician visits and fast track refills demonstrated an increase in the average number of patients one medical team could care for – from 745 patients in 2011 to 1, 627 in 2014 – and, thus, a reduction in the number of teams needed.26
Several potential study limitations should be kept in mind when reviewing the results. The COEs are relatively well staffed and these personnel may have had more training and resultant confidence with managing pediatric HIV than their peers at primary health centers in many Sub-Saharan African countries. Moreover, the centers have staff to provide counselling and support for adherence as well as personnel designated to track patients missing clinic visits. Tracking of patients missing appointments is done both via telephone and home visits. Adherence was only measured by pharmacy pill count. Therefore, adherence measurements amongst infants started on liquid formulations or split tablet dose formulations- may be less accurate. In the early years at the COEs, VL availability was more limited. Therefore, there may have been biased/differential testing of VL early in the study years. Because testing was not uniform and because sicker patients may have been more likely to be tested, differences between age groups and centers could reflect a bias in testing rather than true differences in VL. Finally, this is a descriptive study of routinely collected patient data, and we did not use a clearly defined and uniform set of criteria to judge eligibility for MMP, and there was no MP comparison group. Therefore, although the results are reassuring, we cannot make definitive conclusions on the impact of MMP that might be possible via a prospective clinical trial. The MMP group was analyzed as MMP even if they might have gone back to MP. If we assume that patients ‘went back’ to MP because they became more ill, our analysis may be biased toward MMP results appearing less good then they actually were. To date, we are not aware of other evidence regarding the impact of MMP on clinical outcomes amongst children and adolescents living with HIV.
CONCLUSION
Overall, this analysis of close to 23,0000 children and adolescents from six African countries demonstrates that a transition to multi-monthly prescription schedules with less frequent clinical visits and extended ART refills was feasible and provides evidence of ongoing favorable health outcomes in terms of immunologic status, ART adherence, viral suppression, retention, and mortality.
Supplementary Material
Acknowledgments
Funding
We thank the Ministry of Health in all participating countries for their partnership in this endeavor. We thank the BIPAI Network including: Dr. Peter N. Kazembe (Malawi), Dr. Edith Mohapi (Lesotho), Dr. Khosie Hlatshwayo (Swaziland), Dr. Lumumba Mwita (Tanzania), Dr. Adeodata Kekitinwa (Uganda), Prof. Gabriel Anabwani (Botswana), Drs. Mark Kline and Gordon Schutze. We are very grateful to the children, adolescents, and families who inspire us with their perseverance and courage. We appreciate the support rendered from the USAID Regional HIV AIDS Program, USAID Washington, and the Technical Support to PEPFAR Programs (TSP) team.
Support for this publication is made possible by the support of the American people in partnership with the U.S. President’s Emergency Plan for AIDS Relief (PEPFAR) through the United States Agency for International Development (USAID) under the Cooperative Agreement Technical Support for PEPFAR Programs in Southern Africa (TSP), Agreement number AID-674-A-16-00003. MHK was supported by the Fogarty International Center of the National Institutes of Health under award number K01 TW009644.
Footnotes
Authors Contributions
MHK co-designed the study, was responsible for study coordination, helped interpret findings and led manuscript writing. RSW co-designed the study, led data management, helped analyze the data, interpret findings and assisted with manuscript writing. CC was responsible for data management, statistical analysis, and assisted with interpretation and manuscript writing. RG conceived the study and RG and AA provided global context, helped interpret findings and assisted with manuscript writing. SA helped design the study, assisted with study design and participated in manuscript writing. JM, DD AK, MC, SD, NC, MM, NRC assisted with data management, and critically reviewed the manuscript for important intellectual content. EJA assisted with study design, interpretation of findings and manuscript writing. All authors have read and approved the final manuscript.
Competing Interests
The authors have no competing interests to declare.
Disclaimer
The contents of this report are the sole responsibility of the authors and do not necessarily reflect the views of PEPFAR, USAID, National Institute for Health or the United States Government.
References
- 1.UNAIDS. 90-90-90 An ambitious treatment target to help end the AIDS epidemic. UNAIDS; 2014. http://www.unaids.org/sites/default/files/media_asset/90-90-90_en.pdf. [Google Scholar]
- 2.Abrams EJ, Strasser S. 90-90-90 – Charting a steady course to end the paediatric HIV epidemic. J Int AIDS Soc. 2015;18(7Suppl 6):20296. doi: 10.7448/IAS.18.7.20296. [DOI] [PMC free article] [PubMed] [Google Scholar]
- 3.WHO, CDC, PEPFAR et al. Key considerations for differentiated antiretroviral therapy delivery for specific populations: children, adolescents, pregnant and breastfeeding women and key populations. Geneva, Switzerland: World Health Organization; 2017. http://www.who.int/hiv/pub/arv/hiv-differentiated-care-models-key-populations/en/ [Google Scholar]
- 4.UNAIDS. The Gap Report. Geneva, Switzerland: UNAIDS; 2014. http://www.unaids.org/sites/default/files/media_asset/UNAIDS_Gap_report_en.pdf. [Google Scholar]
- 5.UNAIDS. Fact Sheet 2014. Geneva, Switzerland: UNAIDS; 2014. http://files.unaids.org/en/media/unaids/contentassets/documents/factsheet/2014/20140716_FactSheet_en.pdf. [Google Scholar]
- 6.World Health Organization. HIV Treatment and Care: What’s New in Service Delivery. Geneva, Switzerland: World Health Organization; 2016. http://www.who.int/hiv/pub/arv/arv2015-service-delivery-factsheet/en/ [Google Scholar]
- 7.Bemelmans M, Baert S, Goemaere E, et al. Community-supported models of care for people on HIV treatment in sub-Saharan Africa. Trop Med Int Health. 2014;19(8):968–977. doi: 10.1111/tmi.12332. [DOI] [PubMed] [Google Scholar]
- 8.Prust ML, Banda CK, Nyirenda R, et al. Multi-month prescriptions, fast-track refills, and community ART groups: results from a process evaluation in Malawi on using differentiated models of care to achieve national HIV treatment goals. J Int AIDS Soc. 2017;20(Suppl 4):21650. doi: 10.7448/IAS.20.5.21650. [DOI] [PMC free article] [PubMed] [Google Scholar]
- 9.Mutasa-Apollo T, Ford N, Wiens M, et al. Effect of frequency of clinic visits and medication pick-up on antiretroviral treatment outcomes: a systematic literature review and meta-analysis. J Int AIDS Soc. 2017;20(Suppl 4):21647. doi: 10.7448/IAS.20.5.21647. [DOI] [PMC free article] [PubMed] [Google Scholar]
- 10.World Health Organization. Consolidated Guidelines on the use of Anitretroviral Drugs for Treatment and Preventing HIV Infection 2016: Recommendations for a Public Health Approach. 2nd. Geneva, Switzerland: World Health Organization; 2016. [Google Scholar]
- 11.USAID. Clinical Considerations for Multi-Month Prescribing in Four Priority Populations: Pregnant and Breastfeeding Women, HIV-Exposed Infants, Children Living with HIV, and Adolescents Living with HIV. USAID Pediatric and Maternal Clinical Branch; Aug, 2016. [Google Scholar]
- 12.Bekker L-G, Hosek S. HIV and adolescents: focus on young key populations. J Int AIDS Soc. 2015;18(2Suppl 1):20076. [Google Scholar]
- 13.Newell ML, Coovadia H, Cortina-Borja M, et al. Mortality of infected and uninfected infants born to HIV-infected mothers in Africa: a pooled analysis. Lancet. 2004;364(9441):1236–1243. doi: 10.1016/S0140-6736(04)17140-7. [DOI] [PubMed] [Google Scholar]
- 14.Makadzange AT, Higgins-Biddle M, Chimukangara B, et al. Clinical, virologic, immunologic outcomes and emerging HIV drug resistance patterns in children and adolescents in public ART care in Zimbabwe. PLoS One. 2015;10(12):e0144057. doi: 10.1371/journal.pone.0144057. [DOI] [PMC free article] [PubMed] [Google Scholar]
- 15.Grimsrud A, Barnabas RV, Ehrenkranz P, Ford N. Evidence for scale up: the differentiated care research agenda. J Int AIDS Soc. 2017;20(Suppl 4):22024. doi: 10.7448/IAS.20.5.22024. [DOI] [PMC free article] [PubMed] [Google Scholar]
- 16.World Health Organization. Consolidated Guidelines on the use of antiretroviral drugs for treating and preventing HIV infection: recommendations for a public health approach. Genevea, Switzerland: World Health Organization; 2013. http://www.who.int/hiv/pub/guidelines/arv2013/download/en/ [PubMed] [Google Scholar]
- 17.Ford N, Stinson K, Gale H, et al. CD4 changes among virologically suppressed patients on antiretroviral therapy: a systematic review and meta-analysis. J Int AIDS Soc. 2015;18(1):20061. doi: 10.7448/IAS.18.1.20061. [DOI] [PMC free article] [PubMed] [Google Scholar]
- 18.Lecher S, Ellenberger D, Kim AA, et al. Scale-up of HIV Viral Load Monitoring–Seven Sub-Saharan African Countries. Morb Mortal Wkly Rep. 2015;64(46):1287–1290. doi: 10.15585/mmwr.mm6446a3. [DOI] [PubMed] [Google Scholar]
- 19.Lecher S, Williams J, Fonjungo PN, et al. Progress with Scale-Up of HIV Viral Load Monitoring – Seven Sub-Saharan African Countries, January 2015-June 2016. MMWR Morb Mortal Wkly Rep. 2016;65(47):1332–1335. doi: 10.15585/mmwr.mm6547a2. [DOI] [PubMed] [Google Scholar]
- 20.Lesotho Ministry of Health and Social Welfare. National Guidelines for HIV & AIDS Care and Treatment. Maseru, Lesotho: Lesotho Ministry of Health and Social Welfare; 2010. [Google Scholar]
- 21.Botswana Ministry of Health. Botswana National HIV/AIDS Treatment Guidelines: 2008 version. Gaborone, Botswana: Botswana Ministry of Health Department of HIV/AIDS Prevention and Care; 2008. [Google Scholar]
- 22.Botswana Ministry of Health. Botswana National HIV & AIDS Treatment Guidelines. Gaborone, Botswana: Botswana Ministry of Health; 2012. [Google Scholar]
- 23.Swaziland Ministry of Health and Social Welfare. Swaziland Paediatric HIV/AIDS Treatment Guidelines. Mbabane, Swaziland: Kingdom of Swaziland Ministry of Health and Social Welfare; 2006. [Google Scholar]
- 24.Swaziland Ministry of Health and Social Welfare. National Guidelines for Antiretroviral Treatment and Post Exposure Prophylaxis for Adults and Adolescents. Mbabane, Swaziland: Kingdom of Swaziland Ministry of Health and Social Welfare; 2006. [Google Scholar]
- 25.Swaziland Ministry of Health. Swaziland Integrated HIV Management Guidelines. Mbabane, Swaziland: Kingdom of Swaziland Ministry of Health; 2015. [Google Scholar]
- 26.Mesic A, Fontaine J, Aye T, et al. Implications of differentiated care for successful ART scale-up in a concentrated HIV epidemic in Yangon, Myanmar. J Int AIDS Soc. 2017;20(Suppl 4):21644. doi: 10.7448/IAS.20.5.21644. [DOI] [PMC free article] [PubMed] [Google Scholar]
Associated Data
This section collects any data citations, data availability statements, or supplementary materials included in this article.