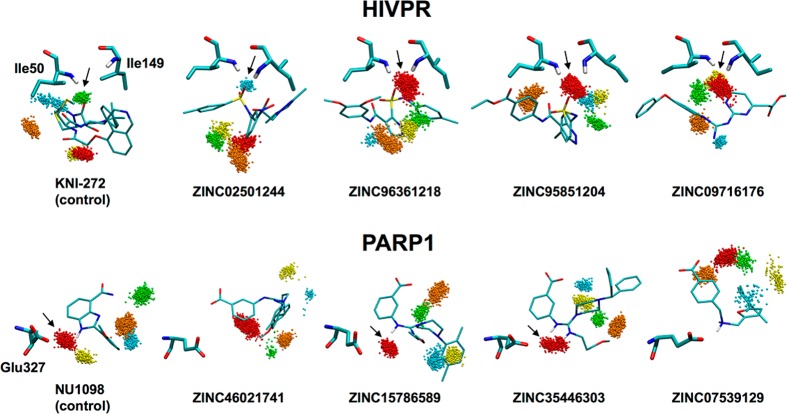
Figure 16.
Solvent patterns for predicted coordinating compounds in HIVPR (top) and PARP1 (bottom) derived from triplicate MD ensembles (3 × 1000 frames each) color-coded by population (S1 red > S2 orange > S3 yellow > S4 green > S5 blue). Key residues for HIVPR (Ile50, Ile149) and PARP1 (Glu327) in thick lines with ligands in thin lines. Arrows indicate the expected water sites (oxygen atoms only).

