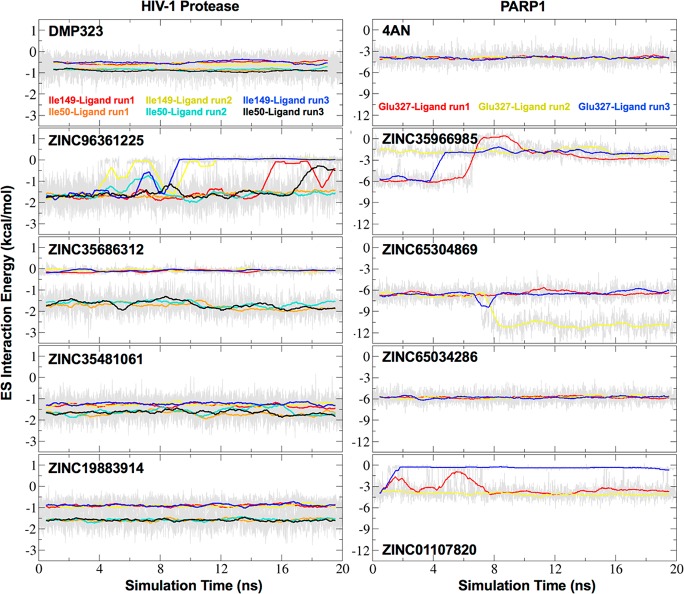
Figure 18.
ES interaction energy (kcal/mol) between docked candidates and control ligands and key protein residues in HIVPR (Ile50, Ile149) or PARP1 (Glu327) versus time. Running block averages (50 frame blocks) plotted in colored lines with raw fluctuations in gray for three independent 20 ns MD simulations each.

