Abstract
Overlapping genes across high-grade squamous intraepithelial lesions (CIN2 and 3) and cancer may serve as potential biomarkers for this progressive disease. Differentially expressed genes (DEGs) of dysplastic (CIN2 and CIN3) and cancer cells were identified by microarray data analysis. Gene interaction network was constructed using the 98 common DEGs among the dysplastic and cancer cells and analysed for the identification of common modules, hubs and significant motifs. Two significant modules and 10 hubs of the common gene interaction network, with 125 nodes and 201 edges were found. DEGs namely NDC80, ZWINT, CDC7, MCM4, MCM2 and MCM6 were found to be common in both the significant modules as well as the hubs. Of these, ZWINT, CDC7, MCM4, MCM2 and MCM6 were further identified to be part of most significant motifs. This overlapping relationship provides a list of common disease related genes among pre-cancerous and cancer stages which could help in targeting the proliferating cancerous cells during onset. Capitalizing upon and targeting Minichromosome maintenance protein complex - specifically the MCM2, MCM4 and MCM6 subunits, ZWINT and CDC7 for experimental validation, may provide valuable insights in understanding and detection of progressing cervical neoplasia to cervical cancer at an early stage.
Introduction
Cervical cancer has been reported to be the second deadliest cancer in women worldwide1. Most cases of cervical cancer are caused due to infection with human papillomavirus (HPV)2. Cervical cancer is preceded by a long phase of morphological alteration in cervical cells known as cervical intra-epithelial neoplasia (CIN), which is further characterized as mild (CIN1), moderate (CIN2) and severe (CIN3) cervical dysplasia and finally leading to cervical cancer. Papanicolaou test, also known as Pap smear test is mostly employed for the screening and diagnosing of cervical neoplasia cells3. However, the Pap test is entirely dependent on manual cytological screening and visualization of de-shaped, transformed and altered cervical cells, resulting in high false negative and false positive rates4.
Most of the techniques utilized for detection of cervical cancer are visual in nature with cervicography being fairly common5,6. Early stages of neoplasia have minimal cytological and histological changes and mostly revert back to normal state on their own. So, earmarking the overlapping genes that express differentially at late stages of neoplasia and cancer may be a better approach. Utilization of biomarkers in cervical histology and cytological examination has been shown to overcome false positive and false negative issues. Biomarkers such as Marker Of Proliferation Ki-67 (Ki-67), p16IN4a, a tumor suppressor protein in humans encoded by CDKN2A gene and BDProExC, a recently developed immunocytochemical assay that targets the expression of topoisomerase II-alpha and minichromosome maintenance protein-27 have been suggested as biomarkers for improving the clinical performance of cervical cancer screening3. Additionally, HPV L1 Capsid protein and Sirtuin, a nicotinamide adenine dinucleotide (NAD+)-dependent histone deacetylase has been proposed as biomarkers for estimating the progression of CIN8,9.
The progression and development of complex diseases such as cancer may be caused due to the interaction of a group of correlated molecules, rather than the malfunctioning of an individual molecule (gene or protein). Hence, analysis of interaction network and identification of network biomarkers becomes critical to isolating disease specific biomarkers for monitoring disease development and progression10. Further, network analysis eschews probabilistic measures which results in a more direct identification.
Various gene-based bioinformatics approaches including interacting genes, proteins encoded by genes and module analysis of networks have been employed, for revealing various disease progression patterns and mechanisms11. In this study, a network was constructed based on gene-gene interaction information of the common DEGs among the CIN2, CIN3 and cancer and analyzed for the presence of overlapping genes, common functional modules and crucial pathways. This was achieved by identifying hub genes, significant modules, important motifs and relationship among various pre-cancerous and cancerous stage gene sets. The objective of the study was to find efficacious genes responsible for the progression of CIN which may be utilized as prospective biomarkers for early detection of cervical cell neoplasia.
Results
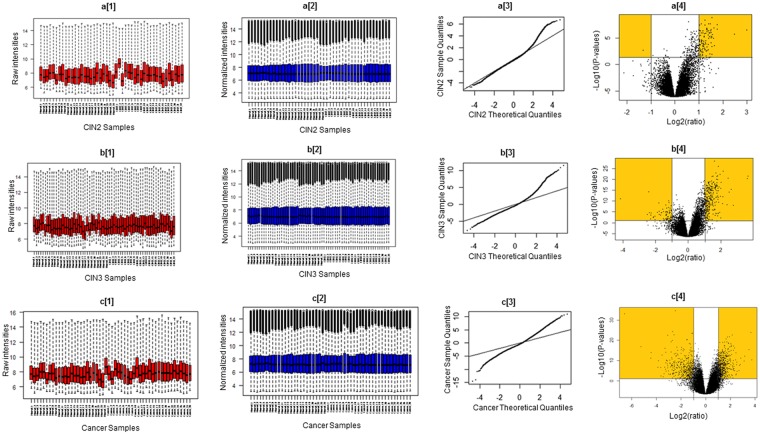
Gene expression profiling of chip dataset GSE63514, which included 24 samples for normal, 22 and 40 samples for pre-malignant stages, namely CIN2 and CIN3 respectively and 28 cervical cancer samples, was utilized for finding the crucial genes involved in the progression of disease. Noise and error emanating from manual faults in the dataset were corrected and normalized by RMA algorithm. Processed data was further scrutinized to extract DEGs of CIN2, CIN3 and cervical cancer in Affy package of R, considering the cutoff criteria of adjusted p-value < 0.05 and fold change >2. A total of 111, 278 and 660 upregulated DEGs were found in CIN2, CIN3 and cancer respectively in comparison to normal cervical cells. QQ plots and volcano plots for CIN2, CIN3 and cancer genes are shown in Fig. 1.
Figure 1.
Raw intensity plot for the CIN2, CIN3 and cancer samples (a[1], b[1] and c[1] respectively). Normalized intensity plot for CIN2, CIN3 and cancer samples (a[2], b[2] and c[2] respectively). Quantile-quantile plot for CIN2, CIN3 and cancer samples (a[3], b[3] and c[3] respectively). Volcano plot for CIN2, CIN3 and cancer samples (a[4], b[4] and c[14 respectively).
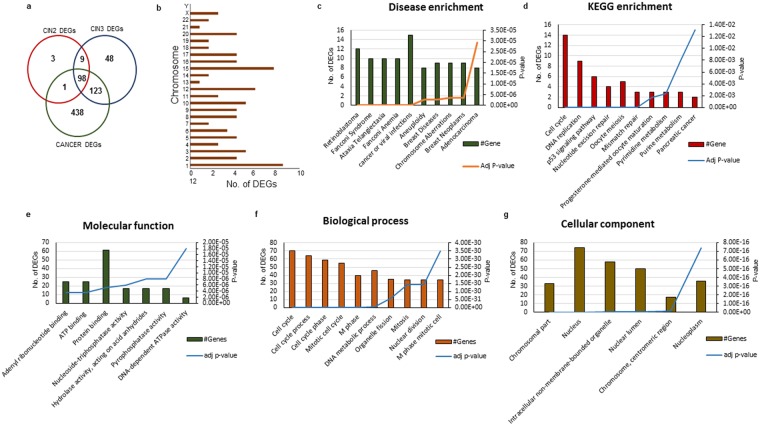
Overlapping DEGs among the three gene sets of CIN2, CIN3 and cancer were identified. 107 differentially expressed genes were found to be overlapping among CIN2 and CIN3. 221 DEGs were found to coincide with CIN3 and cancer. A total of 98 DEGs were observed to be commonly overexpressed among in CIN2, CIN3 and cancer stages as depicted in Fig. 2(a).
Figure 2.
(a) Venn diagram representing the overlapping upregulated DEGs among the CIn2, CIN3 and cancer. (b) Location of upregulated DEGs on different chromosomes. Disease enrichment, KEGG enrichment, molecular function, biological process and cellular component of upregulated DEGs (c–g respectively) considering adj p-value < 0.05.
A larger fraction of DEGs were found to be located on chromosome number 1, 3, 10, 12 and 15 (Fig. 2(b)), present in nucleus and were protein binding in nature. The DEGs were involved in significant process of cell cycle, mitotic processes, DNA metabolic process, organelle fission, mitosis and nuclear division. The Kyoto Encyclopedia of Genes and Genomes (KEGG) pathway enrichment of DEGs revealed their association with cell cycle, DNA replication, p53 signaling and oocyte meiosis pathways. Disease enrichment analysis revealed that substantial proportion of the DEGs were linked to cancer and viral infections.
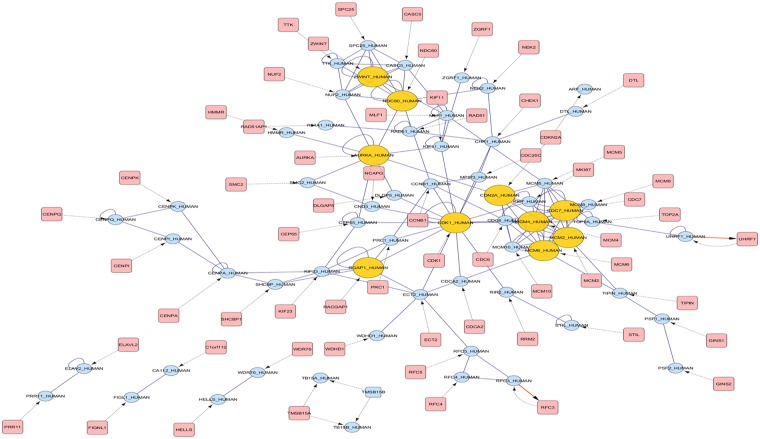
Gene-gene interaction network for the common DEGs among CIN2, CIN3 and cancer was constructed and visualized in Cytoscape. The interaction network had 125 nodes and 201 edges, which was then analyzed for its topology, hubs, modules and motifs.
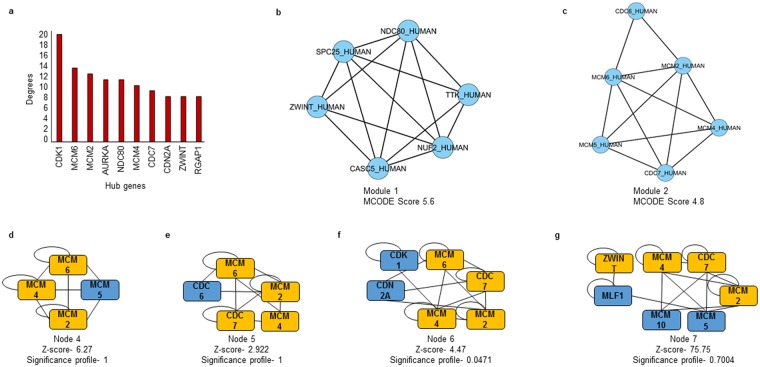
Functionally related significant modules from the common sub-network were mined with MCODE considering the MCODE score ≥4 and number of nodes ≥6. Two significant modules with MCODE score 5.6 (6 nodes, 14 edges) and 4.8 (6 nodes, 12 edges) were found as depicted in Fig. 3, which were verified by ClusterOne (Clustering with overlapping Neighborhood Expansion) plug-in of Cytoscape. It has been shown that that the average connection degree of disease related genes are considerably higher than the average degree of overall human interactome depicting their participation in complex functional processes11. CDK1 was found to exhibit maximum degree in the network. Other hub genes were MCM2, MCM6, AURKA, NDC80, MCM4, CDC7, CDN2A, ZWINT and RGAP1.
Figure 3.
BisoGenet network representing the interaction of genes, their translational product and regulation. The hub genes are represented in yellow circles while the genes are represented in blue circles and proteins in pink squares.
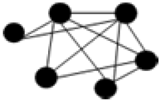
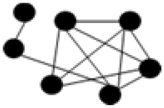
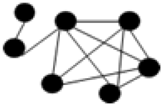
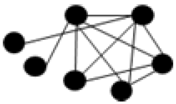
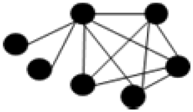
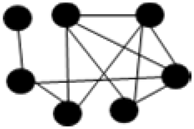
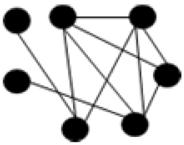
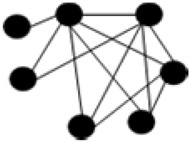
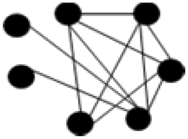
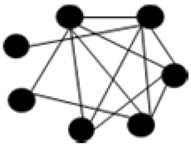
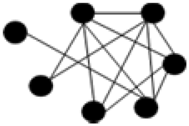
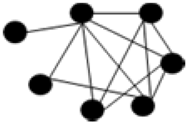
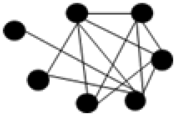
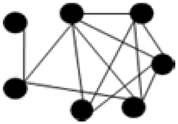
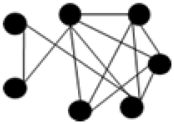
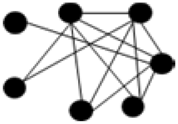
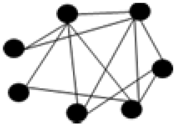
To solve the complicated gene-gene interaction network, network motifs were found out using Motif Discovery plug-in of Cytoscape. Network motifs are small connected sub-network patterns, which are expressed in higher frequencies in a network than would be expected for a given random network. These motifs are noticeably overrepresented and describe definite crucial functional aspects12. The statistical significance of the extracted motifs was calculated using z-score and standard significance profile. The motifs were ranked on the basis of Significance profile (SP) score. The motifs with 4, 5, 6 and 7 nodes and highest SP score (Fig. 4) were considered for further investigation as shown in Table 1. The common genes among the significant modules, hubs and the motifs with highest SP score were, namely MCM2, MCM6, MCM4, CDC7 and ZWINT. These five genes were finally proposed as the biomarkers for CIN progression to cervical cancer.
Figure 4.
(a) Hub genes of the interaction network with their connectivity degrees. Two significant modules of the interaction network with score 5.6 and 4.8 (b,c respectively). Most significant motifs with node 4, 5, 6 and 7 with highest SP scores (d–g respectively).
Table 1.
Significant motifs with their z-score and significance profiles.
| Motif pattern | Motif | z-score | Significance profile |
|---|---|---|---|

|
0111101111011110 | 6.27 | 1 |

|
0111110111110101110011000 | 2.922 | 1 |

|
011111101110110110111000111000100000 | 2.790 | 0.029407115 |

|
011111101110110110111001111000100100 | 15.00 | 0.158102767 |

|
011110101110110110111001111000110000 | 4.47 | 0.063399209 |
|
011111101111110110111000111000110000 | 5.750 | 0.047114625 |
|
0111100101110011011001110010111000000010010000010 | 75.75 | 0.700390184 |
|
0111110101110011011001110000111000010000010000010 | 12.85 | 0.118812064 |
|
0111110101110111011001110000111000010000000100000 | 5.3 | 0.049004198 |
|
0111111101110011011001110000111000010000001000000 | 5.50 | 0.050853413 |
|
0111100101110011010101110000110001000101010000010 | 3.05 | 0.028200529 |
|
0111100101110011011001110010111000100010000000100 | 39.5 | 0.365219964 |
|
0111111101111011011001110000111000011000001000000 | 8.833 | 0.081670581 |
|
0111100101110011011001110011111000000010000001000 | 56.00 | 0.517780202 |
|
0111110101110111011001110010111000010010000100000 | 2.985 | 0.027077131 |
|
0111110101111011011001110001111000111100000001000 | 26.00 | 0.240397951 |
|
0111111101110011011001110010111000010010001000000 | 3.5 | 0.032361263 |
|
0111110101110011011001110011111000010010000001000 | 9.3 | 0.085988498 |
|
0111110101110011011001110010111000010010010000010 | 2.22 | 0.020526287 |
|
0111110101110011011001110001111000010000010001010 | 11.00 | 0.101706825 |
|
0111110101111011011011110000111000011000000010000 | 4.25 | 0.039295819 |
|
0111111101110111011001110010111000010010001100000 | 5.00 | 0.046230375 |
The regulatory elements of the proposed biomarkers MCM2, MCM6, MCM4, CDC7 and ZWINT were extracted using DiRE (distant regulatory elements of co-regulated genes). 6 potential regulatory elements including 3 intergenic, 2 introns and 1 promoter were found regulating the proposed biomarkers on chromosome 1, 2, 8 and 10. Additionally, 51 transcription factors (TFs) were found to be regulating the proposed biomarkers. Most significant TFs being the RSRFC2, AMEF2, TBP, CEBPGAMMA and PXR. A list of regulatory elements for the proposed biomarkers is presented in Table 2.
Table 2.
List of regulatory elements for the proposed markers.
| Regulatory element | Type | Score | Locus | Gene | Candidate transcription factor binding sites |
|---|---|---|---|---|---|
| chr1:91771706–91772840 | Intergenic | 4.135 | chr1:91643029–91920542 | CDC7 | HNF3ALPHA, HNF4_DR1, HNF4ALPHA, AMEF2, RSRFC4, HMEF2, AML, PEBP, AML1, STAT6, FREAC2, FOXO3, CREBATF, CHOP, PXR, E2F1DP1RB, E2F1DP1, E2F4DP1, TBX5, RFX1, PAX3, RFX1, STAT3, RBPJK, LXR_DR4, MYOGNF1, IK1, STAT6, XPF1, RFX1, BACH2, CDPCR3HD, ACAAT |
| chr1:91919420–91920093 | Intergenic | 1.633 | chr1:91643029–91920542 | CDC7 | STAT4, TBP, LHX3, HMEF2, AMEF2, TBP, CHX10, FOXD3, TBP, CEBPGAMMA, POU1F1, TBP, RSRFC4, CMYB, PXR |
| chr10:57027586–57028282 | Intergenic | 0.26 | chr10:56789214–58787407 | ZWINT | GC, TBP, PAX3, PITX2, TCF4, MTATA, CLOX, TAL1BETAE47, TAL1BETAITF2, GZF1, MTATA, DBP |
| chr2:136325765–136325950 | Intron | 0.016 | chr2:136311296–136380628 | MCM6 | ATF4 |
| chr2:136350550–136350647 | Promoter | 1.318 | chr2:136311296–136380628 | MCM6 | E2F1DP1RB, E2F1DP1, E2F1DP2, E2F4DP1, E2F4DP2, E2F1DP1RB, E2F1DP1, E2F1DP2, E2F4DP1, E2F4DP2 |
| chr8:49050687–49050827 | Intron | 1.251 | chr8:49034582–49083547 | MCM4 | SOX9_B1, CEBPGAMMA, |
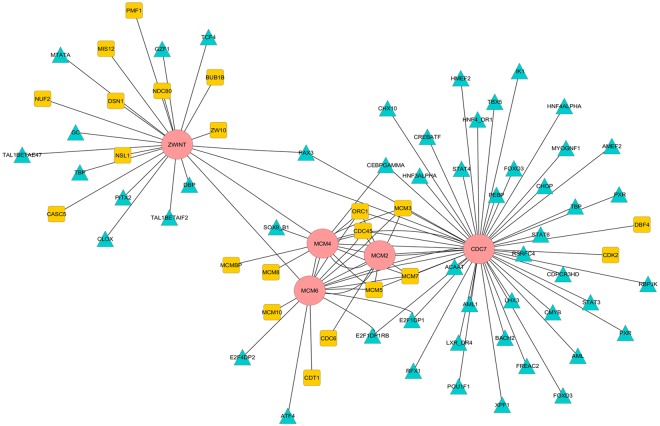
The interacting proteins of the proposed biomarkers were found using Search Tool for the Retrieval of Interacting Genes/Proteins (STRING). The 5 proposed biomarkers were found to be interacting with each other except the interaction of MCM2 with ZWINT. CDC7 has the largest number of transcription factor regulating the gene as depicted in Fig. 5.
Figure 5.
Regulatory network constructed using the proposed biomarkers, their regulating transcription factors and the interacting proteins. The proposed biomarkers are represented in pink color. Interacting protein are depicted in yellow squares and the regulating transcription factors are depicted in blue triangles.
Heatmap for the finalized biomarkers namely MCM2, MCM4, MCM6, CDC7 and ZWINT in normal samples, CIN2, CIN3 and cancer samples is depicted in Fig. 6. The expression intensities of these genes were observed to be increasing gradually for CIN2, CIN3 and cancer when compared to normal healthy cervical cells.
Figure 6.
Heatmap representing the expression intensities of the five genes MCM2, MCM6, MCM4, CDC7 and ZWINT.
Additionally, for cross validating the proposed biomarkers, another GEO microarray dataset GSE64217 (https://www.ncbi.nlm.nih.gov/geo/query/acc.cgi?acc=GSE64217) was used. The validation dataset included 2 samples for normal cervical cells, 2 samples for CIN (grade 2–3) cell samples and 2 samples for cervical cancer. The DEGs were extracted considering the cutoff criteria of adj p-value < 0.05 and FC >2. 2676 DEGs for CIN (grade 2–3) and 2075 DEGs for cervical cancer were extracted. 1105 DEGs were found to be overlapping between CIN (grade 2–3) and cancer. The adj P-value (FDR) and logFC of the proposed biomarkers in the validation set in depicted in Table 3.
Table 3.
Adj p-values (FDR) and logFC of proposed biomarkers in validating dataset.
| Biomarkers | CIN (grade 2–3) | Cervical Cancer | ||
|---|---|---|---|---|
| FDR | logFC | FDR | logFC | |
| MCM2 | 0.00892 | 4.795 | 0.0143 | 3.14 |
| MCM4 | 0.0089 | 3.175 | 0.0143 | 3.7 |
| MCM6 | 0.0119 | 1.857 | 0.0176 | 1.56 |
| CDC7 | 0.00952 | 2.494 | 0.0147 | 2.03 |
| ZWINT | 0.016 | 2.214 | 0.0148 | 3.16 |
The overlapping DEGs were further mapped in gene-gene interaction network using BisoGenet in Cytoscape to analyze for significant hubs and modules. The BisoGenet network comprised of 1105 nodes and 4426 edges. The proposed biomarkers were found to be the significant hubs with larger degrees in the network with MCM2 exhibiting the degree of 86, MCM4 exhibiting the degree of 22, MCM6 exhibiting the degree of 23, CDC7 exhibiting the degree of 15 and ZWINT exhibiting the degree of 20. The biomarkers were also the part of significant modules with score 5.455, 5.2 and 3.143 as depicted in Table 4.
Table 4.
List of significant modules exhibiting the proposed biomarkers.
| Module | Nodes | Egdes | Score | Genes |
|---|---|---|---|---|
| 1 | 23 | 60 | 5.455 | CHTF18, CENPK, RPA1, CENPU, CDK2, RFC3, MCM5, GMNN, MCM4, MCM6, RFC5, MCM7, PRC1, CCNA2, RFC4, PLK1, ORC1, CDC6, CENPN, TIPIN, EZH2, CENPQ, DDX3X |
| 2 | 16 | 39 | 5.2 | PCNA, SPC24, ORC6, NDC80, MCM3, CDC20, DSN1, CDC7, CDC45, CDT1, NUF2, POLA1, SPC25, ZWINT, SKP2, BUB1 |
| 3 | 15 | 22 | 3.143 | LIN9, MCM2, TFDP2, FOXM1, PRKDC, MKI67, BRCA1, RBL1, RPS7, CBX5, HMMR, TPX2, FANCD2, WEE1, UBE2T |
In order to rank and screen the significant genes for diagnosis of cancer, random forest approach can be used13. After processing the data and extracting common genes among CIN2, CIN3 and cancer, 116 probe ids corresponding to 98 common genes dataset were trained by Random Forest (RF) method to validate the proposed biomarkers. The importance of each gene was calculated, ranked and the smallest set of genes was extracted. Importance variables index was used as indicator to rank the variables based on their significance in influencing the response.
The importance of individual variable to the model is evaluated to find the subset of variables that are more important than the rest. This method measures the amount each variable improves the split criterion. Decision tree tries to maximize this quantity when they select variables to put as nodes in the tress. Three out of five, i.e. MCM2, MCM4 and CDC7 was found to be the smaller subset with variable rank less than 30. Importance of individual variable and confidence in class prediction plots are represented in Supplementary Figs S1 and S2 respectively.
Additionally, the differential probes for CIN2 with normal cells, CIN3 with normal cells and cervical cancer with normal cells were implemented in bagged decision tree and validated. Four out of five genes viz. MCM4, MCM6, CDC7 and ZWINT were validated for CIN2. 3 out of 5 viz. MCM2, CDC7 and ZWINT for CIN3 and 2 out of 5 viz. MCM2 and MCM6 for cancer were validated.
Discussion
Understanding the progression of disease is a complex process. An integrative approach is required for the identification of biomarkers for this progressive disease. In this study, we constructed a gene-gene interaction network of the DEGs common among HSIL and cancer cells and analyzed the network for significant modules, hubs and motifs. The proposed biomarkers responsible for the progression of CIN to cancer were further analyzed for their interacting proteins and their regulatory genes. All of the five proposed biomarkers, namely MCM2, MCM4, MCM6, CDC7 and ZWINT were found to interact with each other except the interaction of MCM2 with ZWINT. Additionally, the expression of the proposed biomarkers were found to be regulated by number of transcription factors. Nine of the most important transcription factors were found to be regulating CDC7. Moreover, a gradual increase in the expression of five proposed biomarkers in CIN2, CIN3 and cancer was also observed.
Six related Minichromosomal maintenance Complex (MCM) proteins (2–7) for hetro-hexamer form the pre-replication complex. The overabundance of the most significant proteins in MCM complex is called MCM paradox. The elevation or depletion of MCM level causes genomic instability and consequently causes cancer14.
MCM2 (Minichromosomal maintenance Complex Component 2), is crucial for DNA replication and limiting replication in per cell cycle in eukaryotic cells15. Previous studies have shown that overexpression of MCM2 can be utilized to increase the diagnosis of CIN and squamous cell carcinoma (SCC)16,17. Moreover, a cocktail of MCM2 and TOP2A, p16INK4 and Ki-67 has been suggested as biomarkers for better diagnosis of CIN lesion18.
MCM4 along with MCM3 has been reported to be highly expressed in cervical squamous cell carcinoma by immunochemistry. MCM4 is the essential gene for DNA replication in eukaryotes. The expression of MCM2, MCM4 and MCM6 was found to be increased in breast cancer19. Additionally, the overexpression of MCM6 is found in mantle cell lymphoma, prostate cancer, oral squamous cell carcinoma, esophageal neoplasm, renal cancer, thyroid cancer, breast cancer, endometrial cancer and prostate cancer20.
CDC7 (Cell Division Cycle 7), is an important gene, found highly expressed in a number of cancers including colorectal cancer. CDC7 is a widely expressed serine/threonine kinase which is implicated in cell division, cell cycle, checkpoint and cancer progression mechanism21. Studies have shown the knockdown of CDC7 in Hela cervical cancer cell line22. Additionally, the overexpression of CDC7 has been verified in various types of cancers including central nervous system cancer, colon cancer, lung cancer, leukemia, kidney cancer, ovary cancer, prostate cancer and breast cancer23.
ZW10 Interacting Kinetochore (ZWINT) Protein, is a protein coding gene that is found to be involved into kinetochore function. This Protein is indispensable for the homologous chromosome segregation during meiosis. It has been shown that the knockdown of ZWINT accelerates the meiosis, thus leading to the misalignment of chromosome and causing aneuploidy24. The overexpression of ZWINT was visible in castration-resistant prostate cancer25.
These proposed biomarkers are regulated by large number of transcription factors. These transcription factors are found to be involved in apoptosis, cell differentiation and oncogenesis. RSRFC4 is the allele of MEF2 (Myocyte Enhancer Factor 2A) gene. RSRFC4/MEF2 transcription factor has a major role in cell apoptosis, differentiation, proliferation, shape, migration and metabolism. Altered MEF2 activity plays a noteworthy role in numerous cancer types specifically ovarian cancer, lung cancer, uterine cancer and stomach cancer26. TBP, TATA-box binding protein associated factors compose the RNA polymerase II initiation factor. It contributes the regulation of dedifferentiation states in ovarian cancer27. Additionally, it has been proven that the TATA binding proteins contribute to a variety of human cancers including colorectal cancers28. Literatures propose the CEBP GAMMA, CCAAT/Enhancer Binding Protein Gamma as an antioxidant regulator that controls redox homeostasis in normal and cancerous cells29.
Pregnane X receptor (PXR) regulates carcinogenesis and cell proliferation in female reproductive tissues30. Anti-apoptotic role of PXR is well recognized in human colon cancer31. PXR is found to be significant in drug resistance of cancer cells and its role is very well identified in several cancers - especially colon cancer, esophageal cancer, liver cancer and gynecological oncology including endometrial, ovarian and breast cancers32.
Conclusion
Pre-cancerous and cancerous stage gene expression data were utilized for finding differentially expressed gene. Common DEGs among pre-cancer and cancer stage were further utilized for the construction of an interactive network. Analyzing the interaction network for modules, hubs and motifs revealed the dependence of entire system and disease progression on a few genes. The common interaction network analysis revealed the common mechanisms involved in cervical cancer progression. Five genes namely ZWINT, CDC7, MCM4, MCM2 and MCM6 are proposed from the comprehensive computational analysis which gets affected in neoplasia stage and are responsible for the disease progression. These genes may also serve as prospective biomarkers for prognosis of the disease in early stages. Proposed genes for the early detection of cervical cancer may be further experimentally validated to gain insights into the mechanism of disease progression.
Methods
This study aimed at identifying potential genes that play a significant role in the progression of cervical cells from pre-cancerous stage to cancerous stage.
Dataset
The raw microarray data was retrieved from Gene Expression Omnibus (GEO)33 (https://www.ncbi.nlm.nih.gov/geo/) for identification of differentially expressed genes. The chip dataset GSE6351434 included 24 samples for normal, 22 and 40 samples for pre-malignant stages, namely CIN2 and CIN3 respectively and 28 cervical cancer samples. Gene expression profiling of pre-malignant and cancer samples was implemented using Affymetrix Human Genome U133 plus 2.0 Array chips.
Screening differentially expressed genes of CIN2, CIN3 and cancer
Preprocessing and normalization of raw microarray data were performed to remove noise from the biological data. Robust Multiarray Averaging (RMA)35 was employed to normalize and summarize the expression dataset. Further, exploration of the normalized dataset was carried out by utilizing linear modeling capabilities of the Affy package of R36. Benjamini-Hochberg37 method was used to correct multiple hypotheses testing to obtain the adjusted p-values. Adjusted p-value < 0.05 and fold change >2 were used as delineating parameters for the identification of differentially expressed genes. To visualize the considerable discrepancy between normal versus pre-cancerous and cancerous genes, QQ plots and volcano plots were generated.
Enrichment analysis of DEGs
Gene Ontology (GO), pathway enrichment and disease enrichment analysis of common DEGs among CIN2, CIN3 and cancer cells were performed to discern their implications using WebGestalt38 tool. This tool clusters information from numerous public resources to contribute in recognition of biological processes, related cellular components, molecular functions and biological pathways. The cutoff criteria of adjusted p-value < 0.05 and number of genes >2 was utilized for the enrichment analysis.
Network construction
Common DEGs among the mined upregulated DEGs of CIN2, CIN3 and cancer were mapped to gene-gene interaction network in BisoGenet39. BisoGenet is a cytoscape plugin that searches the molecular interactions from well-known interaction databases including Database of Interacting Proteins (DIP), Biological General Repository for Interaction Datasets (BIOGRID), Human Protein Reference Database (HPRD), Biomolecular Interaction Network (BIND), Molecular Interaction Database (MINT) and INTACT.
Hubs and common modules identification
Top 10 hub genes of the Gene-gene interaction network were extracted by analyzing the networks in Network Analyzer plug-in of Cytoscape40. Additionally, Molecular Complex Detection (MCODE) tool41 was used to find the high modularity clusters from the network with node score cutoff = 0.2, degree cutoff = 2, maximum depth = 100 and k-score = 2. Functional modules with MCODE score ≥4 with nodes ≥6 were considered significant. Also, the clustering analyses of genes were performed using ClusterOne42, a Cytoscape plugin, considering the default parameters of minimum size of 3 nodes, unweighted, node penalty of 2, single pass as merging method and overlap threshold of 0.8 and the mined functional modules from MCODE were verified. P-value cutoff of 0.05 was considered for the significant module extraction.
Key pattern outcome in gene-gene interaction network and significance profile calculation
The network motifs represent the functional entities that are evolutionarily conserved. Hence, motifs with Z-score >2 were extracted from the gene-gene interaction network using motif discovery plugin of Cytoscape. Motif discovery uses the G-tries algorithm43 and allows to find the network motif in fast and friendly manner. The extracted 4, 5, 6 and 7 nodes sub-graphs were carefully examined for the intricate genes. The statistical inference of the extracted motifs was calculated using z-score and significance profile (SP). Significance profile provides the normalized z-score for each network motif. The motif with z-score >2 and p-value < 0.05 were considered significant and incorporated for significance profile calculation. Significance profile (SP) is given by:
where, SP is the significance profile of each motif, m is the network motif, z(mi) is z-score value of each network motif12.
The motifs for subgraphs with nodes 4, 5, 6 and 7 were sorted according to their significance profile for identifying the motif with maximum significance profile.
Regulatory network construction and analysis
Regulatory elements of the screened DEGs common to significant module, hubs and significant motifs were found using Distant Regulatory Elements of co-regulated genes (DiRE)44 tool. This yields the regulatory elements such as enhancers, repressors and silencers for the genes. DiRE is based on enhancer identification method. Additionally, the interacting proteins of the screened DEGs were found using Search Tool for the Retrieval of Interacting Proteins (STRING)45 database. STRING is a database for known and predicted protein-protein interactions which may be physical or functional. These interactions are derived from high-throughput lab experiments, genomic context prediction, co-expression, automated text-mining and previous knowledge in databases. Hence a regulatory network was constructed and analyzed using the interacting proteins and the regulatory elements in Cytoscape.
Furthermore, differential gene analysis of another GEO dataset and Random Forest (RF) method were used to validate the proposed biomarkers. Random forest can be used to rank and select the genes for the diagnosis of cancer13. Quantitative indicators are used to summarize the information and rank the variables. To obtain the smallest set of genes, iterative bagged decision tree was computed at each iteration step for building a new forest by discarding the lowest importance variable. The selected set of genes is the set that yields the smallest OOB i.e. out of bag error rate. Then, all remaining forests that are the least important genes are iteratively tested. The course to eliminate the least significant genes and fit again, continues until the minimum standard deviation (SD) of all forest error rates are zero13.
Electronic supplementary material
Acknowledgements
Computing facilities of Indian Institute of Information Technology are greatly acknowledged.
Author Contributions
S.S. has performed the work and has written the main manuscript text and A.M. supervised the work, assisted in result interpretation and reviewed the paper for grammar and typographical errors.
Competing Interests
The authors declare no competing interests.
Footnotes
Publisher's note: Springer Nature remains neutral with regard to jurisdictional claims in published maps and institutional affiliations.
Electronic supplementary material
Supplementary information accompanies this paper at 10.1038/s41598-018-31187-x.
References
- 1.Zhong P, et al. P16 and Ki-67 expression improves the diagnostic accuracy of cervical lesions but not predict persistent high risk human papillomavirus infection with CIN1. Int J Clin Exp Pathol. 2015;8(3):2979–86. [PMC free article] [PubMed] [Google Scholar]
- 2.Cogliano V, et al. Carcinogenicity of human papillomaviruses. The Lancet Oncol. 2005;6:204. doi: 10.1016/S1470-2045(05)70086-3. [DOI] [PubMed] [Google Scholar]
- 3.Brown CA, et al. Role of protein biomarkers in the detection of high-grade disease in cervical cancer screening programs. J Oncology. 2012;2012:289315. doi: 10.1155/2012/289315. [DOI] [PMC free article] [PubMed] [Google Scholar]
- 4.Mehta V, Vani V, Balachandran C. Pap smear. Indian J Dermatol. 2009;75:214. doi: 10.4103/0378-6323.48686. [DOI] [PubMed] [Google Scholar]
- 5.Baldauf JJ, Dreyfus M, Ritter J, Meyer P, Philippe E. Cervicography. Acta Cytol. 1997;41(2):295–301. doi: 10.1159/000332515. [DOI] [PubMed] [Google Scholar]
- 6.Van Niekerk WA, et al. Colposcopy, cervicography, speculoscopy and endoscopy. Acta Cytol. 1998;42:33–49. doi: 10.1159/000331533. [DOI] [PubMed] [Google Scholar]
- 7.Badr RE, Walts AE, Chung F, Bose S. BD ProEx C: a sensitive and specific marker of HPV-associated squamous lesions of the cervix. The American journal of surgical pathology. 2008;32(6):899–906. doi: 10.1097/PAS.0b013e31815bbb69. [DOI] [PubMed] [Google Scholar]
- 8.Norman I, Hjerpe A, Andersson S. High-risk HPV L1 capsid protein as a marker of cervical intraepithelial neoplasia in high-risk HPV-positive women with minor cytological abnormalities. Oncol Rep. 2013;30:695–700. doi: 10.3892/or.2013.2538. [DOI] [PubMed] [Google Scholar]
- 9.Velez-Perez A, Li M, Wang X, Zhang S. Sirtuin1 is a Promising Marker for Predicting Progression of Cervical Intraepithelial Neoplasms to Invasive Carcinoma. Am J Clin Pathol. 2015;44:A300. doi: 10.1093/ajcp/144.suppl2.300. [DOI] [Google Scholar]
- 10.Wu X, Chen L, Wang X. Network biomarkers, interaction networks and dynamical network biomarkers in respiratory diseases. Clinl Transl Med. 2014;3:16. doi: 10.1186/2001-1326-3-16. [DOI] [PMC free article] [PubMed] [Google Scholar]
- 11.Guo L, Du Y, Wang J. Network analysis reveals a stress-affected common gene module among seven stress-related diseases/systems which provides potential targets for mechanism research. Sci Rep. 2015;5:12939. doi: 10.1038/srep12939. [DOI] [PMC free article] [PubMed] [Google Scholar]
- 12.Sehgal M, Gupta R, Moussa A, Singh TR. An integrative approach for mapping differentially expressed genes and network components using novel parameters to elucidate key regulatory genes in colorectal cancer. Plos one. 2015;10(7):e0133901. doi: 10.1371/journal.pone.0133901. [DOI] [PMC free article] [PubMed] [Google Scholar]
- 13.Ram M, Najafi A, Shakeri MT. Classification and Biomarker Genes Selection for Cancer Gene Expression Data Using Random Forest. Iranian Journal of Pathology. 2017;12(4):339–47. [PMC free article] [PubMed] [Google Scholar]
- 14.Das, M., Singh, S., Pradhan, S. & Narayan, G. MCM Paradox: abundance of eukaryotic replicative helicases and genomic integrity. Mol Biol Int. 2014 (2014). [DOI] [PMC free article] [PubMed]
- 15.Zheng J. Diagnostic value of MCM2 immunocytochemical staining in cervical lesions and its relationship with HPV infection. Int J Clin Exp pathol. 2015;8:875. [PMC free article] [PubMed] [Google Scholar]
- 16.Santin AD, et al. Gene expression profiles of primary HPV16- and HPV18-infected early stage cervical cancers and normal cervical epithelium: identification of novel candidate molecular markers for cervical cancer diagnosis and therapy. Virology. 2005;331:269–291. doi: 10.1016/j.virol.2004.09.045. [DOI] [PubMed] [Google Scholar]
- 17.Mukherjee G, Muralidhar B, Bafna UD, Laskey RA, Coleman N. MCM immunocytochemistry as a first line cervical screening test in developing countries: a prospective cohort study in a regional cancer centre in India. Br J Cancer. 2007;96:1107–1111. doi: 10.1038/sj.bjc.6603679. [DOI] [PMC free article] [PubMed] [Google Scholar]
- 18.Yang QC, et al. A cocktail of MCM2 and TOP2A, p16INK4a and Ki-67 as biomarkers for the improved diagnosis of cervical intraepithelial lesion. Pol J Pathol. 2013;64:21–27. doi: 10.5114/pjp.2013.34599. [DOI] [PubMed] [Google Scholar]
- 19.Kwok HF, et al. Prognostic significance of minichromosome maintenance proteins in breast cancer. Am J Cancer Res. 2015;5(1):52. [PMC free article] [PubMed] [Google Scholar]
- 20.Schrader C, et al. Minichromosome maintenance protein 6, a proliferation marker superior to Ki-67 and independent predictor of survival in patients with mantle cell lymphoma. Br J Cancer. 2005;93(8):939. doi: 10.1038/sj.bjc.6602795. [DOI] [PMC free article] [PubMed] [Google Scholar]
- 21.Melling N, et al. Cdc7 overexpression is an independent prognostic marker and a potential therapeutic target in colorectal cancer. Diagn Pathol. 2015;10(1):125. doi: 10.1186/s13000-015-0360-7. [DOI] [PMC free article] [PubMed] [Google Scholar]
- 22.Montagnoli A, et al. Cdc7 inhibition reveals a p53-dependent replication checkpoint that is defective in cancer cells. Cancer Res. 2004;64:7110–7116. doi: 10.1158/0008-5472.CAN-04-1547. [DOI] [PubMed] [Google Scholar]
- 23.Bonte D, et al. Cdc7-Dbf4 kinase overexpression in multiple cancers and tumor cell lines is correlated with p53 inactivation. Neoplasia. 2008;10(9):920IN3–31IN4. doi: 10.1593/neo.08216. [DOI] [PMC free article] [PubMed] [Google Scholar]
- 24.Seo, D. W. et al. Zwint-1 is required for spindle assembly checkpoint function and kinetochore-microtubule attachment during oocyte meiosis. Sci Rep. 5 (2015). [DOI] [PMC free article] [PubMed]
- 25.Urbanucci A, et al. Overexpression of androgen receptor enhances the binding of the receptor to the chromatin in prostate cancer. Oncogene. 2012;31(17):2153. doi: 10.1038/onc.2011.401. [DOI] [PubMed] [Google Scholar]
- 26.Pon Julia, R. & Marco, A. M. MEF2 Transcription Factors: Developmental Regulators and Emerging Cancer Genes. Oncotarget. 7(3), 2297–2312, PMC. Web. 20 July 2017 (2016). [DOI] [PMC free article] [PubMed]
- 27.Ribeiro, J. R. et al. Targeting TBP-Associated Factors in Ovarian Cancer. Front Oncol. 4, 45, PMC. Web. 20 July 2017 (2014). [DOI] [PMC free article] [PubMed]
- 28.Johnson SA, et al. Increased expression of TATA-binding protein, the central transcription factor, can contribute to oncogenesis. Mol Cell Biol. 2003;23(9):3043–51. doi: 10.1128/MCB.23.9.3043-3051.2003. [DOI] [PMC free article] [PubMed] [Google Scholar]
- 29.Huggins CJ, et al. C/EBPγ is a critical regulator of cellular stress response networks through heterodimerization with ATF4. Mol Cell Biol. 2016;36(5):693–713. doi: 10.1128/MCB.00911-15. [DOI] [PMC free article] [PubMed] [Google Scholar]
- 30.Niu Y, et al. Activated pregnane X receptor inhibits cervical cancer cell proliferation and tumorigenicity by inducing G2/M cell-cycle arrest. Cancer Lett. 2014;347(1):88–97. doi: 10.1016/j.canlet.2014.01.026. [DOI] [PubMed] [Google Scholar]
- 31.Zhou J, Liu M, Zhai Y, Xie W. The antiapoptotic role of pregnane X receptor in human colon cancer cells. Mol Endocrinol. 2008;22(4):868–80. doi: 10.1210/me.2007-0197. [DOI] [PMC free article] [PubMed] [Google Scholar]
- 32.Qiao E, Ji M, Wu J, Ma R, Zhang X. Expression of the PXR gene in various types of cancer and drug resistance. Oncol Lett. 2013;5:1093–1100. doi: 10.3892/ol.2013.1149. [DOI] [PMC free article] [PubMed] [Google Scholar]
- 33.Barrett T, et al. NCBI GEO: archive for functional genomics data sets—update. Nucleic Acids Res. 2013;41:D991–D995. doi: 10.1093/nar/gks1193. [DOI] [PMC free article] [PubMed] [Google Scholar]
- 34.Den Boon JA, et al. Molecular transitions from papillomavirus infection to cervical precancer and cancer: Role of stromal estrogen receptor signaling. Proc Natl Acad Sci USA. 2015;112:E3255–64. doi: 10.1073/pnas.1509322112. [DOI] [PMC free article] [PubMed] [Google Scholar]
- 35.Irizarry RA, et al. Exploration, normalization, and summaries of high density oligonucleotide array probe level data. Biostatistics. 2003;4:249–264. doi: 10.1093/biostatistics/4.2.249. [DOI] [PubMed] [Google Scholar]
- 36.Gautier L, Cope L, Bolstad BM, Irizarry RA. Affy-analysis of Affymetrix GeneChip data at the probe level. Bioinformatics. 2004;20:307–315. doi: 10.1093/bioinformatics/btg405. [DOI] [PubMed] [Google Scholar]
- 37.Benjamini, Y. & Hochberg, Y. Controlling the false discovery rate: a practical and powerful approach to multiple testing. Journal of the Royal Statistical Society. J R Statics Soc B., 289–300 (1995).
- 38.Wang J, Duncan D, Shi Z, Zhang B. Web-based gene set analysis toolkit (WebGestalt): Update 2013. Nucleic Acids Res. 2013;41:W77–W83. doi: 10.1093/nar/gkt439. [DOI] [PMC free article] [PubMed] [Google Scholar]
- 39.Von Mering C, et al. STRING: a database of predicted functional associations between proteins. Nucleic Acids Res. 2003;31(1):258–261. doi: 10.1093/nar/gkg034. [DOI] [PMC free article] [PubMed] [Google Scholar]
- 40.Smoot ME, Ono K, Ruscheinski J, Wang PL, Ideker T. Cytoscape 2.8: new features for data integration and network visualization. Bioinformatics. 2011;27:431–432. doi: 10.1093/bioinformatics/btq675. [DOI] [PMC free article] [PubMed] [Google Scholar]
- 41.Bader GD, Hogue CW. An automated method for finding molecular complexes in large protein interaction networks. BMC Bioinformatics. 2003;4:2. doi: 10.1186/1471-2105-4-2. [DOI] [PMC free article] [PubMed] [Google Scholar]
- 42.Nepusz T, Yu H, Paccanaro A. Detecting overlapping protein complexes in protein-protein interaction networks. Nat Methods. 2012;9(5):471–472. doi: 10.1038/nmeth.1938. [DOI] [PMC free article] [PubMed] [Google Scholar]
- 43.Ribeiro, P. & Silva, F. G-tries: an efficient data structure for discovering network motifs. InProceedings of the 2010 ACM Symposium on Applied Computing. ACM, pp. 1559–1566 (2010).
- 44.Gotea, V. & Ovcharenko, I. DiRE: identifying distant regulatory elements of co-expressed genes. Nucleic Acids Res., 10.1093/nar/gkn300 (2008). [DOI] [PMC free article] [PubMed]
- 45.Szklarczyk D, et al. STRINGv10: protein–protein interaction networks, integrated over the tree of life. Nucleic Acids Res. 2014;43(D1):D447–52. doi: 10.1093/nar/gku1003. [DOI] [PMC free article] [PubMed] [Google Scholar]
Associated Data
This section collects any data citations, data availability statements, or supplementary materials included in this article.


