

Abstract
Exosomes carry microRNA biomarkers, occur in higher abundance in cancerous patients than in healthy ones, and because they are present in most biofluids, including blood and urine, can be obtained non-invasively. Standard laboratory techniques to isolate exosomes are expensive, time-consuming, provide poor purity, and recover on the order of 25% of the available exosomes. We present a new microfluidic technique to simultaneously isolate exosomes and preconcentrate them by electrophoresis using a high transverse local electric field generated by ion-depleting ion-selective membrane. We use pressure-driven flow to deliver an exosome sample to a microfluidic chip such that the transverse electric field forces them out of the cross flow and into an agarose gel which filters out unwanted cellular debris while the ion-selective membrane concentrates the exosomes through an enrichment effect. We efficiently isolated exosomes from 1X PBS buffer, cell culture media and blood serum. Using flow rates from 150 µL/hr to 200 µL/hr and field strengths of 100 V/cm, we consistently captured between 60% to 80% of exosomes from buffer, cell culture media, and blood serum as confirmed by both fluorescence spectroscopy and nanoparticle tracking analysis. Our microfluidic chip maintained this recovery rate for more than twenty minutes with a concentration factor of 15 for ten minutes of isolation.
Keywords: exosomes, ion concentration polarization, microfluidics
1. INTRODUCTION
In many instances, diagnosis of cancer requires surgical biopsy of a suspected cancerous region. Surgical biopsies are inherently invasive and therefore pose significant risks to patients. This places a limitation on the frequency with which a region can be sampled to check for cancer, and in some cases, the suspected region may even be surgically inaccessible. Additionally, the tissue sampled by a surgical biopsy tends to be a heterogeneous, rather than a homogeneous, representation of the tissue at large thereby leading to ambiguous conclusions. In contrast, liquid biopsies are non-invasive and a variety of biological fluids, such as blood [1, 2], urine [3], saliva [4], and breast milk [5, 6], provide biomarkers indicative of cancer for both diagnostic and prognostic purposes. Biomarkers include cell-free nucleic acids, such as DNA, messenger RNA (mRNA), and microRNA (miRNA) [7–11], circulating tumor cells [12], and extracellular vesicles [13]. In contrast to surgically-derived tissue samples, liquid biomarkers tend to homogenously represent tumor microenvironments. Therefore, they serve as superior identifiers for cancer diagnosis and prognosis, as well as being more cost effective and patient-friendly.
Of particular note in recent years are nanometer-size extracellular phospholipid bilayer vesicles otherwise known as exosomes. Although the exact size range of exosomes has not been fully resolved, they typically fall within the range of 30 – 150 nm in diameter. They contain proteins on the surface and harbor proteins, mRNA, miRNA, and DNA within. Cells secrete exosomes into the circulatory system, and the exosomes are taken up by adjacent cells and distant cells in other organs. The exact function of exosome function is currently under active investigation and includes altering the extracellular matrix [14, 15], accelerating tumor growth and enhancing metastasis [16–20], imputing drug resistance [21–24], and creating metastatic niches [25–30]. Exosomes form from almost all cell types, and they appear in most types of body fluids such as serum [31, 32], saliva [33], breast milk [34], and urine [35, 36]. Furthermore, the majority of cell-free miRNAs reside within exosomes [37]. This, combined with the fact that the proteins and RNA they carry are specific to the cell of origin, potentially make exosomes and their cargo excellent non-invasive biomarkers [38]. One example of such an exosomal biomarker is miRNA-141, which occurs in prostate cancer patients at expression levels four times higher than that in healthy patients [39]. As another example, Taylor and Gercel-Taylor identified a suite of eight exosomal miRNAs that could potentially act as diagnostic biomarkers for ovarian cancer [31]. Importantly, they concluded that using these biomarkers could potentially differentiate between developing tumors and advanced-stage tumors.
Before analyzing exosomes for useful information, they need to be isolated from their resident media, which is difficult given their small size. The standard method of exosome isolation is ultracentrifugation. The general steps in an ultracentrifugation protocol begin by using submicron filters or low speed centrifugation to remove contaminants such as cell debris, microvesicles, or apoptotic bodies. Subsequently, the exosomes undergo multiple rounds of ultracentrifugation at speeds of 100,000×g or greater to pellet them. Removing the supernatant and then resuspending them in a relatively small volume of buffer produces a concentrated sample useful for investigative purposes [40]. Such high speeds require not only large initial capital costs but also large maintenance and operating costs. In addition to its high expense, ultracentrifugation is a time-consuming and labor-intensive process typically requiring four to six hours of work by a skilled technician or researcher. It is also necessary to culture high volumes (> 100 mL) in order to collect enough exosomes for subsequent experiments. In the end, it still does not produce very pure samples and results in yields of only 5 – 23% [41]. The final exosome sample still suffers from contamination by proteins, and the results tend to be highly variable. Adding a gradient density step, which uses a discontinuous gradient containing different concentrations of sucrose or iodixanol (OptiPrep™), improves the purity of the final sample by separating exosomes from apoptotic bodies, protein aggregates, and nucleosomal fragments based on different flotation densities. However, it adds significantly to the complexity and time required for the process [41–44]. For example, Van Deun et al. found that using an iodixanol gradient reduced protein contamination by more than two-fold, but they also discovered their exosome yield decreased two-fold while ultracentrifugation times increased past twenty hours [44].
An alternative to ultracentrifugation is immunoaffinity capture by magnetic beads and antibody functionalized pillars and packings [31, 45–47]. Immunoaffinity capture works well to isolate exosomes from other fluid components. However, the technique is limited to exosomes with a known antigen. Moreover, the heterogeneity of exosomes produced by cells limits the efficacy of this approach. Studies have revealed that that there is no commonly agreed upon protein that is abundantly expressed on the surface of exosomes derived from diverse origins [48]. Cells release subpopulations of exosomes with unique compositions that elicit a wide range of effects in cells that take them up [49]. Hence, exosome based-diagnostics that use immunoaffinity capture only succeed in isolating a fraction of the exosomes currently present in a patient. Thus, if it is desirable to capture all exosomes, not simply exosomes with a specific antigen, immunoaffinity capture is inadequate. In addition, although the magnetic beads expedite the subsequent analysis of the exosomes, the isolation process is time-consuming and may require more than a day to achieve optimal recovery rates [45].
Yet another isolation technology is commercial precipitation technology like ExoQuick™ and Total Exosome Isolation™. They are attractive because of their simplicity as well as their circumvention of the need to use expensive equipment. However, these kits are still time-consuming as they require overnight incubation. Furthermore, since the reagents in the kits are proprietary, they exhibit contamination from unknown sources leading to discrepancies in their results [44, 50].
Recently, the microfluidics community has started to tackle the problem of exosome isolation. Yang et al. categorized microfluidic isolation techniques into immunoaffinity-based, sized-based, and dynamic microfluidics [51]. Zhao et al. simply transferred the magnetic bead concept to a microfluidic device. They were able to isolate exosomes from 20 µL of blood plasma in 40 min, and they illustrated that exosomes from ovarian cancer patients existed in higher quantities than in healthy control subjects [52]. Vaidyanathan et al. used a combination of immunoaffinity capture and AC dielectrophoresis for the capture of exosomes down to a limit of detection of 2760 exosomes/µL [53]. Chen et al. obtained good purity with their assay as measured by the concentration of RNA per sample volume, but their recovery rates were highly variable ranging from 42 – 94 % [54]. Sized-based microfluidic separations typically rely on microposts inside microchannels thus requiring complex fabrication steps. Wang et al. [55] grew nanowires on their microfluidic posts and captured nanoparticles from 40 – 100 nm while filtering out cells, proteins, and other cell debris. Davies et al. used pressure driven flow and a porous polymer monolith to isolate exosomes directly from blood yet experienced significant contamination by proteins [56]. Dynamic exosome isolation methods rely on a variety of techniques such as electrophoresis, field-flow fractionation, and acoustic waves. Davies et al. demonstrated direct isolation of exosomes from blood using porous polymer monoliths, varying from 100 – 1000 nm in pore size, and electrophoresis with field perpendicular to the flow direction. However, the low electric field strength employed in their study allowed them to recover only 2% of exosomes [56]. Another electrophoretic technique developed by Cho et al. applied a higher electric field across a dialysis membrane to achieve a 65% recovery rate in approximately thirty minutes [57]. An acoustic nanofilter in which ultrasound standing waves were applied orthogonally across a continuous sample flow resulted in exosome recovery rates of up to 80% [58]. The current microfluidic technology for exosome isolation varies greatly in terms of yield, sample volume, throughput and operation or fabrication complexity. There is considerable room for improvement. In particular, an isolation device designed to accommodate subsequent analysis such as lysis and detection would be particularly beneficial.
Here we report a new exosome isolation technique that utilizes microfluidic gel electrophoresis and an ion-selective membrane to simultaneously separate and concentrate exosomes from a continuously flowing sample stream. A syringe pump delivers the liquid exosome-containing sample to a channel in a microchip that is arranged perpendicular to the main channel of the chip, which contains agarose gel. The use of electric field to isolate exosomes is reasonable as the electrophoresis of exosomes is independent of its size, as their dimension is much larger than the Debye layer. However, to achieve high throughput isolation out of flowing sample, a large electric field must be used to overcome the large hydrodynamic drag. For a typical Zeta potential of −12 mV and a high throughput linear flow velocity of 0.01 cm/s (or 300 µL/hr in a typical channel of 2 mm × 0.5 mm dimension), an electric field of approximately 100 V/cm is required. Such a high field is difficult to introduce into a device with high ionic strength buffers, particularly if it is applied in the longitudinal flow direction, as it will lead to Ohmic heating and bubble generation. This is the main issue in previous attempts on electrophoretic isolation.
As in our earlier work [59–61], we use the ion depletion feature of ion-selective membranes to produce a local transverse field that exceeds the required value without introducing excessive Ohmic heating and bubble formation along the entire flow channel. The depletion zone spans across the flowing stream and into the gel to produce a high transverse field with near-DI water ionic strength locally. Any temperature increase due to Ohmic heating by the intense but narrow transverse electric field is rapidly removed by the flowing solution and bubble formation is never observed. As the exosomes pass through the intersection of the two channels, this electric field drives the exosomes into the gel towards a negatively charged cation exchange membrane. As they are macro-co-ions to the membrane, exosomes concentrate at the membrane surface but do not enter the membrane and are hence enriched in a high ionic-strength zone near the surface of the cation-selective membrane [60, 61, 63]. Additionally, the agarose gel possesses pore sizes on the order of 200 – 300 nm [62, 63] and filters out larger components such as cells. Both the gel and the membrane also help prevent bubble formation and the creation of a pH gradient within the channel by segregating the electrodes from contact with the interior of the microfluidic channel.
We demonstrate the operation of our device at a high transverse electric field strength (~100 V/cm) and various flow rates and measure the recovery rate of exosomes and the factor by which they concentrate at the membrane. We corroborate our results using particle tracking measurements and reveal our isolated exosomes are in the range of 60 to 130 nm. We envision our isolation chip as the first section of a larger integrated device which will in turn lyse exosomes and then detect the exosomal miRNA content. Previous work by our group illustrated surface acoustic waves (SAW) could lyse exosomes, and our DNA probe-functionalized ion-selective membrane could detect miRNA down to 2 pM [64]. Our aim is to comprise a fully integrated device for the detection of exosomal miRNA for early cancer diagnosis.
2. MATERIALS AND METHODS
2.1. Materials
10X PBS (pH 7.4) and 50X TAE (pH 8.4) buffers were obtained from Boston Bioproducts and 150 mM sodium phosphate buffer (pH 7.2) from Teknova. Agarose gels were prepared at 1 wt% in 1X TAE using agarose powder from Ominpur and stored as liquids inside an oven maintained at 65 °C. QuikCast polyurethane casting resins (side A and side B) were obtained from TAP Plastics Inc. Acrifix 1R 0192 UV reactive cement was obtained from Evonik Industries while Loctite 3492 light cure adhesive was obtained from Loctite Corporation. Cation-exchange membranes whose fixed negative charge is supplied by organosulfanate groups were provided by Mega a.s (Czech Republic). Carboxyfluorescein succinimidyl ester (CFSE) dye was received from eBioscience.
2.2. Exosome Collection and Labeling
AsPC1 cells were grown in RPMI media with 10% fetal bovine serum under standard conditions. Cell-conditioned media was collected, and exosomes were isolated by two different methods: ultracentrifugation and ExoQuick™. For both protocols, cells were initially spun down at 1,200 rpm for three minutes. The cell debris in the supernatant was spun down at 16,500×g for twenty minutes. For the ultracentrifugation protocol, the exosomes were pelleted from 100 mL supernatant by centrifuging at 120,000×g for seventy minutes. For ExoQuick™, the exosomes were collected from 10 mL of the supernatant from the 16,500×g spin according to the manufacturer’s protocol. A portion of the exosomes isolated using ExoQuick™ were labeled with CFSE dye. The exosomes were resuspended in 1X PBS and incubated at 37 °C for one hour with 10 µM CFSE.
2.3. Chip Fabrication
Microfluidic chips were fabricated in the same fashion as in previous work [60, 64] from 300 µm polycarbonate sheets in a layer-by-layer fashion. The polycarbonate sheets were sandwiched together and heated in an oven at 170 °C to permanently bond them together. The main channel running along the length of the chip was 2 mm width × 30 mm length × 500 µm height. A perpendicular cross-channel for delivering exosome samples intersected the main channel at 7.5 mm from the end of the main channel and 7.5 mm from the ion-exchange membrane. The cross channel possessed the same width and height as the main channel but was 5 mm long on either side of the main channel. Fluid inlets with reservoirs to hold buffer were set at the ends of the channel. A 6.9 mm diameter hole was placed in the center of the main channel to hold the membrane cast. Using resin, a steady frame was made for the membrane to adjust for the size difference between the membrane and the hole designed into the PC chip, while providing a free surface to paste the resin frame to the polycarbonate chip utilizing UV glue. A 1.5 ×1.0 × 0.3 mm3 (l/w/t) cation-exchange membrane was sealed to the bottom of the cast and remained flush with the top of the microfluidic channel. A schematic of the chip is shown in Figure 1a.
Figure 1.
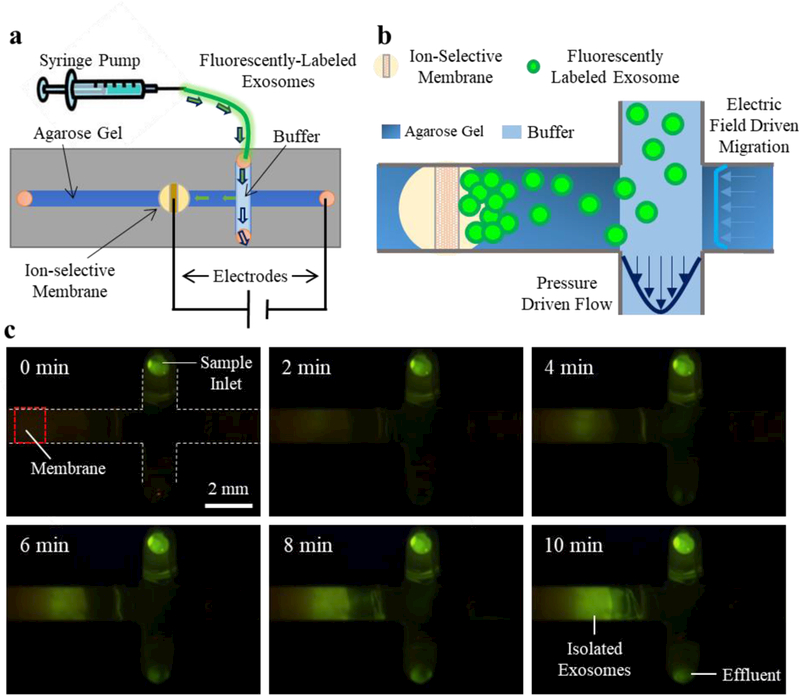
a) Schematic of the overall set-up where a syringe pump drives sample into the microchip. b) A zoomed view of the channels; as the exosomes pass through the intersection of the perpendicular channels, an electric field drives them into the gel where they concentrate at the membrane. c) A view from below the chip of the exosome isolation process with fluorescently-labeled exosomes.
2.4. Isolation of Exosomes by Gel Electrophoresis
Chips were filled with the liquid agarose gel and used after the gel solidified. The gel was removed from the intersection by displacing it with a 1X TAE buffer before it solidified. A gentle buffer injection through the inlet can push the contents of the cross channel towards the outlet and replace the gel with buffer to provide a gel free path for the exosome sample. The membrane and inlet reservoirs were also filled with 1X TAE buffer and replaced every four minutes after the application of the electric potential. Exosomes were loaded into a 1 mL syringe, and a syringe pump delivered them to the chip at rates of 150 or 200 µL/hr, which is the optimum estimated from the electrophoretic velocity of the exosome under the applied field. After thirty seconds of pumping, electrophoresis was started using a Keithley 2400 Sourcemeter as the voltage source and platinum electrodes in the membrane and electrode inlet reservoirs. The field strength for all experiments was 100 V/cm. For experiments where the exosomes were to be analyzed by nanoparticle tracking, gel electrophoresis was typically performed for ten minutes. For the particle tracking measurements, a chip with a removable bottom was used. The gel, from the cross channel to the membrane, was removed and placed in 50 µL 1X TAE. The effluent and the gel were placed into an oven at 70 °C for fifteen minutes. The samples of exosomes collected from the chips were then diluted in 1X TAE between 100 and 5000-fold depending on the original media. They were stored at −20 °C prior to measurement by a Malvern NanoSight NS300. For each nanoparticle tracking sample, there were five runs for sixty seconds each using an injection rate of 30 µL/min.
For exosomes isolated from cell media and blood serum, isolation experiments were conducted with five replicates. Human whole blood and human recovered plasma were purchased from Zen-Bio Inc. (Research Triangle Park, NC, USA). Fresh whole blood and serum was collected in 10 mL heparin-coated Vacutainer tubes and shipped following testing. Upon arrival, the blood and serum were stored at 4 °C prior to use.
Exosome recovery rates were analyzed quantitatively using fluorescently-labeled exosomes. Two flow rates, 150 µL/hr and 200 µL/hr, were analyzed by collecting the effluent at 10 min intervals for a total of 20 min. Fluorescence was measured using a Tecan Infinite M200 Pro.
3. RESULTS AND DISCUSSION
3.1. Overview of Device Operation
We adapted and altered the microfluidic device we previously used for the quantification of nucleic acids by nanoparticle aggregation in references [59] and [60] to the isolation of exosomes. Zeta potential measurements revealed the zeta potential of the exosomes to be −12 ± 3 mV which is comparable with previous measurements from the literature [65]. However, we emphasize the importance of the buffer pH on zeta potential since previous reports indicate zeta potential of bodily components such as red blood cells will change under the influence of pH [66]. The negative electrical charge of the exosomes indicates they can be driven by an electric field as also demonstrated by others [56, 57].
In our present setup, a syringe pump transports a sample of exosomes in 1X PBS buffer to the microfluidic chip. As the exosomes flow through the intersection of the perpendicular channels, the electric field drives migration of the exosomes into the agarose gel towards the membrane. The gel, which possesses pore sizes of approximately 200 – 300 nm [62, 63], prevents large particles such as cells from entering the gel. The continuous flow from the pump eliminates clogging of the gel by washing away these larger particles. The exosomes migrate towards the membrane, but the negative charges on the membrane prevent them from passing through it. The effect creates a region where the exosomes continuously concentrate, thus trapping them inside the gel. Another feature which is essential to our device is the segregation of the electrodes from the microfluidic channel by use of the gel and the membrane. The high potentials used to create the strong electric fields generate a significant amount of bubbles. Both the gel and the membrane prevent these bubbles from entering the microfluidic channel and interfering with the electric field-driven migration of the exosomes. Furthermore, the high potentials create high concentrations of hydrogen and hydroxide ions in the membrane reservoir and in the gel inlet reservoir, respectively. This effect leads to the creation of a powerful pH gradient which could affect the zeta potential of the exosomes and thus their direction of migration. Therefore, it is necessary to exchange the buffer in the reservoirs every few minutes either by replacing the entire solution all at once or by supplying a continuous stream of fresh buffer into the reservoirs. The result of this setup is the isolation and preconcentration of exosomes as illustrated by Figure 1.
3.2. Confirmation of Exosome Isolation
In order to confirm we efficiently captured exosomes within the gel, we compared the contents of the gel and the sample effluent with the initial exosome sample using nanoparticle tracking measurements. Using a nominal electric field strength of 100 V/cm, we pumped exosome sample into the chip at a rate of 150 µL/hr for 10 min. Subsequently, we analyzed the number of exosomes in the sample before isolation, in the gel after isolation, and the effluent by nanoparticle tracking. Figures 2a-c display the results. We obtain an approximate concentration of the total number of exosomes using the known solution volume by summing the concentration of particles at each diameter, in increments of 1 nm, from 0 to 150 nm. Although exosomes typically fall below 150 nm, we include the concentration for particles up to this point to account for possible aggregates composed of multiple exosomes. At 150 µL/hr, based on the measured concentrations and the known volumes of the gel isolation region and the effluent, we achieve a recovery rate of approximately 70%. The recovery rate was estimated by the ratio of (exosomes in gel) / (total amount of exosomes in inlet). It is possible that we may not remove all the exosomes from the gel, so our recovery may be somewhat of an underestimate. Significantly, the concentration measured from the gel is much higher than the concentration measured in the inlet. This clearly demonstrates not only that we capture exosomes within the gel but also that we concentrate them as well. Notably, the size distribution of the sample from the gel displayed in Figure 2b illustrates most of what we capture is around 150 nm or less which is the reported size range for exosomes. The size distributions of the original exosome sample in Figure 2a and the exosomes isolated in the gel in Figure 2b are relatively similar as well. This is clear confirmation of exosome capture.
Figure 2.
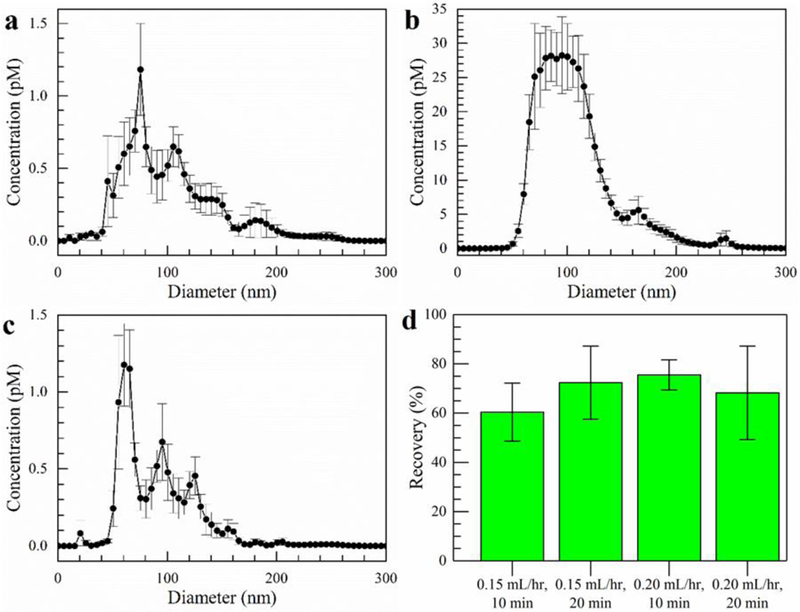
Exosomes isolated from a sample of 1 X PBS after 10 min using a flow rate of 150 µL/hr and a field strength of 100 V/cm. a) The exosome size distribution before isolation experiments. b) Size distribution of the exosomes collected from the gel. c) Size distribution of the exosomes in the effluent. Error bars represent the standard error with n = 5. d) Quantitative exosome recovery as measured by the fluorescence of exosomes labeled with CFSE dye. The effluent was collected at 10 min intervals for two different flow rates using a constant field strength of 100 V/cm. The error bars are standard deviations with n = 3.
3.3. Quantitative Fluorescence Evaluation of Exosome Isolation
We extended the above experiments of isolating exosomes to using flow rates of 0.15 and 200 µL/hr and a field strength of 100 V/cm but analyzed the effluent quantitatively using fluorescence. We estimated the concentration of the original exosome sample using nanoparticle tracking to be 71 ± 7 pM. Then we created a calibration curve from 0.015 – 0.71 pM based on dilutions of the original sample. For the actual isolation experiments conducted with the microfluidic chip, we diluted the original sample of CFSE-dyed exosomes by a factor of ten. We collected the effluent at intervals of 10 and 20 min and determined the exosome concentration by fluorescence with the results reported in Figure 2d. The fluorescence of the exosomes in the effluent was measured and the recovery rate was determined by the (total amount of exosomes in inlet – amount of exosomes in effluent) / (total amount of exosomes in inlet). The recovery rates range from 60 to 76%, but the large standard deviation at each flow rate and time interval indicates there is also much overlap. Looking at all the values, the average and standard deviation of the recovery rates is 69 ± 7%, consistent with the nanoparticle tracking measurements discussed in Section 3.2.
Importantly, Fig. 2d shows that the recovery rate, within error, is the same at the 10 and 20 minutes collection times. This indicates the capacity of the gel to collect exosomes is not restricted in at least a 20 minutes time interval. Although longer times might eventually overcome the capacity of the gel to take in more exosomes, extending the length or width of the gel region would restore its capacity to capture more exosomes. However, it may be advantageous to keep the gel region as small as possible. The reason is that a small gel region maximizes the concentration of the exosomes. Based on our chip dimensions, if we approximate the volume the exosomes are confined to as 7.5 µL (7.5 mm × 0.5 mm × 2 mm), then after 20 minutes of isolation time, the concentration of our exosomes is a factor of 30 higher than the original exosome concentration. Another way to put it is that, at the given field strength and flow rate, the exosomes concentrate by a factor of 15 every 10 min.
The preconcentration of exosomes may prove to be critical for early cancer detection assays which rely on either the detection of exosomes themselves or on the detection of exosomal RNA. The detection limits of such assays are measured in concentrations and not exosome numbers. For example, Zhao et al. successfully detected exosomes for ovarian cancer down to 7.5 × 10⁵ particles/mL, but it was unclear at which stage of cancer their diagnostic chip would be useful [52]. Similarly, Vaidyanathan et al.’s nanoshearing technique could specifically detect exosomes from breast cancer patients down to 2.8 × 10⁶ particles/mL, but it was again unclear at which stage of cancer this technology would be viable [53]. If cancer screening requires detection limits lower than these exosome concentrations, preconcentration is required. This concentration effect could also be particularly beneficial for potential downstream analysis of the exosome cargo. To date, there is no consensus as to the number of miRNA, for example, that exosomes may contain, ranging from 0.001–10 copies, and thus concentrating the exosomes could improve detection of miRNA that are at very low copy numbers [67–69]. This will depend on how this device is coupled to downstream lysis and detection technologies, but this preconcentration aspect, in addition to the isolation capacity, also holds promise.
3.4. Comparison with Ultracentrifugation and ExoQuick™
Next, we isolated exosomes directly from cell culture media and then also made a direct comparison to the methods of ultracentrifugation and ExoQuick™ precipitation. Following the same procedure as above using our microfluidic chip, we determined the exosome recovery rate to be 80 ± 11%. Again, our results in Figure 3 appear similar to those presented above. We avoid significant concentrations of particles with diameters above 300 nm. The size distribution of the exosomes from the cell media culture is similar to the one from 1X PBS. Comparing Figure 3b to 3d, the gel clearly recovers the exosome peak at 83 nm. However, it does not seem to recover the peak at 130 nm very well. This could be because the exosomes 130 nm in diameter have a lower mobility in the electric field and also because of a sieving effect by the gel. Therefore, the 83 nm exosome concentration enhances in the gel relative to the 130 nm exosomes, and the peak tends to smooth out at larger diameters. We also show a single capture from the nanoparticle tracking analysis before and after isolation in Figures 3a and 3c because the averaging performed by the NanoSight tends to smooth out the peaks. In Figure 3c, we do see a shoulder at 120 nm which illustrates there is still capture of larger exosomes.
Figure 3.
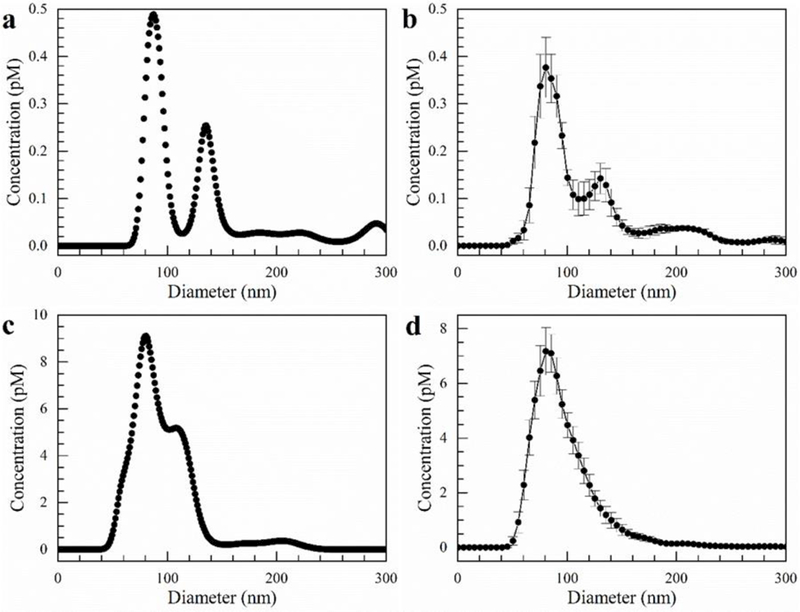
Exosomes isolated directly from cell culture media using our microfluidic chip after 10 min with a flow rate of 150 µL/hr and an electric field of 100 V/cm. a) Single capture from NanoSight of cell culture media before isolation, b) Average size distribution of cell culture media before isolation. c) Single capture from NanoSight of exosomes isolated in gel. d) Average size distribution of exosomes isolated in gel. Error bars represent the standard error with n = 5.
For comparison, we isolated one sample of exosomes from cell culture media by ultracentrifugation and another sample by ExoQuick™. Based on triplicate measurements of these samples using nanoparticle tracking analysis, the recovery rates were 6% and 30% with standard deviations of 2% and 11%, respectively – far lower than the 80% recovery achieved with our microfluidic chip.
Our new isolation methodology possesses a number of advantages over these traditional laboratory techniques. First, it does not require nearly as much sample volume to carry out the isolation protocol. Ultracentrifugation required more than 100 mL and ExoQuick™ more than 10 mL to produce a useful concentration of exosomes in only 500 µL of PBS. Furthermore, ultracentrifugation entails more than an hour of operating time while ExoQuick™ requires overnight incubation. Our microfluidic chip needs less than 100 µL for operation and can process 200 µL with good recovery rates in one hour. The recovery rate in our microfluidic chip is more than 10-fold higher than that from ultracentrifugation and more than 2-fold that of ExoQuick™. Finally, there are substantial differences in costs between these techniques. Not only does ultracentrifugation have high capital costs, but it has high operating costs as well. ExoQuick™ is much less expensive, but it still carries with it the costs associated with the repetitive use of reagents. The microfluidic technique we developed requires no more than a syringe pump and a voltage source in addition to the chip itself, and it runs using common laboratory reagents.
3.5. Isolation from Biological Samples
To prove the utility of our platform to the application of expected clinical and laboratory samples, we tested the capability of our microfluidic device to isolate exosomes from blood serum. We demonstrated the isolation capability by first spiking a blood sample with exosomes isolated using ExoQuick™ and then removing the red blood cells by centrifugation. We performed exosome isolation for 10 min using our microfluidic chip at a flow rate of 150 µL/hr and an electric field strength of 100 V/cm. As we did previously, we collected the effluent and excised the gel to extract the exosomes. Following dilution, we measured their approximate concentrations using nanoparticle tracking with the size distributions displayed in Figure 4. The measured recovery rate was 77 ± 14% within a 95% confidence interval.
Figure 4.
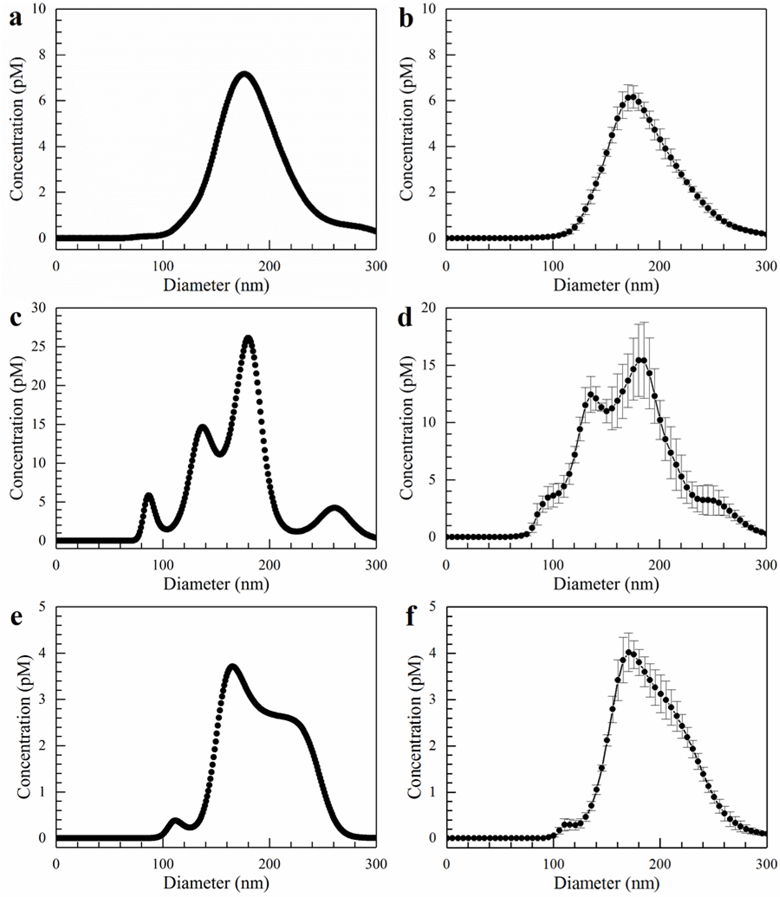
Size distributions for exosomes from blood serum. The flow rate was 150 µL/hr, and the field strength was 100 V/cm. a) Inlet single capture. b) Inlet average. c) Gel single capture. d) Gel average. e) Effluent single capture. f) Effluent average. Error bars represent the standard error with n = 5.
In order to obtain a clearer picture of what is happening, it is once again instructive to examine the single capture graphs in Figures 4a, 4c, and 4e, as opposed to the average graphs. The individual captures better illustrate the various peaks within the different size distributions. Figure 4a clearly shows the blood serum contains a Gaussian-shaped distribution of particles from approximately 100 to 300 nm with a peak maximum at 180 nm. On the other hand, the spiked exosomes, whose size distribution is shown in Figure 3a, are not readily apparent as the 80 and 120 nm peaks are obscured due to the greater concentration of what are most likely microvesicles. However, in Figure 4c where we examine the particles captured by the gel, the spiked exosome peaks reappear. Although the 180 nm peak still possesses the highest concentration, the concentrations of the 90 and 120 nm peaks increase substantially relative to the 180 nm one. On average, the ratio of concentration at 180 nm to the concentrations at 90 decreased from approximately 41 to 5.2 after capture within the gel. Furthermore, in Figure 4e, there is a significant rightward shift in the size distribution as well as a relatively clean cutoff below about 130 nm in the effluent. This is evidence of a strong sieving effect by the gel. In addition, the cutoff below 130 nm in the effluent is important since it demonstrates we are capturing most of the particles in the exosome size range.
4. CONCLUDING REMARKS
We developed a simple microfluidic device to continuously isolate exosomes by trapping them in agarose gel using an ion-selective membrane. We procured intense but narrow transverse electric fields by segregating the electrodes from the microfluidic channel using the gel and the membrane, and we deterred the effect of large pH changes by refreshing the buffer in the electrode reservoirs. We also prevented Ohmic heating and bubble generation by the high sample flow rate through the narrow region with the high transverse electric field. Our system proved capable of isolating greater than 70% of the incoming exosomes at 150 µL/hr for at least 20 min. We could further improve the throughput of our assay by using higher sample flow rates. Such higher flow rates could be accommodated with multiple parallel channels. Alternatively, although the capture efficiency might go down with one channel, introducing a recycle stream or passing the sample downstream through another channel would be an effective means to capture nearly all the exosomes. Nanoparticle tracking analysis confirmed a sieving effect produced by the gel which significantly enriched the exosome population relative to the microvesicle population. We could further enhance this effect by optimizing the pore size of the gel which can be adjusted by changing the agarose concentration. Decreasing the pore size will lead to a purer exosome sample. In addition, the nanoparticle tracking analyses demonstrated superior recovery of our technique compared to the conventional techniques of ultracentrifugation and ExoQuick™: 60 – 80% versus 6% and 30%, respectively.
Not only does our isolation scheme prove useful over the traditional ultracentrifugation and ExoQuick™ precipitation techniques, but it also adds to the suite of microfluidic technologies developed for exosome isolation and recovery. Our device is particularly valuable for a few reasons. First, it not only isolates exosomes, but it concentrates them as well which may prove to be a critical feature for early stage cancer detection. This may be necessary if exosomes themselves act as the biomarkers, but it may also be required if it is the exosomal RNA used for biomarker detection. Our setup combines preconcentration with isolation. Second, our setup can easily integrate with other microfluidic unit operations such as thermal or SAW lysis and miRNA detection by the current-voltage characteristics of ion-selective membranes [64] or the nucleic acid detection scheme we developed previously [59, 60]. The ability to isolate, lyse, and then detect in a single fully integrated device would be a major advancement in the field of point-of-care diagnostics. Third, we avoid clogging of the pores of the membrane because of its ion-selective nature. Unlike an uncharged membrane, our negatively charged membrane repel the exosomes which prevents them from blocking the pore entrances at the surface of the membrane, thus utilizing the external ion concentration polarization phenomenon of the cation-selective membrane to enrich the exosome macroions. Finally, we clearly established the applicability of our device to clinical samples by demonstrating the recovery of exosomes from both blood serum and cell media culture.
Acknowledgements
We acknowledge the support of NIH grants 1R21AI105361–01A1, 1R21CA206904–01 and HG009010–01.
Abbreviations:
- CFSE
carboxyfluorescein succinimidylester
- mRNA
messenger RNA
- miRNA
microRNA
- SAW
surface acoustic waves
REFERENCES
- 1.Schultz NA, Dehlendorff C, Jensen BV, Bjerregaard JK, Nielsen KR, Bojesen SE, Calatayud D, Nielsen SE, Yilmaz M, Hollander NH, Andersen KK, Johansen JS, J. Am. Med. Assoc 2014, 311, 392 – 404. [DOI] [PubMed] [Google Scholar]
- 2.Capello M, Bantis LE, Scelo G, Zhao Y, Li P, Dhillon DS, Patel NJ, Kundnani DL, Wang H, Abbruzzese JL, Maitra A, Tempero MA, Brand R, Firpo MA, Mulvihill SJ, Katz MH, Brennan P, Feng Z, Taguchi A, Hanash SM, Natl J. Cancer Inst 2017, 109, 266. [DOI] [PMC free article] [PubMed] [Google Scholar]
- 3.Soliman LC, Hui Y, Hewavitharana AK, Chen DDY, J. Chromatogr. A 2012, 1267, 162 – 169. [DOI] [PubMed] [Google Scholar]
- 4.Patel RS, Jakymiw A, Yao B, Pauley BA, Carcamo WC, Katz J, Cheng JQ, Chan EKL, Arch. Oral Biol 2011, 56, 1506 – 1513. [DOI] [PMC free article] [PubMed] [Google Scholar]
- 5.Schneider SS, Aslebagh R, Wetie A, Sturgeon S, Darie C, Arcaro K, Advancements of Mass Spectrometry in Biomedical Research 2014, 808, 399 – 408. [DOI] [PubMed] [Google Scholar]
- 6.Arcaro KF, Browne EP, Qin W, Zhang K, Anderton DL, Sauter ER, J. Hum. Lact 2012, 28, 543 – 546. [DOI] [PubMed] [Google Scholar]
- 7.Swarup V, Rajeswari MR, FEBS Lett 2007, 581, 795 – 799. [DOI] [PubMed] [Google Scholar]
- 8.Hao TB, Shi W, Shen XJ, Qi J, Wu XH, Wu Y, Tang YY, Ju SQ, Br. J.Cancer 2014, 111, 1482 – 1489. [DOI] [PMC free article] [PubMed] [Google Scholar]
- 9.Zimmermann BG, Wong DT, Oral Oncol 2008, 44, 425 – 429. [DOI] [PMC free article] [PubMed] [Google Scholar]
- 10.Debernardi S, Massat NJ, Radon TP, Sangaralingam A, Banissi A, Ennis DP, Dowe T, Chelala C, Pereira SP, Kocher HM, Young BD, Bond-Smith G, Hutchins R, Crnogorac-Jurcevic T, Am. J. Cancer Res 2015, 5, 3455 – 3466. [PMC free article] [PubMed] [Google Scholar]
- 11.Javidi MA, Ahmadi AH, Bakhshinejad B, Nouraee N, Babashah S, Sadeghizadeh M, Med. Oncol 2014, 31, 295. [DOI] [PubMed] [Google Scholar]
- 12.Torphy RJ, Tignanelli CJ, Kamande JW, Moffitt RA, Loeza SGH, Soper SA, Yeh JJ, PLos One 2014, 9, 89474. [DOI] [PMC free article] [PubMed] [Google Scholar]
- 13.Skog J, Wurdinger T, van Rijn S, Meijer DH, Gainche L, Sena-Esteves M, Curry WT, Carter BS, Krichevsky AM, Breakefield XO, Nat. Cell Biol 2008, 10, 1470 – 1476. [DOI] [PMC free article] [PubMed] [Google Scholar]
- 14.Minciacchi VR, Freeman MR, Di Vizio D, Semin. Cell Dev. Biol 2015, 40, 41 – 51. [DOI] [PMC free article] [PubMed] [Google Scholar]
- 15.Hakulinen J, Sankkila L, Sugiyama N, Lehti K, Keski-Oja J, J. Cell Biochem 2008, 105, 1211 – 1218. [DOI] [PubMed] [Google Scholar]
- 16.Luga V, Zhang L, Viloria-Petit AM, Ogunjimi AA, Inanlou MR, Chiu E, Buchanan M, Hosein AN, Basik M, Wrana JL, Cell 2012, 151, 1542 – 1556. [DOI] [PubMed] [Google Scholar]
- 17.Webber JP, Spary LK, Sanders AJ, Chowdhury R, Jiang WG, Steadman R, Wymant J, Jones AT, Kynaston H, Mason MD, Tabi Z, Clayton A, Oncogene 2015, 34, 319 – 331. [DOI] [PubMed] [Google Scholar]
- 18.Kahlert C, Melo SA, Protopopov A, Tang J, Seth S, Koch M, Zhang J, Witz J, Chin L, Futreal A, Kalluri R, J. Biol. Chem 2014, 289, 3869 – 3975. [DOI] [PMC free article] [PubMed] [Google Scholar]
- 19.Lee TH, Chennakrishnaiah S, Audemard E, Montermini L, Meean B, Rak J, Biochem. Biophys. Res. Commun 2014, 451, 295 – 301. [DOI] [PubMed] [Google Scholar]
- 20.Hoshino A, Costa-Silva B, Shen TL, Rodrigues G, Hashimoto A, Mark MT, Molina H, Kohsaka S, Di Giannatale A, Ceder S and Singh S, Nature 2015, 527, 329 – 335. [DOI] [PMC free article] [PubMed] [Google Scholar]
- 21.Lv M, Zhu X, Chen W, Zhong S, Hu Q, Ma T, Zhang J, Chen L, Tang J, Zhao J, Tumor Biol 2014, 35, 10773 – 10779. [DOI] [PubMed] [Google Scholar]
- 22.Choi DY, You S, Jung JH, Lee JC, Rho JK, Lee KY, Freeman MR, Kim KP, Kim J, Proteomics 2014, 14, 1845 – 1856. [DOI] [PubMed] [Google Scholar]
- 23.Yu S, Cao H, Shen B, Feng J, Oncotarget 2015, 6 , 37151 – 37168. [DOI] [PMC free article] [PubMed] [Google Scholar]
- 24.Tickner JA, Urquhart AJ, Estephenson SA, Richard DJ, O’Byrne KJ, Front Onco 2014, 4, 127. [DOI] [PMC free article] [PubMed] [Google Scholar]
- 25.Peinado H, Aleckovic M, Lavotshkin S, Matei I, Costa-Silva B, Moreno-Bueno G, Hergueta-Redondo M, Williams C, Garcia-Santos G, Ghajar CM, Nitadori-Hoshino A, Hoffman C, Badal K, Garcia BA, Callahan MK, Yuan J, Martins VR, Skog J, Kaplan RN, Brady MS, Wolchok JD, Chapman PB, Kang Y, Bromber J, Lyden D, Nat. Med 2012, 18, 883 – 891. [DOI] [PMC free article] [PubMed] [Google Scholar]
- 26.Grange C, Tapparo M, Collino F, Vitillo L, Damasco C, Deregibus MC, Tetta C, Bussolati B, Camussi G, Tumor Stem Cell Biol 2011, 71, 5346 – 5356. [DOI] [PubMed] [Google Scholar]
- 27.Milane L, Singh A, Mattheolabakis G, Suresh M, Amji MM, J. Control Release 2015, 219, 278 – 294. [DOI] [PubMed] [Google Scholar]
- 28.Ray K, Nat. Rev. Gastroenterol Hepatol 2015, 12, 371. [DOI] [PubMed] [Google Scholar]
- 29.Zhang L, Zhang S, Yao J, Lowery FJ, Zhang Q, Huang WC, Li P, Li M, Wang X, Zhang C , Wang H Nature 2015, 527, 100 – 104. [DOI] [PMC free article] [PubMed] [Google Scholar]
- 30.Richards KE, Zeleniak AE, Fishel ML, Wu J, Littlepage LE, Hill R, Oncogene 2017, 36, 1770 – 1778. [DOI] [PMC free article] [PubMed] [Google Scholar]
- 31.Taylor DD, Gercel-Taylor C, Gynecol Oncol 2008, 110, 13 – 21. [DOI] [PubMed] [Google Scholar]
- 32.Rabinowits G, Gercel-Taylor C, Day JM, Taylor DD, Kloecker GH, Clin. Lung Cancer 2009, 10, 42 – 48. [DOI] [PubMed] [Google Scholar]
- 33.Michael A, Bajracharya SD, Yuen PST, Zhou H, Star RA, Illei GG, Alevizos I, Oral Discovery 2010, 16, 34 – 38. [DOI] [PMC free article] [PubMed] [Google Scholar]
- 34.Zhou Q, Li M, Wang X, Li Q, Wang T, Zhu Q, Zhou X, Wang X, Gao X, Li X, Int. J. Biol. Sci 2012, 8, 118 – 123. [DOI] [PMC free article] [PubMed] [Google Scholar]
- 35.Del Boccio P, Raimondo F, Pieragostino D, Morosi L, Cozzi G, Sacchetta P, Magni F, Pitto M, Urbani A, Electrophoresis 2012, 33, 689 – 696. [DOI] [PubMed] [Google Scholar]
- 36.Li M, Zeringer E, Barta T, Schageman J, Cheng A, Vlassov AV, Philos. Trans. R. Soc. Lond. B Biol. Sci 2014, 369, 20130502. [DOI] [PMC free article] [PubMed] [Google Scholar]
- 37.Gallo A, Tandon M, Alevizos I, Illei GG, PLoS One 2012. 7, 30679. [DOI] [PMC free article] [PubMed] [Google Scholar]
- 38.Whiteside TL, Adv. Clin. Chem 2016, 74, 103 – 141. [DOI] [PMC free article] [PubMed] [Google Scholar]
- 39.Li Z, Ma YY, Wang J, Zeng XF, Li R, Kang W, Hao XK, Onco. Targets Ther 2015, 9, 139 – 148. [DOI] [PMC free article] [PubMed] [Google Scholar]
- 40.Lobb RJ, Becker M, Wen SW, Wong CSF, Wiegmans AP, Leimgruber A, Moller A, J. Extracell. Vesicles 2015, 4, 27031. [DOI] [PMC free article] [PubMed] [Google Scholar]
- 41.Lamparski HG, Metha-Damani A, Yao JY, Patel S, Hsu DH, Ruegg C, Le Pecq JB, J. Immunol. Methods 2002, 270, 211 – 226. [DOI] [PubMed] [Google Scholar]
- 42.Momen-Heravi F, Balaj L, Alian S, Mantel PY, Halleck AE, Trachtenberg AJ, Soria CE, Oquin S, Bonebreak CM, Saracoglu E, Skog J, Kuo WP, Biol. Chem 2013, 394, 1253 – 1262. [DOI] [PMC free article] [PubMed] [Google Scholar]
- 43.Tauro BJ, Greening DW, Mathias RA, Ji H, Mathivanan S, Scott AM, Simpson RJ, Methods 2012, 293 – 304. [DOI] [PubMed] [Google Scholar]
- 44.Van Deun J, Mestdagh P, Sormunen R, Cocquyt V, Vermaelen K, Vandesompele J, Bracke M, De Wever O, Hendrix A, J. Extracell. Vesicles 2014, 3, 24858. [DOI] [PMC free article] [PubMed] [Google Scholar]
- 45.Clayton A, Court J, Navabi H, Adams M, Mason MD, Hobot JA, Newman GR, Jasani B, J. Immunol. Methods 2001, 247, 163 – 174. [DOI] [PubMed] [Google Scholar]
- 46.Koga K, Matsumoto K, Akiyoshi T, Kubo M, Yamanaka N, Tasaki A, Nakashima H, Nakamura M, Kuroki S, Tanaka M, Katano M, Anticancer Res 2005, 25, 3703 – 3708. [PubMed] [Google Scholar]
- 47.Mathivanan S, Lim JWE, Tauro BJ, Ji H, Moritz RL, Simpson RJ, Mol. Cell. Proteomics 2010, 9, 197 – 208. [DOI] [PMC free article] [PubMed] [Google Scholar]
- 48.Li P, Kaslan M, Lee SH, Yao J, Gao Z, Theranostics 2017, 7,789. [DOI] [PMC free article] [PubMed] [Google Scholar]
- 49.Willms E, Johansson HJ, Mäger I, Lee Y, Blomberg KEM, Sadik M, Alaarg A, Smith CE, Lehtiö J, Andaloussi SE, Wood MJ, Sci. rep 2016, 6, 22519. [DOI] [PMC free article] [PubMed] [Google Scholar]
- 50.Yamada T, Inoshima Y, Matsuda T, Ishiguro N, Clin. Pathol 2012, 74, 1523 – 1525. [DOI] [PubMed] [Google Scholar]
- 51.Yang F, Liao X, Tian Y, Li G, Biotechnol. J 2017, 12, 1600699. [DOI] [PubMed] [Google Scholar]
- 52.Zhao Z, Yang Y, Zeng Y, He. M, Lab Chip 2016, 16, 489 – 496. [DOI] [PMC free article] [PubMed] [Google Scholar]
- 53.Vaidyanathan R, Naghibosadat M, Rauf S, Korbie D, Carrascosa LG, Shiddiky MJA, Trau M, Anal. Chem 2014, 86, 11125 – 11132. [DOI] [PubMed] [Google Scholar]
- 54.Chen C, Skog J, Hsu CH, Lessard RT, Balaj L, Wurdinger T, Carter BS, Breakefield XO, Toner M, Irimia D, Lab Chip 2010, 10, 505 – 511. [DOI] [PMC free article] [PubMed] [Google Scholar]
- 55.Wang Z, Wu H, Fine D, Schmulen J, Hu Y, Godin B, Zhang JXJ, Liu X, Lab Chip 2013, 13, 2879 – 2882. [DOI] [PMC free article] [PubMed] [Google Scholar]
- 56.Davies RT, Kim J, Jang SC, Choi EJ, Gho YS, Park J, Lab Chip 2012, 12, 5202 – 5210. [DOI] [PubMed] [Google Scholar]
- 57.Cho S, Jo W, Heo Y, Kang JY, Kwak R, Park J, Sens. Actuators B 2016, 233, 289 – 297. [Google Scholar]
- 58.Lee K, Shao H, Weissleder R, Lee H, ACS Nano 2015, 9, 2321 – 2327. [DOI] [PMC free article] [PubMed] [Google Scholar]
- 59.Marczak S, Smith E, Senapati S, Chang HC., Electrophoresis 2017, 0, 1–11. [DOI] [PubMed] [Google Scholar]
- 60.Marczak S, Senapati S, Slouka Z, Chang HC, Biosens. Bioelec 2016,86, 840–848. [DOI] [PubMed] [Google Scholar]
- 61.Slouka Z, Senapati S, Chang HC, Annu. Rev. Anal. Chem 2014,7, 317–335. [DOI] [PubMed] [Google Scholar]
- 62.Pernodet N, Maaloum M, Tinland B, Electrophoresis 1997, 18, 55 – 58. [DOI] [PubMed] [Google Scholar]
- 63.Righetti PG, Brost BCW, Snyder RS, J. Biochem. Biophys. Methods 1981, 4, 347 – 363. [DOI] [PubMed] [Google Scholar]
- 64.Taller D, Richards K, Slouka Z, Senapati S, Hill R, Go DB, Chang HC, Lab Chip 2015, 15, 1656 – 1666. [DOI] [PubMed] [Google Scholar]
- 65.Weiner BB, Microvesicles and Liposomes, Application Note, Brookhaven Instruments, A Nova Instruments Company. 2013. [Google Scholar]
- 66.Minerick AR, Ostafin AE, Chang HC, Lee KH, Witzmann FA, Electrophoresis 2002, 23, 2165 – 2173. [DOI] [PubMed] [Google Scholar]
- 67.Keller S, Ridinger J, Rupp AK, Janssen JW, Altevogt P, J. Transl. Med 2011, 9, 86. [DOI] [PMC free article] [PubMed] [Google Scholar]
- 68.Chen WW, Balaj L, Liau LM, Samuels ML, Kotsopoulos SK, Maguire CA, LoGuidice L, Soto H, Garrett M, Zhu LD, Sivaraman S, Mol. Ther. Nucleic Acids 2013, 2, e109. [DOI] [PMC free article] [PubMed] [Google Scholar]
- 69.Chevillet JR, Kang Q, Ruf IK, Briggs HA, Vojtech LN, Hughes SM, Cheng HH, Arroyo JD, Meredith EK, Gallichotte EN, Pogosova-Agadjanyan EL, Proc. Natl. Acad. Sci 2014, 111, 14888–14893. [DOI] [PMC free article] [PubMed] [Google Scholar]