

Abstract
Genetic bottlenecks resulting from human-induced population declines make alarming symbols for the irreversible loss of our natural legacy worldwide. The grey wolf (Canis lupus) is an iconic example of extreme declines driven by anthropogenic factors. Here, we assessed the genetic signatures of 150 years of wolf persecution throughout the Western Palaearctic by high-throughput mitochondrial DNA sequencing of historical specimens in an unprecedented spatio-temporal framework. Despite Late Pleistocene bottlenecks, we show that historical genetic variation had remained high throughout Europe until the last several hundred years. In Western Europe, where wolves nearly got fully exterminated, diversity dramatically collapsed at the turn of the twentieth century and recolonization from few homogeneous relict populations induced drastic shifts of genetic composition. By contrast, little genetic displacement and steady levels of diversity were maintained in Eastern European regions, where human persecution had lesser effects on wolf demography. By comparing prehistoric, historic and modern patterns of genetic diversity, our study hence traces the timeframe and the active human role in the decline of the grey wolf, an emblematic yet controversial animal which symbolizes the complex relationship between human societies and nature conservation.
Keywords: conservation, Canis lupus, genetic diversity, historical DNA, human-driven declines, museum specimens
1. Introduction
Genetic variation is the keystone of the adaptive potential of species and an important component of our natural legacy [1,2]. Genetic bottlenecks (i.e. the loss of genetic variants when populations contract) are one hidden consequence of the biodiversity crisis worldwide. When conservation efforts pay off, species recovery and recolonization of former ranges may also reshape the genetic composition of populations, with potential detrimental effects such as migration load (i.e. reduced fitness of migrants due to maladaptation [3]) and expansion load (i.e. the fixation by drift of slightly deleterious mutations during demographic expansions [4]). Genetically impoverished populations may thus be more susceptible to extrinsic stresses [5]. Understanding the genetic impacts of past and present population dynamics in changing human societies and environments is thus a central aspect of conservation research. Moreover, quantifying the irreversible losses of diversity can raise awareness among the institutional stakeholders and the public opinion towards conservation issues.
A wide array of studies has inferred genetic bottlenecks from demographic analyses based on contemporary samples [6–9], yet with the inherent difficulty to distinguish between recent, anthropogenic losses of diversity versus long-term bottlenecks initiated earlier during the Quaternary. In addition, human-mediated extinction events might play a key role in the spatial (re)structuring of biodiversity, with important conservation consequences [10]. Addressing these issues requires access to initial levels and distribution of genetic diversity from historical collections, which is challenging due to their low DNA content and quality, and often limited availability. Hence, so far most studies analysing historical DNA in declining species have remained restricted to narrow geographical regions and time scales. Yet comprehensive spatio-temporal frameworks are necessary to attribute a role of anthropogenic pressures and historical declines in shaping present patterns of diversity.
Few animals exemplify the contrasted relationship between society and nature better than the grey wolf (Canis lupus). Formerly the most widely distributed mammal on Earth, its persecution up until the twentieth century has led to extreme declines and extinctions over large parts of the Palaearctic and Nearctic [11,12]. However, wolves from the Western Palaearctic went through contrasted histories. The persecution, mainly due to competition for food resources and cultural prejudice, was extremely severe in Western Europe, involving hunting/trapping programmes initiated as early as the Middle Ages and ultimately leading to the extirpation from England (sixteenth century), Scotland (1684), Ireland (1786), Denmark (1772), The Netherlands (1869), as well as Germany, Switzerland and France (late nineteenth/early twentieth century). The Italian population (C. l. italicus) only persisted in narrow Apennine pockets with as low as hundred surviving individuals [13], while the Iberian population (C. l. signatus) had its range shrunk down to two areas in the southern and northwest parts of the peninsula [11,12]. By contrast, the species faced a more relaxed pressure in Central and Eastern Europe. Despite some periods of persecution leading to regional population declines and range contractions, wolves were never extirpated from Balkanic and Baltic countries. Besides, wolves could easily migrate from the Russian empire, where hunting programmes remained relatively moderate and populations maintained sustainable numbers [12]. For instance, the Finnish wolf population has been under perfusion from the adjacent Russian Karelia.
As for other large carnivores, cultural changes combined with strong legislative acts are now promoting recovery and expansion across former ranges. The wolf is legally protected in most countries and has recolonized the Alpine Arc from the remnant Italian population. In the east, numbers rapidly increased over the last two decades in the Baltic States, Finland and Poland [14,15]. Wolves are now spreading further west in Sweden and Germany, and are regularly observed in Austria [14–16].
The important economic and conservation issues associated with wolf dynamics have stressed the need for programmes of genetic monitoring in most European countries. Modern patterns of diversity have thus received considerable attention [15,17,18], some of them consistent with local genetic bottlenecks [15]. By contrast, despite a few scattered cases (limited to Fennoscandia [19,20]), the genetics of European wolf populations prior and during their decline has never been addressed. Based on genomic analyses of contemporary specimens, several studies reported ancient (Late Pleistocene) loss of genetic variation and long-term demographic declines pre-dating modern times by tens of thousands of years [21–23], raising questions regarding the actual amount of diversity remaining in wolf populations prior to their recent extirpation, and, by extension, the role of human persecution in driving the detected genetic bottlenecks [24]. Dissecting this role thus requires a direct measure of the patterns of genetic diversity during human persecutions, over a comprehensive geographical and temporal scale, in order to draw general conclusions.
Here, we provide such comparative spatio-temporal framework with an unprecedented resolution by investigating changes in mitochondrial DNA (mtDNA) diversity across Western Palaearctic wolves over two centuries of history. The use of mtDNA, and particularly the hypervariable control region (CR), allows to capture high levels of polymorphism over short sequences (see Material and methods), a prerequisite for informative analyses of degraded DNA from museum-prepared specimens. Importantly, the CR has been massively used in contemporary wolf population genetics from all over the world (reviewed in [18]), enabling direct comparisons. To this end, we conducted a phylogeographical analysis of past and present wolf populations, combining more than 150 museum samples covering an entire zoogeographical region, with metadata from 20 regional studies. We aimed (i) to quantify the original amount of diversity, (ii) to quantify the rate of diversity losses during nineteenth- and twentieth-century declines and (iii) to assess changes in genetic composition resulting from extinction and recolonization events. In particular, we tested whether the contrasted persecution regimes left differential genetic signatures between Western and Central/Eastern Europe.
2. Results
We identified 42 haplotypes of the hypervariable mtDNA CR (validated by cloning and/or high-throughput sequencing; see Material and methods) among 155 historical specimens (complemented by an additional 22 published from Finland; [20]), covering the nineteenth to early twentieth centuries (figure 1; electronic supplementary material, figure S1). About half have since vanished: only 22 of these haplotypes remain among 1814 modern wolves analysed in Europe and adjacent regions (figure 1; electronic supplementary material, table S1). An additional 10 haplotypes found in modern wolves were not present in our historical samples. Moreover, only historical haplotypes H3 and H45 matched two of the 19 haplotypes of prehistoric wolves from the Late Pleistocene and Early Holocene published in [25] (57 bp, isolated from 24 wolf remains found across the Western Palaearctic; electronic supplementary material, figure S2).
Figure 1.

Mitochondrial haplotype network with the distribution of haplogroups in (a) historical and (b) modern times. Haplotypes (number: haplotype code) only found in our historical dataset are shown in shaded circles; historical haplotypes also found in modern datasets are shown in plain circles. The sizes of circles illustrate the relative frequency of each haplotype in the historical dataset. Haplotypes only found in modern datasets from the Western Palaearctic are shown by squares. Colours represent the main haplogroups composed of closely related haplotypes. Correspondence with the phylogeographical study by Pilot et al. [17] is provided in electronic supplementary material, figure S1. The historical map plots the distribution of haplogroups based on our dataset (circles with white strokes, size being proportional to sample sizes; n = 155) and from the data of [20] for Finland (circle with black stroke; n = 22), covering the 1795–1945 period. Circles annotated with official country codes (see electronic supplementary material, figure S4 for details) indicate specimens where geographical information was limited to the country of origin. At this time, wolves used to be distributed all over continental Europe. The modern map plots the current distribution of haplogroups based on published haplotype frequency data from 20 studies using comparable mtDNA sequences (n = 1814; large circles with black strokes; see Material and methods). Regions where only the haplotype occurrence was reported (but not their relative frequencies) are also shown (small circles with white strokes). The current range distinguishes areas where wolves always persisted (plain lines and dashed areas) from where the species became extinct and which have been recently recolonized (dashed lines).
Considering the entire Western Palaearctic, genetic diversity estimates, i.e. haplotype diversity (Hd) and nucleotide diversity (π), were overall higher in historical (Hd = 0.94 and π = 0.017, n = 177) than contemporary samples (Hd = 0.78 and π = 0.015, n = 1814). Resampling the modern estimates shows that these differences are statistically robust and independent from the uneven sample sizes (table 1; electronic supplementary material, figure S3). The trend was further confirmed by analysing each population separately (figure 2; electronic supplementary material, table S1).
Table 1.
Historical and modern diversity indices (haplotype diversity Hd and nucleotide diversity π) computed from all Western Palaearctic wolves and separately for Western and Eastern Europe.
|
Hd |
π |
|||
|---|---|---|---|---|
| historical | modern (95% CI) | historical | modern (95% CI) | |
| overall | 0.94 | 0.78 (0.73–0.83) | 0.017 | 0.015 (0.014–0.016) |
| West | 0.90 | 0.28 (0.17–0.39) | 0.016 | 0.006 (0.004–0.008) |
| East | 0.90 | 0.85 (0.81–0.88) | 0.015 | 0.016 (0.015–0.017) |
95% confidence intervals (CIs) after 10 000 resampling of the modern dataset (to the sample size of the corresponding historical one) are given.
Figure 2.
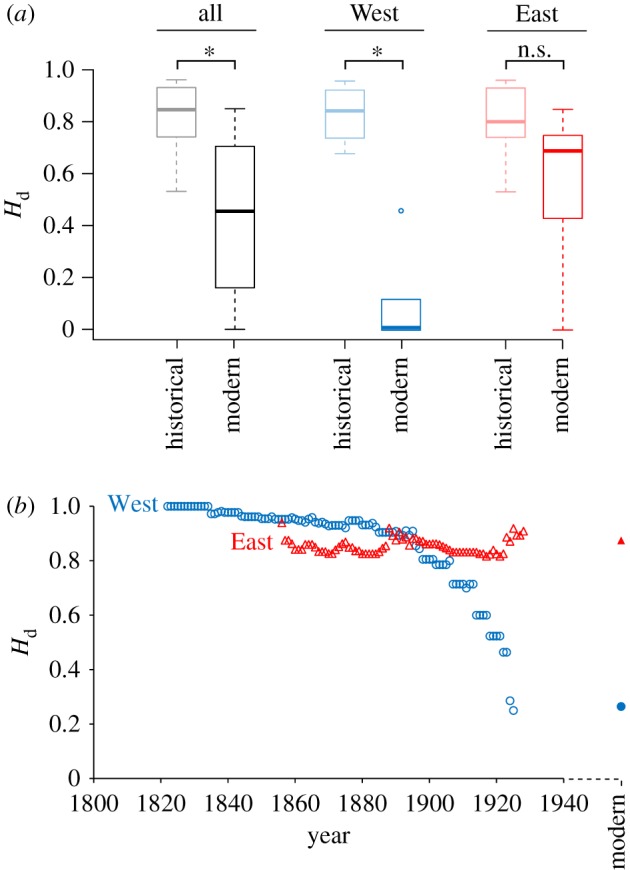
(a) Comparisons of region-based Hd between historical (1795–1945) and modern times (after 1990) and (b) haplotype diversity (Hd) over time in Western (blue) and Eastern Europe (red). (a) Comparison between historical and modern estimates were performed with non-parametric ANOVAs (10 000 permutations) and were significant for the whole dataset (n = 10 and 20 historical and modern estimates, respectively; p = 0.001) and for Western Europe (n = 4 and 5 historical and modern estimates, respectively; p = 0.016) but not for Eastern Europe (n = 5 and 14 historical and modern estimates, respectively; p = 0.095). On the boxplot: *p < 0.05, n.s., non-significant. More stringent pairwise comparisons (non-parametric paired Wilcoxon signed-rank test) were only significant for the overall dataset (n = 10 comparisons, p = 0.0020) but not for Western (n = 4 comparisons; p = 0.12) and Eastern Europe (n = 5 comparisons, p = 0.062). (b) Analyses are based on 30 years sliding windows, computed only for n ≥ 5, including samples with accurate date information only (n = 110). Western and Eastern areas are also distinguished by circles and triangles, respectively, and temporal series by empty (historical) and plain (modern) symbols.
Modern wolf populations are highly structured (pairwise Φst = 0.50 ± 0.30; electronic supplementary material, table S2 and figure S4), in comparison with historical ones (pairwise Φst = 0.24 ± 0.17; electronic supplementary material, table S2 and figure S3; paired Wilcoxon signed-rank test between modern and historical Φst: p < 0.001, n = 45 comparisons). Indeed, most of the major mitochondrial haplogroups used to historically coexist all over Europe (figure 1).
These trends vary between Western Europe (n = 85 historical and 865 modern samples) and Central/Eastern Europe (n = 84 historical and 931 modern samples), which we independently analysed (see next sections). Note that Scandinavian samples (n = 5 historical and 18 modern samples) were not attributed to either region (see Discussion).
(a). Wolves from Western Europe
Historical specimens from Western Europe featured highly diverse mtDNA variation over the entire region (Hd = 0.90 and π = 0.016) (table 1; electronic supplementary material, table S1). Modern estimates are significantly lower in comparison (Hd = 0.28 and π = 0.006; table 1; electronic supplementary material, figure S3). About three-quarters (17 out of 22) of the original mitotypes vanished from the region. This is well reflected by population-based comparisons, which also statistically support a reduction of Hd in modern Western European wolves (figure 2a; electronic supplementary material, table S1). For instance, the Italian wolf population is nowadays characterized by a largely predominant private haplotype (H18) and a second rare haplotype (H11), but at least 10 different ones used to occur throughout the country. The same is true for France and Switzerland, where 15 and 8 haplotypes were, respectively, found, before these populations became extinct. The genetic bottleneck was less drastic in Iberia, where several CR haplotypes have been maintained (electronic supplementary material, table S1). Analysis of haplotype diversity (Hd) through time revealed a dramatic collapse at the turn of the twentieth century (from 0.9 down to 0.3), reaching the extremely low diversity levels recorded across contemporary individuals (figure 2b).
Population differentiation across Western Europe appears lower historically (average pairwise Φst = 0.22 ± 0.17; electronic supplementary material, table S2 and figure S4) than at present (average pairwise Φst = 0.53 ± 0.43; electronic supplementary material, table S2); however, this difference was not significant, potentially due to the little number of comparisons (paired Wilcoxon signed-rank test between modern and historical Φst: p = 0.40, n = 6 comparisons). For instance, the modern C. l. italicus mtDNA private lineage (H18) used to occur in northern France. Historical Iberian wolves carried alleles that are not specific to modern C. l. signatus, but were also present elsewhere (e.g. H1 in France and Switzerland). Accordingly, pairwise Φst among the historical and modern populations are not correlated (Mantel test, p = 0.29), indicating that the genetic relationships between populations have changed.
Moreover, we report strong shifts in the genetic composition of these populations. Modern Western European wolves are genetically different from the ones originally present (France: Φst = 0.60; Switzerland: Φst = 0.70; Italy: Φst = 0.73; electronic supplementary material, table S1 and figure S3). The displacement was moderate in Spain, where several C. l. signatus haplotypes persisted (Φst = 0.08).
(b). Wolves from Eastern and Central Europe
The mitochondrial diversity of Eastern and Central European wolves remained high throughout the past centuries (Hd = 0.90 and π = 0.015; figure 2). Modern estimates were marginally lower (Hd = 0.85) or similar (π = 0.016) (table 1; electronic supplementary material, figure S3). Accordingly, population-based Hd were generally lower in modern than historical populations, but the difference was not significant (figure 2; electronic supplementary material, table S1).
The patterns of differentiation between populations remained stable between historical and modern datasets, with similar estimates (average pairwise Φst = 0.30 ± 0.12 prior 1945 versus Φst = 0.32 ± 0.22 among modern populations; paired Wilcoxon signed-rank test: p = 0.19, n = 10 comparisons Wilcoxon; electronic supplementary material, table S2 and figure S4) and relationships (significant correlation between historical versus modern pairwise Φst, p = 0.016).
Accordingly, little shifts in genetic composition were generally observed (Poland: Φst = 0.14; Turkey: Φst = 0.21; Caucasus: Φst = 0.02; Russia: Φst = 0.02; electronic supplementary material, table S1 and figure S4). Finland makes an exception, with strong shifts in frequencies between the two main haplotypes H15 and H29 (Φst = 0.39, based on the data from Jansson et al. [20]).
3. Discussion
Our analyses showed that the genetic diversity of grey wolves from the Western Palaearctic used to be remarkably higher a century ago than it is today (figure 2). In parallel, population differentiation was lower, indicating better historical connectivity and larger effective sizes. These patterns make clear genetic signatures of the human persecutions faced by the wolf up until the twentieth century at the continental scale and suggest that the Late Pleistocene bottleneck that leads to the loss of prehistoric diversity [17,25] was not solely responsible. Importantly, these signatures remarkably differ across Western and Central/Eastern Europe, in light of the contrasting histories of this controversial species throughout the Old World.
Before their nearly complete extermination, Western European wolves featured highly diverse and private mtDNA variation, comparable to the rest of the continent (figure 2; electronic supplementary material, table S1). Most of this diversity rapidly vanished at the turn of the twentieth century, not long before the last wolf packs disappeared from France, Switzerland, Germany and much of Italy and Iberia. As one would expect, these severe bottlenecks, detected in present-day nuclear data [15,26,27], had far-reaching consequences on the genetic composition and structure of modern populations. Wolves that recolonized the Western and Central Alps exclusively originate from the Italian population (C. l. italicus) that survived in the Apennines [28,29] and are genetically different from the ones present a century ago (electronic supplementary material, table S1 and figure S3). The Iberian population (C. l. signatus), however, retained more diversity [30,31]. Yet, the mitochondrial identity of these populations appears to be very recent and partly driven by the strong drift underlying the decline and recolonization processes; prior to the declines, the C. l. italicus mtDNA private lineage was not restricted to Italy; Iberian wolves killed in the nineteenth century carried non-‘signatus’ alleles. More generally, contemporary populations share far less haplotypes than before (due to population disconnection and lower effective population sizes), resulting in extremely high genetic differentiation.
By contrast, Eastern and Central European historical specimens tell a very different story. Their diversity remained high throughout the past centuries (figure 2; electronic supplementary material, table S1), and neither their genetic structure nor their identity substantially changed. Compared with Western Europe, this stability reflects well the relaxed pressure undergone by the wolf in Central and Eastern Europe. The only major change observed in the Finnish population is probably due to westward migration from Russia to replace wolves hunted in Finland [20].
Scandinavian samples (here represented by Swedish wolves) were independently considered due to their eastern phylogeographical connections but Western-like regimes of eradication. Surprisingly, our historical set of specimens featured high diversity (electronic supplementary material, table S1), while a previous study documented only a single haplotype fixed prior to 1945 (n = 33, from 1829 to 1939). Different geographical origins of samples may explain such discrepancy. In contrast to [19], our samples mostly originate from northern populations (figure 1), which were the last to disappear in 1966 (Sweden) and 1976 (Norway). While southern populations appeared early-bottlenecked [19], northern ones may then still have featured high effective sizes during the nineteenth-early twentieth centuries, which would explain their high historical genetic variation.
The genetic patterns documented in our study thus correlate with the differential pressures faced by Western and Eastern European wolf populations. The most persecuted Western European regions suffered strong losses of genetic diversity, increased genetic structure as well as profound changes in their genetic nature following recolonization dynamics. By contrast, Central and Eastern European areas did not experience such drastic shifts, presumably as persecutions had lesser effects on their demography. These general conclusions are in line with contemporary microsatellite data from local populations from Iberia and Russian Karelia, which only detected a genetic bottleneck in the former [31]. Importantly, given the high diversity maintained throughout Europe less than 150 years ago, we can clearly rule out the hypothesis of historically low genetic variation, a major confounding factor when disentangling human-driven versus biogeographical losses of diversity [32–34]. This aspect is particularly relevant for the wolf, since recent demographic analyses based on modern samples estimated a long-term decline initiated as early as Late Pleistocene, at least 30 000 years ago [21–23], leading to the biased conclusion that remnant populations had low diversity to begin with, notably in Italy [24]. Indeed, many prehistoric mtDNA haplotypes [25] had already been lost by the nineteenth century (electronic supplementary material, figure S2), but human pressures clearly bottlenecked the remaining diversity, over a remarkably short time scale. Hence, by adding a new time point between prehistoric [25] and modern eras [17], our study provides direct evidence for at least two steps in the decline of the wolf across Europe: a Late Pleistocene bottleneck, subsequently followed by a rapid, drastic, human-mediated collapse over the last centuries.
Our results are well in line with historical DNA analysis of 34 wolf specimens scattered across North America, where only 4 out of 13 mtDNA haplotypes survived among contemporary populations [35]. Declines in genetic diversity over the last centuries were observed in other mammals decimated by hunting and poaching, such as Eurasian beavers [36], sea otters [37], Artic foxes [38], brown bears [39,40], Indian tigers [41], black rhinoceros [42], Guadalupe fur seals [43], northern elephant seals [44], Hector's dolphins [45] and grey whales [46]. In few other cases, diversity was low to begin with, either due to older bottlenecks or historically poor diversity (e.g. koalas [47]; Tasmanian tigers [48]). Changes in genetic structure were also commonly reported (e.g. range retraction has triggered population differentiation in alpine chipmunks [49]). Analyses of historical DNA also evidenced reduction of diversity and/or shifts in genetic composition and structure among a wide array of other declining animals, including birds [50–53], fishes [54] as well as insects [55,56]. In comparison to most of these regional studies however, our historical phylogeography has the advantage to analyse fine-scale genetic fluctuations using a large number of historical samples over an extended biogeographical region and constitutes one of the most exhaustive spatio-temporal survey of historical DNA to date. Additionally, all genetic polymorphisms were validated by cloning and high-throughput sequencing to cope with post-mortem DNA damage (see Material and methods). Finally, note that our findings are based on short, maternally transmitted mtDNA sequences only, a necessary restriction when dealing with highly degraded and low-quantity historical DNA, and patterns of past nuclear diversity in our historical wolves are yet to be documented.
The discrepancies between wolf historical and modern phylogeographical patterns, extreme in Western Europe, raise interesting questions on what should be considered as a reference for conservation guidelines. Should additional efforts be invested to restore the original diversity of Western populations, where modern Eastern lineages used to co-occur? These would involve improving connectivity at the European level and/or translocation actions from Eastern European wolves. At present, the long-range dispersal between the Balkan and Alpine populations [16,57] represent encouraging steps towards a natural resilience. More generally, similar skews are known to have affected several organisms that experienced recent and rapid range shifts due to complex decline/recolonization dynamics in response to anthropogenic impacts and climate change (reviewed in [10]). Phylogeographical and conservation inferences based on modern samples might thus not tell the whole story.
For the time being, our phylogeography of grey wolves from the Western Palaearctic makes a comprehensive continental-wide reference among the rich wolf population genetic literature, which modern patterns have been reviewed and discussed elsewhere [15,17,18] (see electronic supplementary material, figure S1 for correspondence of haplogroups with the study of Pilot et al. [17]). Wolf population divisions are commonly based on distribution data [14], which should be complemented by molecular studies, pending adequate geographical coverage and sampling schemes [15] as our meta-analysis provides for modern mtDNA. Genetic tools are essential to apprehend recolonization patterns and the effects of population disconnection, to estimate population sizes as well as to detect hybridization with dogs. Major threats against wolves commonly include overharvesting and poaching, conflicts due to predation on livestock, habitat fragmentation and generally low public acceptance resulting, in part, from lack of knowledge. As such, molecular surveys play a central part in population monitoring and management to improve the conservation situation of European wolves [18]. In particular, the strong genetic structure in Western Europe is of concern given the amazing dispersal capabilities of the wolf, emphasizing the need for additional efforts to restore connectivity between current populations. Even if, like other large carnivores, the situation has been improving over the past two decades [14], the economic, political and cultural aspects of wolf management remain a topic of extreme controversy in most European countries.
4. Material and methods
(a). Genetic analyses of historical specimens
Bone or skin samples (mostly maxilloturbinal bones, and ear or foot skin sample from mounted specimens or hides, respectively) were obtained from a total of 250 grey wolf C. lupus specimens generously provided by 69 European museums and collections (electronic supplementary material, table S3). With the exception of one sample dating back to the thirteenth century (stratigraphy-dated), all other samples mainly covered the nineteenth and early twentieth centuries (1795–1945), when persecution in continental Europe reached its climax. We selected specimens broadly originating from the Western Palaearctic region (except North Africa and the Arabian Peninsula), and for which information on geographical origin and date were available. We also included two historical (1938) specimens from the Himalayan wolf (C. l. chanco), a close monophyletic relative of C. l. lupus [58,59], to be used as outgroup in the phylogenetic analyses (see the electronic supplementary material for sample details).
Owing to the low copy number and degraded nature of historical DNA, special precautions to avoid contamination and authenticate results were taken during the whole laboratory procedure. DNA extraction and pre-PCR set-up were conducted in a physically separated laboratory exclusively devoted to the analysis of museum and low DNA-content samples, where amplified DNA has never been present. In each extraction and PCR-set-up session, a maximum of eight samples (including negative blanks) were handled simultaneously in a dedicated Plexiglas hood by personnel wearing disposable protective clothing and masks. All equipment used was UV-illuminated several hours prior the extraction and working surfaces where bleach-cleaned before and after each extraction and PCR-set-up rounds. Bone samples were processed by removing the exterior layer with a sterile scalpel blade. Samples were subsequently grinded to powder in a small mortar, which was bleached and exposed to shortwave UV after each use. Skin samples (approx. 1 × 1 cm) were sliced in small fragments with a sterile scalpel blade, after removing hairs. DNA was then extracted from bone powder and skin fragments using the QIAamp DNA Mini Kit (Qiagen).
To facilitate amplification of fragmented DNA, three short (approx. 111, 119 and 225 bp), partially overlapping sequences were amplified, resulting in an approximately 290 bp portion of the left domain of the mtDNA CR and approximately 27 bp of the adjacent Pro-tRNA gene (length excluding primers), with the following primer pairs: L15995 [60]/HW1 (5′-CAAACCATTAATGCACGACG-3′); LW1 (5′-CGTCGTGCATTAATGGTTTG-3′)/HW2 (5′-TCGAGGCATGGTGATTAAG-3′); LW1/H16498 [61]. This highly variable CR portion is the marker of choice given that it has been massively used in wolf population genetics from all over the world, enabling the inclusion of previously published data (reviewed in [18]; see the next section). Amplifications were performed in 25 µl reactions containing 2 mM MgCl2, 0.2 mM of each dNTP, 0.5 µM of each primer, 200 µg ml−1 of bovine serum albumin (Roche), 1× Gold buffer (Applied Biosystems), 1 unit AmpliTaq Gold DNA polymerase (Applied Biosystems) and 10 µl of template. Cycling conditions were: initial denaturation at 95°C for 3 min; 55 cycles at 95°C for 30 s, 54°C for 30 s and 72°C for 1 min. Between two and seven independent PCR amplifications were done for each fragment, and only samples with at least two positive amplifications per fragment were retained for subsequent analyses (n = 155). Bone samples had a significantly higher rate of successful amplification for all three fragments (χ2 (1, n = 252) = 11.27, p < 0.001) than museum-prepared skins, as expected [62].
We followed recommended guidelines for historical sample DNA sequencing, in particular to account for artefactual variation stemming from post-mortem DNA damage (e.g. deamination; [25,63]). An adequate procedure is to sequence with high coverage products from different replicate PCRs using high-throughput sequencing or cloning techniques, true haplotypes being present in a majority of sequencing reads, as opposed to miscodings. We implemented this approach as follows. First, we sequenced (both directions) two independent PCR replicates for each CR fragment for all of the 155 retained specimens, by Sanger technology on an ABI3100 platform (Applied Biosystems), after purification with the QIAquick PCR Purification kit (Qiagen). Second, we double-verified every single haplotype identified in two ways: 454 pyrosequencing and/or cloning.
For 454 pyrosequencing, the three PCR primer pairs were modified by the addition of specific 5–8 bp tags on the 5′-end to allow the assignment of sequence reads to the relevant sample. After PCR and DNA purification (MinElute PCR purification kit, Qiagen), all amplicons from the different samples were titrated using capillary electrophoresis (QIAxcel, Qiagen) and then mixed together, in equimolar concentrations. This mixture underwent sequencing on a GS FLX or a GS Junior pyrosequencing system (Roche), following manufacturer's instructions. After identification of primers and tags, only sequences with perfect match on tags and a maximum of two errors on primers were taken into account. Then, after removal of primers and tags, haplotypes were inferred from the majority-rule consensus of all different 454 reads for each sample. The number of reads per amplicon across the three analysed fragments ranged from 11 to 1581 (308 on average).
For cloning, we amplified again the three CR fragments and cloned them with the pGEM-T Easy Vector System (Promega). For each amplicon, a minimum of eight positive clones were subsequently sequenced (Sanger).
In total, the double validation of every haplotype involved either two independent rounds of 454 pyrosequencing (74% of haplotypes) or one round of 454 pyrosequencing plus one round of cloning (26% of haplotypes).
(b). Meta-analysis of existing datasets
To include data generated in previous studies, we searched for correspondence of our CR haplotypes with those published over the past 20 years in the literature, using the blastn algorithm on sequences available on GenBank. This task is challenged by the different sequence overlap between studies. To account for this, we further downloaded and manually aligned published haplotypes against our sequences, considering them identical if sequence overlap was greater than 90%. Below this threshold, we assigned them to collapsed haplotypes or more conservatively to haplogroups, depending on the analysis. We did not include data with sequence overlap less than 50%. Once we established correspondences between haplotypes and haplogroups, we computed their proportions in the different geographical regions where such data were available. Correspondences are provided in electronic supplementary material, table S4. In total, we could include modern data from 20 countries/populations, comprehensively investigated by regional studies [16,19,20,26–28,30,64–76], representing a total of 1814 modern wolves (electronic supplementary material, table S1). Note that such data are mostly commissioned by national authorities in charge of wolf management and are therefore primarily available and comparable by country, which sometimes do not reflect actual populations. In addition, we also included the published genetic data obtained from historical samples (nineteenth and twentieth centuries) available for Finland (n = 22) [20].
(c). Phylogenetic and population genetic analyses
Given the little divergence between CR sequences in wolves, we opted for a statistical network to represent relationships between haplotypes, accounting for indel polymorphism (TCS) [77]. We also performed maximum-likelihood reconstruction with PhyML [78], using a HKY + G + I model of sequence evolution (jModelTest [79]), and tested branch support by 1000 bootstrap replicates. We ran a second phylogenetic tree to compare our CR haplotypes with the prehistoric ones obtained from ancient DNA of 24 Western Palaearctic wolves dated to the Late Pleistocene/Early Holocene (57 bp) [25]. To quantify the genetic displacement between modern and historical diversity, we performed a principal component analysis (in PCAGEN, http://www2.unil.ch/popgen/softwares/pcagen.htm) on CR haplotype frequencies for populations defined according to published datasets (usually countries, table 1), with a minimum sample size of five individuals. We further computed pairwise Φst in Arlequin v. 3.5 [80].
We used haplotype diversity (Hd) as the main measure of genetic variation among European regions and populations for historical (before 1945) and modern (after 1990) times. This metric, computed as 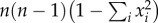 , where n corresponds to the sample size and xi the frequency of allele i, accounts for the relative allele frequencies (not only the number of alleles). Importantly, Hd is the most appropriate for European wolves as they do not show any phylogenetic structure, but rather frequency differences of population-specific, yet paraphyletic haplotypes (e.g. Italian and Iberian lineages). We also computed nucleotide diversity (π), which accounts for sequence divergence, for each European region/population in both modern and historical periods. We compared Hd, π and Φst between modern and historical datasets by paired, non-parametric Wilcoxon signed-rank tests; note that results should be taken with caution for Φst given the non-independence of pairwise genetic distances between populations.
Because our modern datasets feature greater sample sizes than the historical ones, we performed a resampling procedure to statistically test differences of Hd and π between epochs. To this end, we randomly subset the modern datasets with the sample sizes of the historical ones (10 000 replicates), and compared whether historical estimates fall within the 95% distribution of the resampled modern estimates.
Temporal trends of Hd were calculated by sliding window analyses for historical samples with accurate date information. We performed separate analyses for Western populations where persecutions led to total or nearly total extermination of the wolf (France, Switzerland, Spain, Portugal and Italy; n = 47), and Eastern populations where persecution had lesser demographic effects balanced by immigration from the east (Balkanic and Baltic countries, Poland, Czech Republic, Slovakia, Hungary, Romania, Finland, Russia, Turkey and Caucasus; n = 80). The sliding window analyses were performed on 30 years spans, allowing to have meaningful sample sizes over each span. Only sample sizes of n ≥ 5 were considered.
Supplementary Material
Supplementary Material
Supplementary Material
Acknowledgements
We warmly thank the numerous museums (and museum curators and technicians) and collections from all across Europe that provided historical samples for this study (detailed list available in electronic supplementary material, table S3). We also thank K. Parker and C. Ossola for help in the laboratory, T. Vincent for information about museum collections and S. Schmid for useful comments on previous versions of the manuscript.
Data accessibility
Haplotype sequences are deposited in GenBank under accession nos MH559214–MH559266.
Authors' contributions
L.F. and P.T. designed the study, supervised by L.F. L.F., C.M., N.R. and F.B. conducted labwork. L.F., C.D. and N.S. conducted the analyses. C.D. and L.F. drafted the manuscript, which was subsequently improved by all co-authors.
Competing interests
We declare we have no competing interests.
Funding
This study was funded by the University of Lausanne.
References
- 1.Frankham R, Ballou JD, Briscoe DA. 2010. Introduction to conservation genetics. Cambridge, UK: Cambridge University Press. [Google Scholar]
- 2.Frankham R. 2005. Genetics and extinction. Biol. Conserv. 126, 131–140. ( 10.1016/j.biocon.2005.05.002) [DOI] [Google Scholar]
- 3.Bolnick DL, Nosil P. 2007. Natural selection in populations subject to a migration load. Evolution 61, 2229–2243. ( 10.1111/j.1558-5646.2007.00179.x) [DOI] [PubMed] [Google Scholar]
- 4.Peisch S, Dupanloup I, Kirkpatrick M, Excoffier L. 2015. On the accumulation of deleterious mutations during range expansions. Mol. Ecol. 22, 5972–5982. ( 10.1111/mec.12524) [DOI] [PubMed] [Google Scholar]
- 5.Dufresnes C, Perrin N. 2015. Effect of biogeographic history on population vulnerability in European amphibians. Conserv. Biol. 29, 1235–1241. ( 10.1111/cobi.12490) [DOI] [PubMed] [Google Scholar]
- 6.Beaumont MA. 2010. Approximate Bayesian computation in evolution and ecology. Annu. Rev. Ecol. Evol. Syst. 41, 379–406. ( 10.1146/annurev-ecolsys-102209-144621) [DOI] [Google Scholar]
- 7.Schraiber JG, Akey JM. 2015. Methods and models for unravelling human evolutionary history. Nat. Rev. Genet. 16, 727–740. ( 10.1038/nrg4005) [DOI] [PubMed] [Google Scholar]
- 8.Excoffier L, Dupanloup I, Huerta-Sanchez E, Sousa VC, Foll M. 2013. Robust demographic inference from genomic and SNP data. PLoS Genet. 9, e1003905 ( 10.1371/journal.pgen.1003905) [DOI] [PMC free article] [PubMed] [Google Scholar]
- 9.Li H, Durbin R. 2011. Inference of human population history from individual whole-genome sequences. Nature 475, 493–496. ( 10.1038/nature10231) [DOI] [PMC free article] [PubMed] [Google Scholar]
- 10.Waters JM, Grosser S. 2016. Managing shifting species: ancient DNA reveals conservation conundrums in a dynamic world. BioEssays 38, 1177–1184. ( 10.1002/bies.201600044) [DOI] [PubMed] [Google Scholar]
- 11.Zimen E. 1978. Der wolf-mythos und verhalten. Munich, Germany: Meyster, Wien. [Google Scholar]
- 12.Mech DL, Boitani L. 2003. Wolves: behavior, ecology, and conservation. Chicago, IL: University of Chicago Press. [Google Scholar]
- 13.Breitenmoser U. 1998. Large predators in the Alps: the fall and rise of man's competitors. Biol. Conserv. 83, 279–289. ( 10.1016/S0006-3207(97)00084-0) [DOI] [Google Scholar]
- 14.Chapron G, et al. 2014. Recovery of large carnivores in Europe's modern human-dominated landscapes. Science 346, 1517–1519. ( 10.1126/science.1257553) [DOI] [PubMed] [Google Scholar]
- 15.Hindrikson M, et al. 2017. Wolf population genetics in Europe: a systematic review, meta-analysis and suggestions for conservation and management. Biol. Rev. 92, 1601–1629. ( 10.1111/brv.12298) [DOI] [PubMed] [Google Scholar]
- 16.Rauer G, Knauer F, Fumagalli L.. 2013. Austria—meeting place of three wolf populations: melting pot or black hole? In Wolf Conservation in a Human Dominated Landscape (eds Potocnik H, Razen N, Mulej J, Jelencic M, Bertoncelj I), p. 44. Postojna, Slovenia: University of Ljubljana, Biotechnical Faculty. [Google Scholar]
- 17.Pilot M, Branicki W, Jedrzejewski W, Goszczynski J, Jedrzejewska B, Dykyy I, Shkvyrya M, Tsingarska E. 2010. Phylogeographic history of grey wolves in Europe. BMC Evol. Biol. 10, 104 ( 10.1186/1471-2148-10-104) [DOI] [PMC free article] [PubMed] [Google Scholar]
- 18.De Groot GA, et al. 2016. Decades of population genetic research reveal the need for harmonization of molecular markers: the grey wolf Canis lupus as a case study. Mammal Rev. 46, 44–59. ( 10.1111/mam.12052) [DOI] [Google Scholar]
- 19.Flagstad O, Walker CW, Vila C, Sundqvist A-K, Fernholm B, Hufthammer AK, Wiig O, Koyola I, Ellegren H. 2003. Two centuries of the Scandinavian wolf population: patterns of genetic variability and migration during an era of dramatic decline. Mol. Ecol. 12, 869–880. ( 10.1046/j.1365-294X.2003.01784.x) [DOI] [PubMed] [Google Scholar]
- 20.Jansson E, Harmoinen J, Ruokonen M, Aspi J. 2014. Living on the edge: reconstructing the genetic history of the Finnish wolf population. BMC Evol. Biol. 14, 64 ( 10.1186/1471-2148-14-64) [DOI] [PMC free article] [PubMed] [Google Scholar]
- 21.Pilot M, Greco C, vonHoldt BM, Jedrzejewska B, Randi E, Jedrzejewski W, Sidorovich VE, Ostrander EA, Wayne RK. 2014. Genome-wide signatures of population bottlenecks and diversifying selection in European wolves. Heredity 112, 428–442. ( 10.1038/hdy.2013.122) [DOI] [PMC free article] [PubMed] [Google Scholar]
- 22.Fan Z, et al. 2016. Worldwide patterns of genomic variation and admixture in gray wolves. Genome Res. 26, 163–173. ( 10.1101/gr.197517.115) [DOI] [PMC free article] [PubMed] [Google Scholar]
- 23.Ersmark E, et al. 2016. From the past to the present: wolf phylogeography and demographic history based on the mitochondrial control region. Front. Ecol. Evol. 4, 134 ( 10.3389/fevo.2016.00134) [DOI] [Google Scholar]
- 24.Montana L, et al. 2017. Combining phylogenetic and demographic inferences to assess the origin of the genetic diversity in an isolated wolf population. PLoS ONE 12, e0176560 ( 10.1371/journal.pone.0176560) [DOI] [PMC free article] [PubMed] [Google Scholar]
- 25.Stiller M, et al. 2006. Patterns of nucleotide misincorporations during enzymatic amplification and direct large-scale sequencing of ancient DNA. Proc. Natl Acad. Sci. USA 103, 13 578–13 584. ( 10.1073/pnas.0605327103) [DOI] [PMC free article] [PubMed] [Google Scholar]
- 26.Randi E, Lucchini V, Christensen MF, Mucci N, Funk SM, Dolf G, Loeschcke V. 2000. Mitochondrial DNA variability in Italian and East European wolves: detecting the consequences of small population size and hybridization. Conserv. Biol. 14, 464–473. ( 10.1046/j.1523-1739.2000.98280.x) [DOI] [Google Scholar]
- 27.Lucchini V, Galov A, Randi E. 2004. Evidence of genetic distinction and long-term population decline in wolves (Canis lupus) in the Italian Apennines. Mol. Ecol. 13, 523–536. ( 10.1046/j.1365-294X.2004.02077.x) [DOI] [PubMed] [Google Scholar]
- 28.Valière N, Fumagalli L, Gielly L, Miquel C, Lequette B, Poulle ML, Weber JM, Arlettaz R, Taberlet P. 2003. Long-distance wolf recolonization of France and Switzerland inferred from non-invasive genetic sampling over a period of 10 years. Anim. Conserv. 6, 83–92. ( 10.1017/S1367943003003111) [DOI] [Google Scholar]
- 29.Fabbri E, et al. 2007. From the Apennines to the Alps: colonization genetics of the naturally expanding Italian wolf (Canis lupus) population. Mol. Ecol. 16, 1661–1671. ( 10.1111/j.1365-294X.2007.03262.x) [DOI] [PubMed] [Google Scholar]
- 30.Vila C, Amorim IR, Leonard JA, Posada D, Castroviejo J, Petrucci-Fonseca F, Crandall KA, Ellegren H, Wayne RK. 1999. Mitochondrial DNA phylogeography and population history of the grey wolf Canis lupus. Mol. Ecol. 8, 2089–2103. ( 10.1046/j.1365-294x.1999.00825.x) [DOI] [PubMed] [Google Scholar]
- 31.Sastre N, Vila C, Salinas M, Bologov VV, Urios V, Sanchez A, Francino O, Ramirez O. 2011. Signatures of demographic bottlenecks in European wolf populations. Conserv. Genet. 12, 701–712. ( 10.1007/s10592-010-0177-6) [DOI] [Google Scholar]
- 32.Matocq MD, Villablanca FX. 2001. Low genetic diversity in an endangered species: recent or historic pattern? Biol. Conserv. 98, 61–68. ( 10.1016/S0006-3207(00)00142-7) [DOI] [Google Scholar]
- 33.Leonard JA. 2008. Ancient DNA applications for wildlife conservation. Mol. Ecol. 17, 4186–4196. ( 10.1111/j.1365-294X.2008.03891.x) [DOI] [PubMed] [Google Scholar]
- 34.Orlando L, Cooper A. 2014. Using ancient DNA to understand evolutionary and ecological processes. Annu. Rev. Ecol. Evol. Syst. 45, 573–598. ( 10.1146/annurev-ecolsys-120213-091712) [DOI] [Google Scholar]
- 35.Leonard JA, Vila C, Wayne RK. 2005. Legacy lost: genetic variability and population size of extirpated US grey wolves (Canis lupus). Mol. Ecol. 14, 9–17. ( 10.1111/j.1365-294X.2004.02389.x) [DOI] [PubMed] [Google Scholar]
- 36.Horn S, et al. 2014. Ancient mitochondrial DNA and the genetic history of Eurasian beaver (Castor fiver) in Europe. Mol. Ecol. 23, 1717–1729. ( 10.1111/mec.12691) [DOI] [PubMed] [Google Scholar]
- 37.Larson S, Jameson RJ, Etnier M, Fleming M, Bentzen P. 2002. Loss of genetic diversity in sea otters (Enhydra lutris) associated with the fur trade of the 18th and 19th centuries. Mol. Ecol. 11, 1899–1903. ( 10.1046/j.1365-294X.2002.01599.x) [DOI] [PubMed] [Google Scholar]
- 38.Nyström V, Angerbjörn A, Dalen L. 2006. Genetic consequences of a demographic bottleneck in the Scandinavian arctic fox. Oikos 114, 84–94. ( 10.1111/j.2006.0030-1299.14701.x) [DOI] [Google Scholar]
- 39.Miller CR, Waits LP, Joyce P. 2006. Phylogeography and mitochondrial diversity of extirpated brown bear (Ursus arctos) populations in the contiguous United States and Mexico. Mol. Ecol. 15, 4477–4485. ( 10.1111/j.1365-294X.2006.03097.x) [DOI] [PubMed] [Google Scholar]
- 40.Xenikoudakis G, Ersmark E, Tison JL, Waits L, Kindberg J, Swenson JE, Dalen L. 2015. Consequences of a demographic bottleneck on genetic structure and variation in the Scandinavian brown bear. Mol. Ecol. 24, 3441–3454. ( 10.1111/mec.13239) [DOI] [PubMed] [Google Scholar]
- 41.Mondol S, Bruford MW, Ramakrishnan U. 2013. Demographic loss, genetic structure and the conservation implications for Indian tigers. Proc. R. Soc. B 280, 20130496 ( 10.1098/rspb.2013.0496) [DOI] [PMC free article] [PubMed] [Google Scholar]
- 42.Moodley Y, et al. 2017. Extinctions, genetic erosion and conservation options for the black rhinoceros (Diceros bicornis). Sci. Rep. 7, 41417 ( 10.1038/srep41417) [DOI] [PMC free article] [PubMed] [Google Scholar]
- 43.Weber DS, Stewart BS, Lehman N. 2004. Genetic consequences of a severe population bottleneck in the Guadalupe fur seal (Arctocephalus townsendi). J. Hered. 95, 144–153. ( 10.1093/jhered/esh018) [DOI] [PubMed] [Google Scholar]
- 44.Hoelzel RA, Fleischer RC, Campagna C, Le Bœuf BJ, Alvord G. 2002. Impact of population bottleneck on symmetry and genetic diversity in the northern elephant seal. J. Evol. Biol. 15, 567–575. ( 10.1046/j.1420-9101.2002.00419.x) [DOI] [Google Scholar]
- 45.Pichler FB, Baker CS. 2000. Loss of genetic diversity in the endemic Hector's dolphin due to fisheries-related mortality. Proc. R. Soc. Lond. B 267, 97–102. ( 10.1098/rspb.2000.0972) [DOI] [PMC free article] [PubMed] [Google Scholar]
- 46.Alter SE, Rynes E, Palumbi SR. 2007. DNA evidence for historic population size and past ecosystem impacts of gray whales. Proc. Natl Acad. Sci. USA 104, 15 162–15 167. ( 10.1073/pnas.0706056104) [DOI] [PMC free article] [PubMed] [Google Scholar]
- 47.Tsangaras K, Avila-Arcos M, Ishida Y, Helgen KM, Roca AL, Greenwood AD. 2012. Historically low mitochondrial DNA diversity in koalas (Phascolarctos cinereus). BMC Genet. 13, 92 ( 10.1186/1471-2156-13-92) [DOI] [PMC free article] [PubMed] [Google Scholar]
- 48.Menzies BR, Renfree MB, Heider T, Mayer F, Hildebrandt TB, Pask AJ. 2012. Limited genetic diversity preceded extinction of the Tasmanian tiger. PLoS ONE 7, e35433 ( 10.1371/journal.pone.0035433) [DOI] [PMC free article] [PubMed] [Google Scholar]
- 49.Bi K, Linderoth T, Vanderpool D, Good JM, Nielsen R, Moritz C. 2013. Unlocking the vault: next generation museum population genomics. Mol. Ecol. 22, 6018–6032. ( 10.1111/mec.12516) [DOI] [PMC free article] [PubMed] [Google Scholar]
- 50.Glenn TC, Stephan W, Braun MJ. 1999. Effects of a population bottleneck on whooping crane mitochondrial DNA variation. Conserv. Biol. 13, 1097–1107. ( 10.1046/j.1523-1739.1999.97527.x) [DOI] [Google Scholar]
- 51.Taylor SS, Jamieson IG, Wallis GP. 2007. Historic and contemporary levels of genetic variation in two New Zealand passerines with different histories of decline. J. Evol. Biol. 20, 2035–2047. ( 10.1111/j.1420-9101.2007.01362.x) [DOI] [PubMed] [Google Scholar]
- 52.Tracy LN, Jamieson IG. 2010. Historic DNA reveals contemporary population structure results from anthropogenic effects, not pre-fragmentation patterns. Conserv. Genet. 12, 517–526. ( 10.1007/s10592-010-0158-9) [DOI] [Google Scholar]
- 53.Draheim HM, Baird P, Hag SM. 2012. Temporal analysis of mtDNA variation reveals decreased genetic diversity in least terns. Condor 114, 145–154. ( 10.1525/cond.2012.110007) [DOI] [Google Scholar]
- 54.Savary R, Dufresnes C, Champigneulle A, Caudron A, Dubey S, Perrin N, Fumagalli L. 2017. Stocking activities for the Arctic charr in Lake Geneva: genetic effects in space and time. Ecol. Evol. 7, 5201–5211. ( 10.1002/ece3.3073) [DOI] [PMC free article] [PubMed] [Google Scholar]
- 55.Schmid S. 2016. Spatial and temporal genetic dynamics of the endangered grasshoper Oedaleus decorus revealed by museum specimens. Master thesis, University of Lausanne, Switzerland. [DOI] [PMC free article] [PubMed] [Google Scholar]
- 56.Ugelvid LV, Nielsen PS, Boomsma JJ, Nash DR. 2011. Reconstructing eight decades of genetic variation in an isolated Danish population of the large blue butterfly Maculinea arion. BMC Evol. Biol. 11, 201 ( 10.1186/1471-2148-11-201) [DOI] [PMC free article] [PubMed] [Google Scholar]
- 57.Razen N, et al. 2016. Long-distance dispersal connects Dinaric-Balkan and Alpine grey wolf (Canis lupus) populations. Eur. J. Wildl. Res. 62, 137–142. ( 10.1007/s10344-015-0971-z) [DOI] [Google Scholar]
- 58.Sharma DK, Maldonado JE, Jhala YV, Fleischer RC. 2004. Ancient wolf lineages in India. Proc. R. Soc. Lond. B 271, S1–S4. ( 10.1098/rsbl.2003.0071) [DOI] [PMC free article] [PubMed] [Google Scholar]
- 59.Aggarwal RK, Kivisild T, Ramadevi J, Singh L. 2007. Mitochondrial DNA coding region sequences support the phylogenetic distinction of two Indian wolf species. J. Zool. Syst. Evol. Res. 45, 163–172. ( 10.1111/j.1439-0469.2006.00400.x) [DOI] [Google Scholar]
- 60.Taberlet P, Bouvet J. 1994. Mitochondrial DNA polymorphism, phylogeography, and conservation genetics of the brown bear (Ursus arctos) in Europe. Proc. R. Soc. Lond. B 255,195–200. ( 10.1098/rspb.1994.0028) [DOI] [PubMed] [Google Scholar]
- 61.Fumagalli L, Taberlet P, Favre L, Hausser J. 1996. Origin and evolution of homologous repeated sequences in the mitochondrial control region of shrews. Mol. Biol. Evol. 13, 31–46. ( 10.1093/oxfordjournals.molbev.a025568) [DOI] [PubMed] [Google Scholar]
- 62.Wandeler P, Hoeck PEA, Keller LF. 2007. Back to the future: museum specimens in population genetics. Trends Ecol. Evol. 22, 634–642. ( 10.1016/j.tree.2007.08.017) [DOI] [PubMed] [Google Scholar]
- 63.Hofreiter M, Jaenicke V, Serre D, von Haeseler A, Pääbo S. 2001. DNA sequences from multiple amplifications reveal artifacts induced by cytosine deamination in ancient DNA. Nucleic Acids Res. 29, 4793–4799. ( 10.1093/nar/29.23.4793) [DOI] [PMC free article] [PubMed] [Google Scholar]
- 64.Randi E, et al. 2014. Multilocus detection of wolf × dog hybridization in Italy and guidelines for marker selection. PLoS ONE 9, e86409 ( 10.1371/journal.pone.0086409) [DOI] [PMC free article] [PubMed] [Google Scholar]
- 65.Jedrzejewski W, et al. 2005. Genetic diversity and relatedness within packs in an intensively hunted population of wolves Canis lupus. Acta Theriol. 50, 3–22. ( 10.1007/BF03192614) [DOI] [Google Scholar]
- 66.Gomercic T, Sindicic M, Galov A, Arbanasic H, Kusak J, Kocijan I, Gomercic MD, Huber D. 2010. High genetic variability of the grey wolf (Canis lupus L.) population from Croatia revealed by mitochondrial DNA control region sequences. Zool. Stud. 49, 816–823. [Google Scholar]
- 67.Hindrikson M, Männil P, Ozolins J, Krzywinski A, Saarma U. 2012. Bucking the trend in wolf-dog hybridization: first evidence from Europe of hybridization between female dogs and male wolves. PLoS ONE 7, e46465 ( 10.1371/journal.pone.0046465) [DOI] [PMC free article] [PubMed] [Google Scholar]
- 68.Baltrünaité L, Balciauskas L, Akesson M. 2013. The genetic structure of the Lithuanian wolf population. Cent. Eur. J. Biol. 8, 440–447. [Google Scholar]
- 69.Boggiano F, Ciofi C, Boitani L, Formia A, Grottoli L, Natali C, Ciucci P. 2013. Detection of an East European wolf haplotype puzzles mitochondrial DNA monomorphism of the Italian wolf population. Mamm. Biol. 78, 374–378. ( 10.1016/j.mambio.2013.06.001) [DOI] [Google Scholar]
- 70.Czarnomska SD, et al. 2013. Concordant mitochondrial and microsatellite DNA structuring between Polish lowland and Carpathian mountain wolves. Conserv. Genet. 14, 573–588. ( 10.1007/s10592-013-0446-2) [DOI] [Google Scholar]
- 71.Fabbri E, Caniglia R, Kusak J, Galov A, Gomercic T, Arbanasic H, Huber D, Randi E. 2014. Genetic structure of expanding wolf (Canis lupus) populations in Italy and Croatia, and the early steps of the recolonization of the Eastern Alps. Mamm. Biol. 79, 138–148. ( 10.1016/j.mambio.2013.10.002) [DOI] [Google Scholar]
- 72.Moura AE, Tsingarska E, Dabrowski MJ, Czarnomska SD, Jedrzejewska B, Pilot M. 2014. Unregulated hunting and genetic recovery from a severe population decline: the cautionary case of Bulgarian wolves. Conserv. Genet. 15, 405–417. ( 10.1007/s10592-013-0547-y) [DOI] [Google Scholar]
- 73.Pilot M, Dabrowski MJ, Hayrapetyan V, Yavruyan EG, Kopaliani N, Tsingarska E, Bujalska B, Kaminski S, Bogdanowicz W. 2014. Genetic variability of the grey wolf (Canis lupus) in the Caucasus in comparison with Europe and the Middle East: distinct or intermediary population. PLoS ONE 9, e93828 ( 10.1371/journal.pone.0093828) [DOI] [PMC free article] [PubMed] [Google Scholar]
- 74.Ibis O, Aksöyek E, Ozcan S, Keten A, Yorulmaz T, Tez C. 2016. Genetic analysis of the Turkish gray wolf (Canis lupus) based on partial mitochondrial DNA sequences. Vertebr. Zool. 66, 427–435. [Google Scholar]
- 75.Montana L, Caniglia R, Galaverni M, Fabbri E, Randi E. 2017. A new mitochondrial haplotype confirms the distinctiveness of the Italian wolf (Canis lupus) population. Mamm. Biol. 84, 30–34. ( 10.1016/j.mambio.2017.01.005) [DOI] [Google Scholar]
- 76.Pires AE, Amorim IR, Borges C, Simoes F, Teixeira T, Quaresma A, Petrucci-Fonseca F, Matos J. 2017. New insights into the genetic composition and phylogenetic relationship of wolves and dogs in the Iberian Peninsula. Ecol. Evol. 7, 4404–4418. ( 10.1002/ece3.2949) [DOI] [PMC free article] [PubMed] [Google Scholar]
- 77.Clement M, Posada D, Crandall KA. 2000. TCS: a computer program to estimate gene genealogies. Mol. Ecol. 9, 1657–1659. ( 10.1046/j.1365-294x.2000.01020.x) [DOI] [PubMed] [Google Scholar]
- 78.Guindon S, Gascuel O. 2003. PhyML: a simple, fast and accurate algorithm to estimate large phylogenies by maximum-likelihood. Syst. Biol. 52, 696–704. ( 10.1080/10635150390235520) [DOI] [PubMed] [Google Scholar]
- 79.Darriba D, Taboada GL, Doallo R, Posada D. 2012. jModelTest 2: more models, new heuristics and parallel computing. Nat. Methods 9, 772 ( 10.1038/nmeth.2109) [DOI] [PMC free article] [PubMed] [Google Scholar]
- 80.Excoffier L, Foll M, Petit RJ. 2005. Arlequin ver. 3.0: an integrated software package for population genetics data analysis. Evol. Bioinform. 1, 47–50. ( 10.1177/117693430500100003) [DOI] [PMC free article] [PubMed] [Google Scholar]
Associated Data
This section collects any data citations, data availability statements, or supplementary materials included in this article.
Supplementary Materials
Data Availability Statement
Haplotype sequences are deposited in GenBank under accession nos MH559214–MH559266.