

Abstract
Temperature is a strong driver of vector-borne disease transmission. Yet, for emerging arboviruses we lack fundamental knowledge on the relationship between transmission and temperature. Current models rely on the untested assumption that Zika virus responds similarly to dengue virus, potentially limiting our ability to accurately predict the spread of Zika. We conducted experiments to estimate the thermal performance of Zika virus (ZIKV) in field-derived Aedes aegypti across eight constant temperatures. We observed strong, unimodal effects of temperature on vector competence, extrinsic incubation period and mosquito survival. We used thermal responses of these traits to update an existing temperature-dependent model to infer temperature effects on ZIKV transmission. ZIKV transmission was optimized at 29°C, and had a thermal range of 22.7°C–34.7°C. Thus, as temperatures move towards the predicted thermal optimum (29°C) owing to climate change, urbanization or seasonality, Zika could expand north and into longer seasons. By contrast, areas that are near the thermal optimum were predicted to experience a decrease in overall environmental suitability. We also demonstrate that the predicted thermal minimum for Zika transmission is 5°C warmer than that of dengue, and current global estimates on the environmental suitability for Zika are greatly over-predicting its possible range.
Keywords: mosquito, arbovirus, temperature, Aedes aegypti, Zika
1. Introduction
Mosquito-borne viruses are an emerging threat impacting human health and well-being. Epidemics of dengue (DENV), chikungunya (CHIKV) and Zika (ZIKV) have spilled out of Africa to spread explosively throughout the world creating public health crises. Worldwide, an estimated 3.9 billion people living within 120 countries are at risk [1]. In 2015–2016, ZIKV spread throughout the Americas including the continental United States (US), resulting in over 360 000 suspected cases, with probably many more undetected [2]. With the rise of neurological disorders and birth defects, such as Guillain–Barré and congenital Zika virus syndrome [3,4], ZIKV became widely feared and was declared a ‘public health emergency of international concern’ by the World Health Organization in 2016 [5]. In spite of growing research efforts to develop new therapeutics, vaccines and innovative mosquito control technologies, mitigating arbovirus disease spread still depends on conventional mosquito control methods and public education. Thus, substantial efforts have been made to predict how ZIKV will spread seasonally, geographically, and with the effects of climate change (e.g. [6–9]).
There are several key gaps that potentially affect our ability to predict, and ultimately, mitigate the factors that influence transmission risk and arbovirus emergence globally. First, current models predicting mosquito distributions or virus transmission are often limited by a relatively poor understanding of the relationships among mosquito vectors, pathogens and the environment. There is substantial evidence that temperature variability is a key driver of disease transmission across diverse vector-borne pathogen systems (e.g. [8,10,11]). Mosquitoes are small ectothermic animals and their physiology [12,13], life history [8,14] and vectorial capacity [10,15,16] exhibit unimodal responses to changes in temperature. Transmission depends in large part on the ability of mosquitoes to survive the extrinsic incubation period (EIP), become infectious, and bite new hosts, so differential (unimodal) impacts of temperature on survival, vector competence, and EIP have highly nonlinear effects on transmission. Warmer temperatures do not necessarily translate into more infectious mosquitoes [8,17]. Second, current models often ignore the low quality and quantity of existing data. Even in systems that are fairly well-studied (e.g. Plasmodium falciparum and DENV), key parameters are often estimated from only a few studies. Finally, current transmission models often assume, with little justification, that the relationship between temperature and EIP is monotonic [18], or that the relationships between temperature, EIP, and vector competence of less-studied arboviruses (e.g. CHIKV and ZIKV) are similar to DENV [8,9,19,20].
To advance our fundamental scientific understanding of the relationship between temperature and ZIKV transmission, we conducted a series of laboratory experiments to estimate the thermal performance of ZIKV (vector competence, the extrinsic incubation rate, and the daily per capita mosquito mortality rate) in field-derived Aedes aegypti across eight different constant temperatures ranging from 16°C to 38°C. We fit a series of nonlinear functions to estimate the thermal responses of the above traits. These thermal responses were incorporated into a temperature-dependent basic reproductive number (R0) model developed for Ae. aegypti and DENV [14] to infer how temperature variation will impact ZIKV transmission.
2. Methods
(a). Experimental mosquito infections and forced salivations
For details on virus culture and mosquito rearing, see the electronic supplementary material, Methods and Results. For each biological replicate, we separated 8000 1 to 3-day-old females (field derived Ae. aegypti, F4 generation) and held them for 48 h prior to ZIKV infection (electronic supplementary material, figure S1). Mosquitoes were kept in 1.8 l paper cups and provided with water, which was withdrawn 12 h before feeding. We offered 3–5 day old mosquitoes either an infectious blood meal containing ZIKV at a final concentration of 106 plaque forming units (PFU) ml−1 or an uninfected, control blood meal. The blood meal was prepared by washing human blood three times in Roswell Park Memorial Institute medium and the pelleted red blood cells (50%) were resuspended in 33% Delbecco's modified Eagle medium (DMEM), 20% fetal bovine serum (FBS), 1% sucrose, and 5 mmol l−1 ATP. For the infectious blood meal, we mixed the blood mixture with ZIKV diluted in DMEM (2 × 10⁶ PFU ml−1) at a 1 : 1 ratio. Mosquitoes were blood-fed through a water-jacketed membrane feeder for 30 min, after which we randomly distributed 2000 ZIKV-exposed engorged mosquitoes and 2000 unexposed blood-fed control mosquitoes into mesh-covered paper cups (250 mosquitoes per cup). We then placed one ZIKV-exposed and one control cup at each temperature treatment (Percival Scientific): 16°C, 20°C, 24°C, 28°C, 32°C, 34°C, 36°C and 38°C ± 0.5°C. Chambers were set to 80% ± 5% relative humidity and a 12 : 12 light : dark cycle, and mosquitoes were maintained on 10% sucrose for the duration of the experiment. Mosquito mortality was monitored and recorded daily.
Every three days (up to day 21) we force-salivated 20 ZIKV-exposed mosquitoes per treatment group by immobilizing mosquitoes on ice, removing their legs and wings, and placing the proboscis of each mosquito into a pipet tip (containing 35 µl FBS with 3 mmol l−1 ATP) for 30 min on a 35°C warming plate. After salivation, we collected mosquito saliva, heads and legs, and bodies into 700 µl of DMEM with 1× antibiotic/antimycotic. Each tissue was homogenized in a QIAGEN TissueLyzer at 30 cycles s−1 for 30 s, and centrifuged at 17 000g for 5 min at 4°C. To measure the proportion of mosquitoes that became infected, disseminated infection, and became infectious at each temperature, we tested for the presence/absence of ZIKV in mosquito bodies, legs and heads, and saliva, respectively, using plaque assays on Vero cells (Methods and Results in the electronic supplementary material). Two full biological replicates were performed (electronic supplementary material, figure S1).
(b). Statistical analysis
Generalized linear model (GLMM) analysis was used to estimate the effects of temperature (T; 16°C, 20°C, 24°C, 28°C, 32°C, 34°C, 36°C, 38°C) and days post infection (dpi; 3, 6, 9, 12, 15, 18, 21) on the probability of successful mosquito infection (proportion of mosquitoes with positive bodies), dissemination (proportion of mosquitoes with positive legs and heads), and becoming infectious (proportion of mosquitoes with positive saliva) after being exposed to a ZIKV infectious blood meal. We also used GLMM analysis to estimate the probability of becoming infectious after successful ZIKV infection (proportion of mosquitoes with positive bodies) as a measure of dissemination efficiency. As our response variables were presence or absence of virus in a particular tissue, we constructed our GLMM using a binomial distribution and logit link function. The covariates temperature and dpi were centred by subtracting the mean and scaled by dividing by the standard deviation (SD). To account for differences in ZIKV infection metrics owing to mosquito cohort, we used a random intercept for mosquito cohort in each analysis. Because a diversity of organismal traits exhibit nonlinear, unimodal relationships with temperature [8,21], and we observe non-monotonic effects of dpi on some of our response variables in specific temperature treatments, we incorporated a polynomial function into our statistical model to accommodate this non-linearity. We evaluated a series of eight candidate models which varied in fixed effects structure from a ‘base model’ with only linear fixed effects of temperature and dpi to a ‘full’ model, which included temperature and dpi polynomial terms that were squared (T2 and dpi2) and their interactions (R Core Team, 2018 [22], package lme4 [23]). We selected the most parsimonious model using the Akaike information criterion with a sample size correction (AICc). Finally, to estimate the effects of temperature, ZIKV exposure, and their interaction on the daily probability of mosquito survival, we used a Cox proportional hazards model (SAS® Studio, 3.6 Basic Edition) with temperature, infection status (ZIKV-exposed or control), and their interaction as fixed factors, with mosquito batch as a random factor.
(c). Mechanistic R0 model
In previous work, we assembled trait thermal response estimates from laboratory experiments that manipulated temperature and measured each of the following traits for Ae. aegypti and DENV: egg-to-adult development rate (MDR), survival probability (pEA), fecundity (EFD; eggs per female per day), biting rate (a), adult mosquito mortality rate (μ), extrinsic incubation rate (EIR), and vector competence (bc; equal to the proportion of exposed mosquitoes that become infected times the proportion of infected mosquitoes that become infectious, with virus in their saliva). We then synthesized them into an estimate for the thermal response of R0, the expected number of new cases generated by a single infectious person or mosquito introduced into a fully susceptible population throughout the period within which the person or mosquito is infectious [8]:
 |
where N is the density of humans, r is the human recovery rate and (T) indicates parameters that are dependent on environmental temperature, T. Here, we update three of these thermal response functions—average adult mosquito lifespan (lf = 1/μ), EIR and bc—using the new experimental data from Ae. aegypti mosquitoes exposed to ZIKV-infected blood meals across a range of constant temperatures (see Methods and Results in the electronic supplementary material).
This expression for temperature-dependent R0 assumes a constant temperature to calculate the per-generation rate of increase of a pathogen in a fully susceptible population. However, environmental temperatures in nature are variable, which affects the calculation and interpretation of R0 [24–28]. Here, as in previous work [8,15], we use relative R0 as a simple metric for the relative suitability of temperature for transmission, rather than as an absolute metric for secondary case distributions, invasion and extinction thresholds, or expected equilibrium prevalence [29–31]. The relative R0 approach allows us to estimate the thermal optimum and limits, at which R0 is maximized or goes to zero, respectively, and compare them to a similar model previously parametrized for DENV [8]. Because our estimate of R0(T) is relative (rescaled to range from zero to one), we cannot estimate the stable transmission threshold R0(T) > 1, so we instead use the more conservative suitability threshold R0(T) > 0. At temperatures outside of this suitable range transmission is impossible because one or more processes necessary for transmission has gone to zero.
(d). Mapping seasonal transmission range
To illustrate predicted temperature suitability for Zika transmission in the Americas, we mapped the number of months for which R0(T) > 0 for the posterior median response, based on the temperature-dependent model derived here and previously [8]. This conservative threshold of R0(T) > 0 illustrates all pixels in which transmission is theoretically possible (given that the mosquito and pathogen are present), but not necessarily stable. We calculated R0(T) at 0.1°C increments and projected it onto the landscape for monthly mean current temperatures from WorldClim data at a 5 min resolution (approximately 10 km2 at the equator). This calculation gives a snapshot of the relative temperature suitability for transmission in each pixel each month, but does not account for the influence of short- or long-term variation in temperature. Climate data layers were extracted for the geographical area and defined using the Global Administrative Boundaries Databases [32]. All map calculations and manipulations were run in R using packages ‘raster’ [33], ‘maptools’ [34] and ‘Rgdal’ [35], following methods described in [36]. Resulting GeoTiffs were rendered in ArcGIS 10.3.1 [37], and mapped as figures. We display the difference between a previous model parametrized on the Ae. aegypti–DENV system [8] and our current predictions. This model was then validated using spatially explicit ZIKV case records from Columbia reported at the municipality level [38,39] (see Methods and Results in the electronic supplementary material).
3. Results
Our GLMM analysis found that our data and response variables (probability of infection, dissemination, infectiousness and dissemination efficiency) were best explained by temperature, dpi and their interaction. Further, the best model for all of our response variables was the full model (electronic supplementary material, tables S1 and S2) containing both linear and squared terms for temperature and dpi, as well as their interactions. This model captured the observed delayed ZIKV infection dynamics at the cool temperatures and the observed declines in ZIKV infection over time in the warmer temperature treatments owing to increased mosquito mortality. Our best model suggests that the effects of temperature and dpi combine to shape relative R0 (i.e. predicted risk of transmission for ZIKV), which differs from previous estimates generated from DENV-specific models.
(a). The effect of temperature on Zika virus infection and infection dynamics
We observed strong, unimodal effects of temperature on the number of mosquitoes infected, with disseminated infections, and that became infectious (figure 1; electronic supplementary material, table S1). While all three response variables dropped at both cool and warm temperatures, this decrease was more pronounced as the infection progressed (figure 1). The likelihood of becoming infected was the most permissive to temperature variation, with the number of infected mosquitoes minimized at 16°C (6%), maximized from 24°C–34°C (75%–89%), and again minimized at 38°C (7%). The likelihood of viral dissemination was more constrained, with the probability of mosquitoes disseminating infections minimized at 16–20°C (4%–3%), maximized at 28–34°C (65%–77%), and again minimized at 38°C (5%). Finally, the likelihood of mosquitoes becoming infectious was the most sensitive to temperature, with the probability of mosquitoes becoming infectious minimized from 16°C to 24°C (0%–4%), maximized between 28°C and 34°C (23%–19%), and again minimized from 36°C to 38°C (5%–0.4%).
Figure 1.
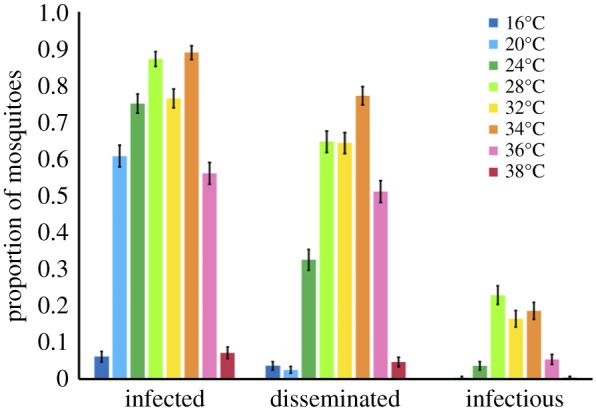
Temperature effect on the proportion of mosquitoes infected, with disseminated infections, and infectious. The effect of eight different constant temperatures (16°C, 20°C, 24°C, 28°C, 32°C, 34°C, 36°C, 38°C) on the proportion of mosquitoes infected (ZIKV positive bodies compared to total number of exposed), with disseminated infections (ZIKV positive heads compared to total number exposed), and infectious (ZIKV positive saliva compared to total number exposed).
Temperature also affected the rate of ZIKV infection, dissemination, and detection in saliva (figure 2; electronic supplementary material, table S1). In general (with the exception of 36°C and 38°C), we observed an increase in the probability of mosquitoes with ZIKV in the bodies, legs and heads, and saliva with time (figure 2) suggesting that rate of ZIKV detection in these samples decreased with increasing temperature. However, at 36°C and 38°C, we see declines in these response variables with dpi owing to high mosquito mortality.
Figure 2.
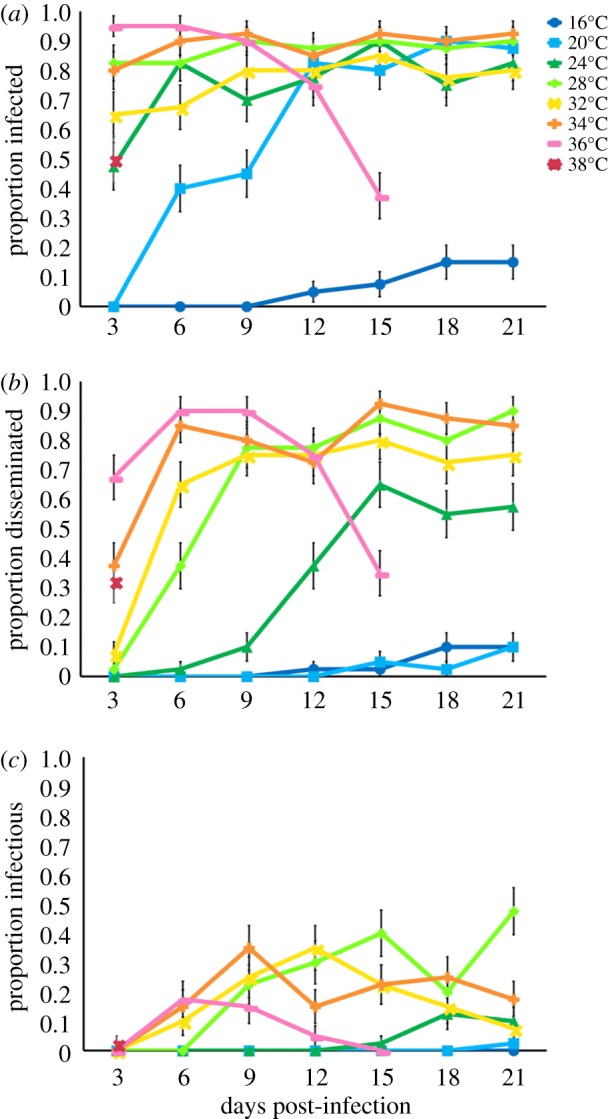
Days post-infection and the proportion of mosquitoes infected, with disseminated infections, and infectious. The relationship between days post-infection (3, 6, 9, 12, 15, 18, 21) and the proportion of mosquitoes infected (a, ZIKV positive bodies), with disseminated infections (b, ZIKV positive legs and heads), and infectious (c, ZIKV positive saliva) out of the total mosquitoes exposed to ZIKV at eight different constant temperatures (16°C, 20°C, 24°C, 28°C, 32°C, 34°C, 36°C, 38°C).
(b). The effects of temperature on Zika virus dissemination efficiency
We observed effects of temperature, dpi and their interaction on the dissemination efficiency of ZIKV (the probability of becoming infectious after successful ZIKV infection–positive bodies; electronic supplementary material, table S2). ZIKV dissemination efficiency was maximized from 28°C to 34°C, suggesting that ZIKV infection process (e.g. escape from the midgut and salivary gland invasion) was most efficient at these temperatures (electronic supplementary material, figure S2). By contrast, dissemination efficiency was minimized at both cooler (16–20°C) and warmer temperatures (38°C). Cooler temperatures had a more dramatic effect on dissemination efficiency than warmer temperatures. Although 60% of exposed mosquitoes became successfully infected at 20°C, we had very low salivary gland invasion, with only one mosquito across both trials becoming infectious. By contrast, at warm temperatures infection and dissemination efficiencies were very robust (electronic supplementary material, figure S3), but the mortality associated with the warm temperatures resulted in low numbers of mosquitoes that were capable of being infectious. Finally, of those successfully infected, we observed successful salivary gland invasion to occur earlier in the infection process as temperatures warmed (electronic supplementary material, figure S2).
(c). The effect of temperature on mosquito survival
We observed effects of temperature and an interaction between temperature and ZIKV exposure on the daily probability of mosquito survival (electronic supplementary material, figure S4 and table S3). Overall, the daily probability of mosquito survival was highest for mosquitoes housed at 24°C and 28°C relative to cooler (16–20°C) and warmer (32–38°C) temperatures. Mosquito survival was lowest at the warmest temperature of 38°C, with no mosquitoes surviving past 3 dpi. ZIKV-exposed mosquitoes experienced a higher daily probability of survival at 24°C and 28°C relative to unexposed, control mosquitoes with greater than 90% daily survival at the optimal temperatures.
(d). The effect of temperature on Zika virus transmission risk
Trait thermal responses for lifespan, vector competence and extrinsic incubation rate were all unimodal (figure 3; electronic supplementary material, table S4 and figure S5). Mosquito lifespan and vector competence thermal responses were symmetrical, peaking at 24.2°C (95% credible interval (CI): 21.9–25.9°C) and 30.6°C (95% CI: 29.6–31.4°C), respectively, while the extrinsic incubation rate thermal response was asymmetrical with a peak at 36.4°C (95% CI: 33.6–39.1°C). Applying these new trait thermal responses to the R0(T) model [8], we found that R0(T) peaked at 28.9°C (95% CI: 28.1–29.5°C), with lower and upper limits of 22.7°C (95% CI: 21.0–23.9°C) and 34.7°C (95% CI: 34.1–35.8°C), respectively (figure 4). The seasonal transmission of ZIKV was predicted to be more constricted in latitudinal range from this temperature–transmission relationship than what has been predicted previously [8], primarily because the predicted thermal minimum for ZIKV was 5°C warmer than for DENV (figure 4). This represents a 4.3 million km2 estimated change in endemic (12 month, year-round suitability) land area, and a 6.03 million km2 change in overall predicted range (1–12 months suitability) in the Americas (figure 5).
Figure 3.

Effect of temperature and estimated vector competence, extrinsic incubation rate and mosquito lifespan. Trait thermal responses, fitted from laboratory experimental data. Vector competence (a), is the average proportion of virus-exposed mosquitoes with virus in their saliva, across temperatures and replicates. Extrinsic incubation rate (b) is the inverse of the time required to reach half of the average proportion infectious (days−1) for each temperature and replicate. Lifespan is the average lifespan of mosquitoes in each temperature and replicate (days), shown in filled (virus-exposed) and open (sham-inoculated) points. Solid lines represent posterior means; dashed lines represent 95% credible intervals.
Figure 4.
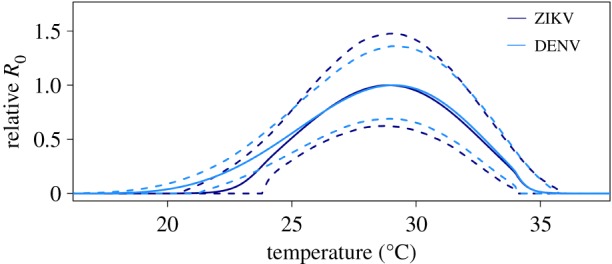
Effect of temperature on R0. Effect of temperature on relative R0 for DENV (light blue) and ZIKV (dark blue). Solid lines represent the mean and dashed lines are the 95% credible intervals.
Figure 5.

Months of transmission suitability in the Americas. The number of months of transmission suitability (R0 > 0) for DENV derived in Mordecai et al. [8] (a) and ZIKV derived in this study (b), for median (posterior 50th percentile) models.
The spatial validation for Columbia showed that 71.5% (67 934) of all Zika cases fell within 1–12 months of predicted suitability, with 68% (64 286) ZIKV cases overlaid areas predicted to have 12 months of suitability. By contrast, our spatial validation predicted 28.5% (27 041) ZIKV cases to occur in areas predicted to be unsuitable for transmission (0 months of suitability, electronic supplementary material, figure S7). Upon visual inspection, large clusters of cases occurred in valleys where the R0 model predicted transmission suitability.
While there is some evidence that mosquito longevity varies for virus-exposed versus control mosquitoes, where unexposed mosquitoes had shorter lifespans at near-optimal temperatures (24°C and 28°C; figure 3; electronic supplementary material, figure S4), we did not include this difference in the R0 model for two reasons. First, with limited data to parametrize the low temperature range for survival, we are unable to characterize the differences in the lower end of the thermal response functions in detail. Second, the standard R0 model does not incorporate differences in survival for infected versus uninfected mosquitoes because it assumes that the pathogen is rare and that all mosquitoes are uninfected. For this reason, we fit a single thermal response function for lifespan to the full dataset and used it in the R0 model.
4. Discussion
The dynamics and distribution of vector-borne diseases depend on the interplay between the pathogen, the mosquito and the environment [40]. Temperature is a strong driver of vector-borne disease transmission, and characterizing the thermal range and optimum for transmission is essential for accurately predicting how arbovirus emergence and transmission will be affected by seasonality, geography, climate and land use change. Yet current models of recently emerging arboviruses like ZIKV are constrained by a lack of data on the thermal sensitivity of key pathogen traits (e.g. [6,7,9]). In this study, we experimentally estimated the relationship between temperature and measures of ZIKV vector competence, extrinsic incubation rate, and mosquito mortality. By incorporating these temperature-trait relationships into an existing mechanistic model, we demonstrate that, like malaria [15,41] and DENV virus [8], ZIKV transmission has a strong unimodal relationship with temperature.
As studies have demonstrated in other arbovirus systems, temperature significantly affects vector competence [16,42,43]. We show that temperature has a unimodal relationship with vector competence, with an estimated optimum at 30.6°C and an estimated thermal minimum and maximum of 22.9°C and 38.4°C, respectively (based on posterior median estimates for T0 and Tm). ZIKV infectiousness was limited by different mechanisms at the thermal minimum and maximum. Cool temperatures limited midgut escape and dissemination, resulting in a lower proportion of the mosquito population that was infectious. This could be owing to temperature effects on mosquito physiology [44], immunity [12,45], and viral binding to specific receptors in the midgut, secondary tissues, and salivary glands [46]. Warmer temperatures, on the other hand, were very permissive for ZIKV infection, resulting in 95% and 100% infection among surviving mosquitoes at 36°C and 38°C, respectively (electronic supplementary material, figure S3). However, high mosquito mortality at these temperatures constrained the proportion of the mosquito population that became infectious (figure 2; electronic supplementary material, figure S3) A similar nonlinear effect of cool and warm temperatures on vector competence was observed with Ae. albopictus infected with DENV-2 [47]. By contrast, Adelman et al. [13] demonstrated that cooler temperatures in the larval stage resulted in increased susceptibility to CHIKV and yellow fever virus by impairing the RNAi pathway. However, mosquitoes in our study were exposed to different constant temperatures in the adult stage. Temperature variation experienced in both the larval and adult stage will probably be important in shaping mosquito and pathogen traits comprising arbovirus transmission.
We also observed an asymmetrical unimodal relationship between temperature and the extrinsic incubation rate of ZIKV, with the extrinsic incubation rate optimized at 36.4°C and minimized at 19.7°C and 42.5°C (based on posterior median estimates for T0 and Tm). Consistent with previous studies (e.g. [43,47,48]), we show that the extrinsic incubation rate of ZIKV increased with warming temperatures, with no infectious mosquitoes observed at 16°C after 21 days post infection and the first infectious mosquito detected at day 3 post infection at 38°C. The extrinsic incubation rate was ultimately constrained at the warmer temperatures owing to high mosquito mortality. This is not surprising as metabolic reaction rates tend to increase exponentially to an optimal temperature, then decline rapidly owing to protein degradation and other processes [21,49].
The optimal temperature for mosquito fitness and viral dissemination need not be equivalent, and the impacts of temperature on mosquito mortality relative to the extrinsic incubation rate of arboviruses strongly affect the total proportion of the mosquito population that is alive and infectious [50,51]. In our study, mosquito lifespan was optimized at 24.2°C and minimized at 11.7°C and 37.2°C, respectively (based on posterior median estimates for T0 and Tm). The nonlinear relationship between metrics of mosquito mortality or lifespan and temperature has also been demonstrated for Ae. aegypti [8], Aedes albopictus [8,14] and various Anopheles spp. [15,52]. Despite the fact that the extrinsic incubation rate was optimized at a warm temperature (36.4°C), the optimal temperature for overall ZIKV transmission (R0) was predicted to be cooler (28.9°C) because mosquitoes experience a shortened lifespan above 32°C. By contrast, even though mosquitoes are predicted to have relatively longer lifespans at cooler temperatures, the time required for mosquitoes to become infectious (greater than 21 days at 16°C and 18 days at 20°C) may be longer than most mosquitoes experience in the field. As a result, large vector populations may not be sufficient for transmitting the virus if viral replication is inhibited or if the lifespan of the mosquito is shorter than the extrinsic incubation period [53]. One surprising result was that mosquitoes exposed to ZIKV were predicted to live significantly longer than unexposed mosquitoes at temperatures already optimal for mosquito survival (37 versus 87 days at 24°C; 45 versus 54 days at 28°C). A similar phenomenon has been noted in the Ae. aegypti–DENV-2 system [54]. Additionally, the temperature that optimizes mosquito lifespan might also vary between ZIKV exposed mosquitoes (24°C) and their uninfected counterparts (28°C). However, more data characterizing mosquito survival of uninfected and ZIKV exposed mosquitoes at the cool range of transmission are needed to better understand the consequences of survival differences between ZIKV infected and uninfected mosquitoes. If temperature consistently has different effects on the mortality rates of uninfected and infected mosquitoes in other arbovirus systems, current modelling efforts may be underestimating virus transmission potential under certain environmental scenarios and estimating mosquito mortality in the field for mosquitoes of different infection statuses are important areas for future research.
After incorporating the relationships between temperature and vector competence, the EIR, and mosquito lifespan into a mechanistic model, we demonstrated that ZIKV transmission is optimized at a mean temperature of approximately 29°C, and has a thermal range of 22.7°C to 34.7°C. Because this relationship is nonlinear and unimodal, we can expect as temperatures move toward the thermal optimum owing to future climate change or increasing urbanization [55], environmental suitability for ZIKV transmission should increase, potentially resulting in expansion of ZIKV further north and into longer seasons. There is evidence that this is already occurring with warming at high elevations in the Ethiopian and Columbian highlands leading to increased incidence of malaria [11]. By contrast, in areas that are already permissive and near the thermal optimum for ZIKV transmission, future warming and urbanization may lead to decreases in overall environmental suitability [17]. Accurately estimating the optimal temperature for transmission is thus paramount for predicting where climate warming will expand, contract, or shift transmission potential.
By using a mechanistic model originally parametrized for DENV (data from serotypes 1 and 2), we also explored a common assumption made by multiple models that DENV transmission has a similar relationship with temperature as ZIKV [6–9,20]. While the temperature optimum and maximum for R0 changed very little from our previous DENV R0 model, the temperature minimum for transmission increased by nearly five degrees in the ZIKV-specific model (figure 4). This is mainly owing to a higher thermal minimum for both vector competence and the extrinsic incubation rate for ZIKV as compared to DENV (electronic supplementary material, figure S6). Differences in the thermal niche of ZIKV relative to DENV or our field derived Ae. aegypti relative to those populations synthesized in Mordecai et al. [8] could explain this difference. There is evidence that the effects of environmental variation on disease transmission are often modified by the genetic background of the mosquito and infecting pathogen [42,56,57]. Thus, more work is required to validate the generalizability of these models.
Our mapped seasonal ranges underscore the impact of a more refined empirical derivation of a pathogen-specific temperature dependent R0, contrasted with the Ae. aegypti DENV prediction of previous studies [6–8]. The higher predicted thermal minimum for ZIKV resulted in a contraction in the areas of the Americas where year-round, endemic transmission suitability (12 months only) are predicted to occur. This area corresponds to a change of approximately 4.3 million km2 in land area (figure 5). Additionally, this higher thermal minimum contributes to a reduction in the overall estimated suitability for ZIKV transmission (all 1–12 months of transmission) resulting in an estimated difference of 6.03 million km2. In particular, in the Florida peninsula where the primary focus of ZIKV cases within the US occurred, our updated model (the median model—50th percentile posterior) now predicts only around six months of temperature suitability during the year (figure 5) versus almost year-round as predicted by a previous temperature-dependent R0 model parametrized on the Ae. aegypti–DENV system [8]. This contrast in seasonal suitability where ZIKV established in the USA is striking, and emphasizes the value of increasing empirical data and re-examining these types of models, as the capacity to do so becomes possible, in the face of an emerging epidemic. This result also largely concurs with a previous study that generated an R0 ZIKV map of the Americas using a spatially explicit individual based susceptible, exposed, infected–susceptible, exposed, infected, recovered compartmental model. This model incorporates unimodal temperature-trait relationships for mosquito lifespan, probability of transmission parametrized from the DENV-Ae. aegypti system, and mosquito abundance with pre-existing data layers for Ae. aegypti and Ae. albopictus distributions, spatially explicit human population and economic data, and ZIKV case data [20]. While our models generally agree in the geographical extent to which ZIKV transmission is predicted to occur in the Americas, Zhang et al. show more heterogeneity in R0 across space than our model would predict, which simply describes the temperature boundaries for potential ZIKV transmission on the landscape. However, our model, which uses a broader life-history explicit parametrization including ZIKV-specific thermal responses for relevant transmission, provides important validation of the predictions in Zhang et al. [20].
Our spatial validation of this model revealed fairly robust predictive qualities (electronic supplementary material, figure S7), despite limitations of spatial resolution and scale at which ZIKV cases are reported. For example, aggregating at the municipality scale created a much larger minimum areal unit than the model pixels. Further, this region is subject to high variation in local conditions owing to the Andes climate, which are probably not accurately captured by global temperature model outputs. Thus, we might expect the R0 model to over or under predict fine-scale variation in local microclimate [54]. Regardless, this highlights a need for more spatially detailed health datasets to be available to this type of model validation exercise, as well as regionalized modelling efforts in climate-health initiatives.
Finally, although we estimated the effects of mean constant temperatures on ZIKV transmission, mosquitoes and their pathogens live in a variable world where temperatures fluctuate daily and seasonally. Temperature-trait relationships have been shown to differ in fluctuating environments relative to constant temperature environments (e.g. [17,58,59]). While characterizing trait responses to mean constant temperatures and incorporating these relationships into models of disease transmission is tractable, more effort is needed in validating computational approaches to infer transmission in a fluctuating environment (i.e. rate summation [8,60]).
Accurately predicting arbovirus transmission will be influenced by variation in other sources of abiotic (e.g. relative humidity, rainfall), biotic (e.g. availability and quality of oviposition and resting habitats), and socioeconomic factors that influence human exposure to biting mosquitoes [20]. However, this is a fundamental first step for empirically defining and validating current models on the environmental suitability for ZIKV transmission, in which temperature will be a strong driver. R0 models have been used as a tool to guide vector-borne disease interventions, and represent a comprehensive metric of pathogen fitness. We anticipate, as with other vector-borne diseases, that environmental suitability for ZIKV transmission could expand northwards with future warming, but will be more constrained than DENV at low temperatures. We also predict areas that are already at or near the thermal optimum of 29°C to experience a decrease in environmental suitability for ZIKV transmission [15,17]. Further, land use change that modifies the microclimates mosquitoes experience and human density and exposure could have immediate impacts on ZIKV transmission, which might explain the explosive spread of ZIKV in urban centres throughout the Americas.
Supplementary Material
Supplementary Material
Acknowledgements
We thank the University of Texas Medical Branch Arbovirus Reference Collection for providing the virus. We thank Dr Américo Rodríguez from the Instituto Nacional de Salud Pública for providing mosquito eggs. We gratefully acknowledge the members of the Murdock and Brindley labs for thoughtful comments on the project and manuscript, and Gregory R. Jacobs and Michelle Evans for feedback and coding help associated with the statistical analysis and model validation. Its contents are solely the responsibility of the authors and do not necessarily represent the official views of the Centers for Disease Control and Prevention. Any opinions, findings, and conclusions or recommendations expressed in this material are those of the authors and do not necessarily reflect the views of the National Science Foundation.
Ethics
No humans or vertebrate animals were used throughout the course of this study. All methods within this manuscript have received approval from the University of Georgia's Office of Biosafety (IBC protocol numbers: 2015-0022 and 2015-0039).
Data accessibility
Data and code are available from the Dryad Digital Repository: http://dx.doi.org/10.5061/dryad.7hj6q4c [61].
Authors' contributions
B.T. was involved in experimental design, execution, data analysis, and writing this manuscript, L.R.D. was involved in executing this experiment, E.A.M. helped secure funding for this study, fit thermal performance curves using Bayesian inference, developed the R0 model, and was involved in the writing of this manuscript, S.J.R. generated the figure maps using the thermally dependent R0 model, led the spatial validation of those maps, and contributed to writing this manuscript, M.H.B. and C.N.N. helped secure funding for this project and were involved in the writing of this manuscript, M.A.B. helped secure funding and was involved in experimental design, execution, and writing of this manuscript, and C.C.M. led in securing funding for this project, conceptualizing the experimental design, execution, data analysis, and writing of this manuscript.
Competing interests
We declare that we have no competing interests.
Funding
This study was supported by the National Science Foundation, Grants for Rapid Response Research (NSF-RAPID) 1640780. E.A.M. and S.J.R. were supported by NSF DEB-1518681. E.A.M. was additionally supported by the Stanford University Woods Institute for the Environment Environmental Ventures Program. S.J.R. was additionally supported by the CDC grant no. 1U01CK000510-01: Southeastern Regional Center of Excellence in Vector-Borne Diseases: the Gateway Program, to S.J.R. This publication was supported by the Cooperative Agreement Number above from the Centers for Disease Control and Prevention.
References
- 1.Brady OJ, et al. 2012. Refining the global spatial limits of dengue virus transmission by evidence-based consensus. PLoS Negl. Trop. Dis. 6, e1760 ( 10.1371/journal.pntd.0001760) [DOI] [PMC free article] [PubMed] [Google Scholar]
- 2.PAHO. 2018. Pan American Health Organisation. See https://www.paho.org.
- 3.Cao-Lormeau V-M, et al. 2016. Guillain-Barre syndrome outbreak associated with Zika virus infection in French Polynesia: a case-control study. Lancet 387, 1531–1539. ( 10.1016/S0140-6736(16)00562-6) [DOI] [PMC free article] [PubMed] [Google Scholar]
- 4.Mlakar J, et al. 2016. Zika virus associated with microcephaly. N. Engl. J. Med. 374, 951–958. ( 10.1056/NEJMoa1600651) [DOI] [PubMed] [Google Scholar]
- 5.World Health Organization. 2016. WHO statement on the first meeting of the International Health Regulations (2005) (IHR 2005) Emergency Committee on Zika virus and observed increase in neurological disorders and neonatal malformations. See http://www.who.int/news-room/detail/01-02-2016-who-statement-on-the-first-meeting-of-the-international-health-regulations-(2005)-(ihr-2005)-emergency-committee-on-zika-virus-and-observed-increase-in-neurological-disorders-and-neonatal-malformations.
- 6.Messina JP, et al. 2016. Mapping global environmental suitability for Zika virus. Elife 5, e15272 ( 10.7554/eLife.15272) [DOI] [PMC free article] [PubMed] [Google Scholar]
- 7.Samy AM, Thomas SM, Wahed AA, Cohoon KP, Peterson AT. 2016. Mapping the global geographic potential of Zika virus spread. Mem. Inst. Oswaldo Cruz 111, 559–560. ( 10.1590/0074-02760160149) [DOI] [PMC free article] [PubMed] [Google Scholar]
- 8.Mordecai E, et al. 2017. Detecting the impact of temperature on transmission of Zika, dengue, and chikungunya using mechanistic models. PLoS Negl. Trop. Dis. 11, e0005568 ( 10.1371/journal.pntd.0005568) [DOI] [PMC free article] [PubMed] [Google Scholar]
- 9.Caminade C, Turner J, Metelmann S, Hesson JC, Blagrove MS, Solomon T, Morse AP, Baylis M. 2017. Global risk model for vector-borne transmission of Zika virus reveals the role of El Nino 2015. Proc. Natl Acad. Sci. USA 114, 119–124. ( 10.1073/pnas.1614303114) [DOI] [PMC free article] [PubMed] [Google Scholar]
- 10.Liu-Helmersson J, Stenlund H, Wilder-Smith A, Rocklov J. 2014. Vectorial capacity of Aedes aegypti: effects of temperature and implications for global dengue epidemic potential. PLoS ONE 9, e89783 ( 10.1371/journal.pone.0089783) [DOI] [PMC free article] [PubMed] [Google Scholar]
- 11.Siraj AS, Santos-Vega M, Bouma MJ, Yadeta D, Carrascal DR, Pascual M. 2014. Altitudinal changes in malaria incidence in highlands of Ethiopia and Colombia. Science 343, 1154–1158. ( 10.1126/science.1244325) [DOI] [PubMed] [Google Scholar]
- 12.Murdock CC, Paaijmans KP, Bell AS, King JG, Hillyer JF, Read AF, Thomas MB. 2012. Complex effects of temperature on mosquito immune function. Proc. R. Soc. B 279, 3357–3366. ( 10.1098/rspb.2012.0638) [DOI] [PMC free article] [PubMed] [Google Scholar]
- 13.Adelman ZN, Anderson MA, Wiley MR, Murreddu MG, Samuel GH, Morazzani EM, Myles KM. 2013. Cooler temperatures destabilize RNA interference and increase susceptibility of disease vector mosquitoes to viral infection. PLoS Negl. Trop. Dis. 7, e2239 ( 10.1371/journal.pntd.0002239) [DOI] [PMC free article] [PubMed] [Google Scholar]
- 14.Delatte H, Gimonneau G, Triboire A, Fontenille D. 2009. Influence of temperature on immature development, survival, longevity, fecundity, and gonotrophic cycles of Aedes albopictus, vector of chikungunya and dengue in the Indian Ocean. J. Med. Entomol. 46, 33–41. ( 10.1603/033.046.0105) [DOI] [PubMed] [Google Scholar]
- 15.Mordecai EA, et al. 2013. Optimal temperature for malaria transmission is dramatically lower than previously predicted. Ecol. Lett. 16, 22–30. ( 10.1111/ele.12015) [DOI] [PubMed] [Google Scholar]
- 16.Kilpatrick AM, Meola MA, Moudy RM, Kramer LD. 2008. Temperature, viral genetics, and the transmission of West Nile virus by Culex pipiens mosquitoes. PLoS Pathog. 4, e1000092 ( 10.1371/journal.ppat.1000092) [DOI] [PMC free article] [PubMed] [Google Scholar]
- 17.Murdock CC, Sternberg ED, Thomas MB. 2016. Malaria transmission potential could be reduced with current and future climate change. Sci. Rep. 6, 27771 ( 10.1038/srep27771) [DOI] [PMC free article] [PubMed] [Google Scholar]
- 18.Ruiz-Moreno D, Vargas IS, Olson KE, Harrington LC. 2012. Modeling dynamic introduction of Chikungunya virus in the United States. PLoS Negl. Trop. Dis. 6, e1918 ( 10.1371/journal.pntd.0001918) [DOI] [PMC free article] [PubMed] [Google Scholar]
- 19.Johansson MA, Powers AM, Pesik N, Cohen NJ, Staples JE. 2014. Nowcasting the spread of chikungunya virus in the Americas. PLoS ONE 9, e104915 ( 10.1371/journal.pone.0104915) [DOI] [PMC free article] [PubMed] [Google Scholar]
- 20.Zhang Q, et al. 2017. Spread of Zika virus in the Americas. Proc. Natl Acad. Sci. USA 114, E4334–E4343. ( 10.1073/pnas.1620161114) [DOI] [PMC free article] [PubMed] [Google Scholar]
- 21.Dell AI, Pawar S, Savage VM. 2013. The thermal dependence of biological traits. Ecology 94, 1205–1206. ( 10.1890/12-2060.1) [DOI] [Google Scholar]
- 22.R Core Team. 2017. R: a language and environment for statistical computing. See https://www.R-project.org.
- 23.Bates D, Maechler M, Bolker B, Walker S. 2015. Fitting linear mixed-effects models using lme4. J. Stat. Softw. 67, 1–48. (doi:10.18637/jss.v067.i01) [Google Scholar]
- 24.Bacaër N, Guernaoui S. 2006. The epidemic threshold of vector-borne diseases with seasonality. J. Math. Biol. 53, 421–436. ( 10.1007/s00285-006-0015-0) [DOI] [PubMed] [Google Scholar]
- 25.Bacaër N. 2007. Approximation of the basic reproduction number R0 for vector-borne diseases with a periodic vector population. Bull. Math. Biol. 69, 1067–1091. ( 10.1007/s11538-006-9166-9) [DOI] [PubMed] [Google Scholar]
- 26.Bacaër N, Ait Dads EH. 2012. On the biological interpretation of a definition for the parameter R0 in periodic population models. J. Math. Biol. 65, 601–621. ( 10.1007/s00285-011-0479-4) [DOI] [PubMed] [Google Scholar]
- 27.Diekmann O, Heesterbeek J.AP, Roberts MG. 2010. The construction of next-generation matrices for compartmental epidemic models. J. R. Soc. Interface 7, 873–885. ( 10.1098/rsif.2009.0386) [DOI] [PMC free article] [PubMed] [Google Scholar]
- 28.Parham PE, Michael E. 2010. Modeling the effects of weather and climate change on malaria transmission. Environ. Health Perspect. 118, 620–626. ( 10.1289/ehp.0901256) [DOI] [PMC free article] [PubMed] [Google Scholar]
- 29.Diekmann O, Heesterbeek JAP, Metz JAJ. 1990. On the definition and the computation of the basic reproduction ratio R0 in models for infectious diseases in heterogeneous populations. J. Math. Biol. 28, 365–382. ( 10.1007/bf00178324) [DOI] [PubMed] [Google Scholar]
- 30.Heesterbeek JAP. 2002. A brief history of R0 and a recipe for its calculation. Acta Biotheor. 50, 189–204. ( 10.1023/a:1016599411804) [DOI] [PubMed] [Google Scholar]
- 31.Heffernan JM, Smith RJ, Wahl LM. 2005. Perspectives on the basic reproductive ratio. J. R. Soc. Interface 2, 281–293. ( 10.1098/rsif.2005.0042) [DOI] [PMC free article] [PubMed] [Google Scholar]
- 32.GADM. 2012. GADM database of global administrative areas, version 2.0. See www.gadm.org.
- 33.Hijmans RJ. 2016. raster: Geographic Data Analysis and Modeling. See https://cran.r-project.org/web/packages/raster/index.html.
- 34.Bivand R, Lewin-Koh N. 2017. maptools: Tools for Reading and Handling Spatial Objects. See https://cran.r-project.org/webpackages/maptools/index.html.
- 35.Bivand R, Keitt T, Rowlingson B. 2017. rgdal: Bindings for the ‘Geospatial’ Data Abstraction Library. See https://cran.r-project.org/web/packages/rgdal/index.html.
- 36.Ryan SJ, McNally A, Johnson LR, Mordecai EA, Ben-Horin T, Paaijmans K, Lafferty KD. 2015. Mapping physiological suitability limits for malaria in Africa under climate change. Vector-Borne Zoonotic Dis. 15, 718–725. [DOI] [PMC free article] [PubMed] [Google Scholar]
- 37.ESRI. 2015. ArcGIS Desktop. (ed. Institute ESR.). Redlands, CA. See https://www.esri.com/en-us/home.
- 38.Siraj AS, et al. 2018. Spatiotemporal incidence of Zika and associated environmental drivers for the 2015–2016 epidemic in Colombia. Sci. Data 5, 180073 ( 10.1038/sdata.2018.73) [DOI] [PMC free article] [PubMed] [Google Scholar]
- 39.Siraj AS, et al. 2018. Data from: Spatiotemporal incidence of Zika and associated environmental drivers for the 2015–2016 epidemic in Colombia Dryad Data Repository. ( 10.5061/dryad.83nj1.2) [DOI] [PMC free article] [PubMed]
- 40.Parham PE, et al. 2015. Climate, environmental and socio-economic change: weighing up the balance in vector-borne disease transmission. Phil. Trans. R. Soc. B 370, 20130551 ( 10.1098/rstb.2013.0551) [DOI] [PMC free article] [PubMed] [Google Scholar]
- 41.Johnson LR, Ben-Horin T, Lafferty KD, McNally A, Mordecai E, Paaijmans KP, Pawar S, Ryan SJ. 2015. Understanding uncertainty in temperature effects on vector-borne disease: a Bayesian approach. Ecology 96, 203–213. ( 10.1890/13-1964.1) [DOI] [PubMed] [Google Scholar]
- 42.Zouache K, Fontaine A, Vega-Rua A, Mousson L, Thiberge JM, Lourenco-De-Oliveira R, Caro V, Lambrechts L, Failloux AB. 2014. Three-way interactions between mosquito population, viral strain and temperature underlying chikungunya virus transmission potential. Proc. R. Soc. B 281, 1–9. ( 10.1098/rspb.2014.1078) [DOI] [PMC free article] [PubMed] [Google Scholar]
- 43.Johansson MA, Arana-Vizcarrondo N, Biggerstaff BJ, Staples JE. 2010. Incubation periods of yellow fever virus. Am. J. Trop. Med. Hyg. 83, 183–188. ( 10.4269/ajtmh.2010.09-0782) [DOI] [PMC free article] [PubMed] [Google Scholar]
- 44.Houk EJ, Obie F, Hardy JL. 1979. Peritrophic membrane formation and the midgut barrier to arboviral infection in the mosquito, Culex tarsalis Coquillett (Insecta, Diptera). Acta Trop. 36, 39–45. [PubMed] [Google Scholar]
- 45.Murdock CC, Paaijmans KP, Cox-Foster D, Read AF, Thomas MB. 2012. Rethinking vector immunology: the role of environmental temperature in shaping resistance. Nat. Rev. Microbiol. 10, 869–876. ( 10.1038/nrmicro2900) [DOI] [PMC free article] [PubMed] [Google Scholar]
- 46.Franz AW, Kantor AM, Passarelli AL, Clem RJ. 2015. Tissue barriers to arbovirus infection in mosquitoes. Viruses 7, 3741–3767. ( 10.3390/v7072795) [DOI] [PMC free article] [PubMed] [Google Scholar]
- 47.Xiao FZ, Zhang Y, Deng YQ, He S, Xie HG, Zhou XN, Yan YS. 2014. The effect of temperature on the extrinsic incubation period and infection rate of dengue virus serotype 2 infection in Aedes albopictus. Arch. Virol. 159, 3053–3057. ( 10.1007/s00705-014-2051-1) [DOI] [PubMed] [Google Scholar]
- 48.Christofferson RC, Chisenhall DM, Wearing HJ, Mores CN. 2014. Chikungunya viral fitness measures within the vector and subsequent transmission potential. PLoS ONE 9, e110538 ( 10.1371/journal.pone.0110538) [DOI] [PMC free article] [PubMed] [Google Scholar]
- 49.Johnson FH, Eyring H, Stover BJ. 1974. The theory of rate processes in biology and medicine. New York, NY: Wiley. [Google Scholar]
- 50.Shapiro L.LM, Whitehead SA, Thomas MB. 2017. Quantifying the effects of temperature on mosquito and parasite traits that determine the transmission potential of human malaria. PLoS Biol. 15, e2003489 ( 10.1371/journal.pbio.2003489) [DOI] [PMC free article] [PubMed] [Google Scholar]
- 51.Brady OJ, et al. 2015. Adult vector control, mosquito ecology and malaria transmission. Int. Health 7, 121–129. ( 10.1093/inthealth/ihv010) [DOI] [PMC free article] [PubMed] [Google Scholar]
- 52.Paaijmans KP, Blanford S, Chan BH, Thomas MB. 2012. Warmer temperatures reduce the vectorial capacity of malaria mosquitoes. Biol. Lett. 8, 465–468. ( 10.1098/rsbl.2011.1075) [DOI] [PMC free article] [PubMed] [Google Scholar]
- 53.Morin CW, Comrie AC, Ernst K. 2013. Climate and dengue transmission: evidence and implications. Environ. Health Perspect. 121, 1264–1272. ( 10.1289/ehp.1306556) [DOI] [PMC free article] [PubMed] [Google Scholar]
- 54.Christofferson RC, Mores CN. 2016. Potential for extrinsic incubation temperature to alter interplay between transmission potential and mortality of dengue-infected Aedes aegypti. Environ. Health Insights 10, 119–123. ( 10.4137/ehi.s38345) [DOI] [PMC free article] [PubMed] [Google Scholar]
- 55.Murdock CC, Evans MV, McClanahan TD, Miazgowicz KL, Tesla B. 2017. Fine-scale variation in microclimate across an urban landscape shapes variation in mosquito population dynamics and the potential of Aedes albopictus to transmit arboviral disease. PLoS Negl. Trop. Dis. 11, e0005640 ( 10.1371/journal.pntd.0005640) [DOI] [PMC free article] [PubMed] [Google Scholar]
- 56.Gloria-Soria A, Armstrong PM, Powell JR, Turner PE. 2017. Infection rate of Aedes aegypti mosquitoes with dengue virus depends on the interaction between temperature and mosquito genotype. Proc. R. Soc. B 284, 20171506 ( 10.1098/rspb.2017.1506) [DOI] [PMC free article] [PubMed] [Google Scholar]
- 57.Chouin-Carneiro T, et al. 2016. Differential susceptibilities of Aedes aegypti and Aedes albopictus from the Americas to Zika virus. PLoS Negl. Trop. Dis. 10, e0004543 ( 10.1371/journal.pntd.0004543) [DOI] [PMC free article] [PubMed] [Google Scholar]
- 58.Carrington LB, Seifert SN, Willits NH, Lambrechts L, Scott TW. 2013. Large diurnal temperature fluctuations negatively influence Aedes aegypti (Diptera: Culicidae) life-history traits. J. Med. Entomol. 50, 43–51. ( 10.1603/ME11242) [DOI] [PubMed] [Google Scholar]
- 59.Lambrechts L, Paaijmans KP, Fansiri T, Carrington LB, Kramer LD, Thomas MB, Scott TW. 2011. Impact of daily temperature fluctuations on dengue virus transmission by Aedes aegypti. Proc. Natl Acad. Sci. USA 108, 7460–7465. ( 10.1073/pnas.1101377108) [DOI] [PMC free article] [PubMed] [Google Scholar]
- 60.Worner SP. 1992. Performance of phenological models under variable temperature regimes: consequences of the Kaufmann or rate summation effect. Environ. Entomol. 21, 689–699. ( 10.1093/ee/21.4.689) [DOI] [Google Scholar]
- 61.Tesla B, Demakovsky LR, Mordecai EA, Ryan SJ, Bonds MH, Ngonghala CN, Brindley MA, Murdock CC. 2018. Data from: Temperature drives Zika virus transmission: evidence from empirical and mathematical models Dryad Digital Repository. ( 10.5061/dryad.7hj6q4c) [DOI] [PMC free article] [PubMed]
Associated Data
This section collects any data citations, data availability statements, or supplementary materials included in this article.
Data Citations
- Siraj AS, et al. 2018. Data from: Spatiotemporal incidence of Zika and associated environmental drivers for the 2015–2016 epidemic in Colombia Dryad Data Repository. ( 10.5061/dryad.83nj1.2) [DOI] [PMC free article] [PubMed]
- Tesla B, Demakovsky LR, Mordecai EA, Ryan SJ, Bonds MH, Ngonghala CN, Brindley MA, Murdock CC. 2018. Data from: Temperature drives Zika virus transmission: evidence from empirical and mathematical models Dryad Digital Repository. ( 10.5061/dryad.7hj6q4c) [DOI] [PMC free article] [PubMed]
Supplementary Materials
Data Availability Statement
Data and code are available from the Dryad Digital Repository: http://dx.doi.org/10.5061/dryad.7hj6q4c [61].