

Abstract
The Comparative Toxicogenomics Database (CTD; http://ctdbase.org) is a public resource that manually curates the scientific literature to provide content that illuminates the molecular mechanisms by which environmental exposures affect human health. We introduce our new chemical-phenotype module that describes how chemicals can affect molecular, cellular, and physiological phenotypes. At CTD, we operationally distinguish between phenotypes and diseases, wherein a phenotype refers to a nondisease biological event: eg, decreased cell cycle arrest (phenotype) versus liver cancer (disease), increased fat cell proliferation (phenotype) versus morbid obesity (disease), etc. Chemical-phenotype interactions are expressed in a formal structured notation using controlled terms for chemicals, phenotypes, taxon, and anatomical descriptors. Combining this information with CTD’s chemical-disease module allows inferences to be made between phenotypes and diseases, yielding potential insight into the predisease state. Integration of all 4 CTD modules furnishes unique opportunities for toxicologists to generate computationally predictive adverse outcome pathways, linking chemical-gene molecular initiating events with phenotypic key events, adverse diseases, and population-level health outcomes. As examples, we present 3 diverse case studies discerning the effect of vehicle emissions on altered leukocyte migration, the role of cadmium in influencing phenotypes preceding Alzheimer disease, and the connection of arsenic-induced glucose metabolic phenotypes with diabetes. To date, CTD contains over 165 000 interactions that connect more than 6400 chemicals to 3900 phenotypes for 760 anatomical terms in 215 species, from over 19 000 scientific articles. To our knowledge, this is the first comprehensive set of manually curated, literature-based, contextualized, chemical-induced, nondisease phenotype data provided to the public.
Keywords: phenotype, database, curation, chemical, disease, adverse outcome pathway
Since 2004, the freely available public Comparative Toxicogenomics Database (CTD; http://ctdbase.org/) has pioneered novel biocuration paradigms (Davis et al., 2011b, 2015) to code, harmonize, and integrate a diverse compendium of toxicological (Davis et al., 2009, 2011a, 2013a, 2017; Mattingly et al., 2006), environmental (Davis et al., 2008; Gohlke et al., 2009; Planchart et al., 2018), pharmaceutical (Davis et al., 2013c; Pelletier et al., 2016), and exposure data (Grondin et al., 2016, 2018) from the scientific literature to help advance understanding about chemical effects on human health. CTD scientists read and manually curate information from peer-reviewed articles to transform authors’ text, tables, figures, and supplemental files into annotated knowledge. This process, using a suite of controlled vocabularies and ontologies with accession identifiers, standardizes and organizes disparate data into a structured format, making it cohesive, manageable, and computable for discovery. These interactions also include species information, allowing data to be analyzed across taxa, including model laboratory organisms and humans. Content is derived from 3 integrated modules: CTD’s toxicogenomic core details more than 1.7 million chemical-gene/protein interactions, disease core has over 245 000 chemical-disease and gene-disease associations, and exposure module contains over 111 000 curated statements relating environmental stressors, receptors, biomarker measurements, and outcomes.
Many toxicology articles, however, do not report a disease as an endpoint; rather, nonpathological cellular and physiological events are described as being influenced by chemicals. To capture this critical data, we designed a fourth module to curate such nondisease events in a controlled manner.
Here, we describe our latest project that curates chemical-induced phenotypes. Operationally, CTD distinguishes between the concepts of “disease” and “phenotype” wherein a phenotype refers to a biological outcome that is not inherently a disease. For example, smooth muscle cell migration is a phenotype while distal myopathy is a disease, decreased parathyroid hormone secretion is a phenotype while Barakat syndrome is a disease, and abnormal blood pressure is a phenotype while idiopathic orthostatic hypotension is a disease, etc. This operational distinction between phenotypes and diseases allows us to harness 2 unique controlled vocabularies (one for phenotypes and another for diseases) to capture both types of chemical-induced outcomes reported in the literature, with phenotype curation often providing greater molecular and biological specificity (eg, “cell migration involved in sprouting angiogenesis” and “regulation of cardiac muscle contraction by calcium ion signaling”) compared with disease names, which often on their own provide no intuitive biological insight (eg, Fanconi syndrome, Arnold-Chiari malformation, Gilbert disease). For disease curation, CTD uses the MEDIC disease vocabulary (Davis et al., 2012b); consequently, any chemical-induced outcome that does not appear in MEDIC (and thus cannot be curated via our disease core module) is considered de facto to be a phenotype and instead is captured using the phenotype paradigm when possible. These phenotypes potentially provide insight to the presymptomatic biological milieu before the overt manifestation of a disease, and understanding the predisease states may help elucidate the molecular and cellular backdrops to aid potentially in earlier clinical diagnoses and better therapeutic interventions (Celato et al., 2013; McHale et al., 2010; Sakai and Otomo, 2016; Yu et al., 2017).
Capturing chemical-induced phenotypes in a structured format with controlled terms and integrating data with CTD’s extensive environmental content helps address the community need to link phenotypes to the environment and make the information computable (Deans et al., 2015). Combining CTD’s chemical-gene interactions with key phenotype events, chemical/gene-disease associations, and exposure content can also generate predictive adverse outcome pathways (AOPs) and empower toxicologists to develop testable hypotheses about environmental diseases (Mortensen et al., 2018; Nymark et al., 2018; Oki et al., 2016; Taboureau and Audouze, 2017; Villeneuve et al., 2014a, 2014b; Wittwehr et al., 2017). Furthermore, our unique chemical-phenotype content complements the myriad of well-established gene-phenotype systems for model organisms, such as the Monarch Initiative (Mungall et al., 2017), Mouse Phenome Database (Bogue et al., 2018), RGD PhenoMiner (Laulederkind et al., 2013), and ZFIN (Howe et al., 2017). Because many of these external databases use the same controlled vocabularies and accession identifiers for gene symbols, gene annotations, and diseases, the information can be cross-integrated to make novel computational discoveries, allowing gene-phenotype information to be brought into the chemical environment provided by CTD.
MATERIALS AND METHODS
Training, triaging, and curating the phenotype literature
For training, CTD biocurators were provided with a curation manual (containing instructions, documentation, rules, tips, and policy issues) and test articles for practice curation. Extensive feedback was given during early project management to ensure all biocurators were adequately prepared and curating in a consistent manner. CTD’s literature triaging process has been described in detail (Davis et al., 2011b). All articles curated in CTD are identified using PubMed (Agarwala et al., 2018), with chemical-centric queries to improve data completeness (Davis et al., 2013b), targeted journal queries to enhance data currency (Davis et al., 2012a), or exposure-themed queries for the exposure module (Grondin et al., 2016). CTD-associated data are related to an article via its PubMed identification number (PMID). Articles slated for the toxicogenomic core, disease core, and exposure modules are assigned to CTD biocurators on a routine basis. As articles are read for assigned projects, any reported phenotype data are curated concurrently in CTD’s chemical-phenotype module.
Software engineering
CTD’s web-based Curation Tool (CURAPP, curation application) has been previously described (Davis et al., 2011b). CURAPP was modified to accommodate new syntax for the structured notation expressing phenotype-based chemical and gene relationships. The phenotype and anatomy vocabularies were integrated into CURAPP; revised and new schematic data structures were implemented, along with new reporting and quality control-related processes and correction mechanisms. Existing CTD load processes were modified and new ones developed to incorporate phenotype display mechanisms. Inference engines were developed to generate gene- and chemical-based inference networks. Anatomical terms from the Medical Subject Headings (MeSH) “Anatomy [A]” controlled vocabulary (Coletti and Bleich, 2001) were loaded to our public database in a requisite format sufficient to support hierarchical-based anatomy searches [similar to our existing chemical-, Gene Ontology- (GO), and organism-based search features]. Significant changes to CTD’s database schemas, including the creation of new tables, and the modification of existing tables, were necessary to accommodate the new data storage requirements. CTD’s Public Web Application (PWA) was modified to implement new display, search, and associated functionality requirements. All CTD data, including phenotype data, are stored in PostgreSQL database management systems. Load processes and inference engines are Java-based and run in a Linux environment. The CURAPP and PWA utilize a J2EE-based Model-View-Controller architecture within the context of Apache/Tomcat.
Data version
CTD is updated with new content on a monthly basis (http://ctdbase.org/about/dataStatus). All analyses and metrics reported here are derived from version 15351M (February 13, 2018).
GO-slim distribution analysis
A generic GO-slim list maintained by the GO Consortium was downloaded (http://www.geneontology.org/page/go-slim-and-subset-guide) and filtered for the 69 terms in “biological_process” category. Each phenotype term was looked up in CTD to record the number of associated chemical interactions. Because GO is a hierarchy, counts are subsumed; thus, the number of chemical interactions represents the CTD data associated with the term directly and all child/descendant terms.
Data analyses: leukocyte migration case study
Leukocyte data were collected from the relevant data-tabs on CTD’s page for the GO term “leukocyte migration” (http://ctdbase.org/detail.go? type=go&acc=GO:0050900). A Pathway View map for genes associated with “vehicle emissions” and “leukocyte migration” was retrieved using the CTD web tool icon SetAnalyzer (http://ctdbase.org/tools/analyzer.go) to display the gene-gene and protein-protein interactions derived from imported BioGRID data (Chatr-Aryamontri et al., 2017; Davis et al., 2015). The default map was manually configured (merged edges and tree view layout) and exported in PNG format. Genes were collected under the “Genes” data-tab and chemicals from the “Chemical Interactions” data-tab; all results were downloaded, sorted, and filtered to unique sets for manual inspection.
Data analyses: cadmium-Alzheimer’s disease case study
Information was collected from the appropriate data-tabs on CTD’s “Cadmium” page (http://ctdbase.org/detail.go? type=chem&acc=D002104). The 131 cadmium-associated phenotypes were derived from downloading the interactions under the “Phenotypes” data-tab and filtering the results to a set of unique terms. The 44 genes forming an Inference Network between cadmium and Alzheimer’s disease (AD) were submitted to CTD’s Batch Query (http://ctdbase.org/tools/batchQuery.go) to retrieve a list of 1, 641 GO biological process annotations. CTD’s MyVenn tool (http://ctdbase.org/tools/myVenn.go) was used for all Venn analyses to prioritize phenotypes. Terms were manually inspected for GO ancestry using the CTD PWA (http://ctdbase.org/detail.go?type=go&acc=GO%3a0008150) and sorted to levels depending upon mappings. Subcellular level included terms mapping to “response to stimulus” (GO: 0006954), “signaling” (GO: 0023052), or “metabolic process” (GO: 0006006); cellular level included terms mapping to “cellular process” (GO: 0009987) or “cell proliferation” (GO: 0008283); and system level included ancestry terms “system process” (GO: 003008), “developmental process” (GO: 0001525), “behavior” (GO: 0007610), “reproduction” (GO: 0007283), or other. A few terms mapped to more than one level and were assigned based upon either the level that had a preponderance of mappings or the official definition provided for the term, whichever made the most biological sense.
RESULTS AND DISCUSSION
CTD Phenotype Curation Phases
In 2011, CTD initiated the manual curation of chemical-induced phenotypes as part of a collaborative project with Pfizer, Inc. (Davis et al., 2013c). For this initial project, CTD was restricted to using 143 phenotype terms preselected by Pfizer from the “Phenomena and Process [G]” branch of MeSH (Coletti and Bleich, 2001). In 3 months, CTD biocurators manually curated 9488 articles and generated 38 083 interactions for 2849 chemicals and 121 MeSH phenotypes (Davis et al., 2013c).
After 2011, CTD continued with phenotype curation as a new in-house module, but expanded the available phenotype terms by switching to the GO as a source of vocabulary terms for biological outcomes. Leveraging the GO affords several advantages (Ashburner et al., 2000). It is a robust vocabulary that provides a greater depth and broader range of terms that better reflect the multitude of outcomes reported in the toxicology literature. It is a well-known resource that is widely used by other databases in the scientific community for gene annotations. All GO terms have comprehensive definitions and stable accession identifiers, the latter of which allows GO annotations to act as a nexus to connect, integrate, and harmonize knowledge from domains curated across a variety of databases. For example, CTD collects and stores all the GO-gene annotations from NCBI Gene (Maglott et al., 2011); integration of these external GO-gene annotations with CTD’s gene-disease content provides a novel way to explore disease mechanisms based upon shared GO terms as opposed to shared gene symbols (Davis et al., 2016). Finally, the GO vocabulary is structured as a multi-level hierarchy, enabling users to view, navigate, and meta-analyze the associated content at different levels of granularity. This hierarchy also allows GO terms to be computationally sorted into categories that differentiate subcellular events (eg, “JNK cascade”) from larger developmental and system level processes (eg, “learning and memory”). Because of these numerous advantages, we transitioned to using GO as the source of phenotype terms.
To reconcile our legacy MeSH-based phenotype data-set with the new GO-based phenotype content, a CTD biocurator manually mapped the initial MeSH terms to their best equivalent terms in GO. This mapping and translation process retained 35 538 interactions (93%) to seed the new GO-based chemical-phenotype module. Going forward, all CTD chemical-phenotype interactions use only GO as the source of nondisease term events.
CTD Phenotype Curation Process
When an article reports a chemical’s effect upon a disease, the information is curated via CTD’s disease core using the MEDIC disease vocabulary (Davis et al., 2012b); any reported outcome that is not in MEDIC is considered de facto to be a phenotype and is captured using GO terms in the chemical-phenotype module where possible (Figure 1A).
Figure 1.
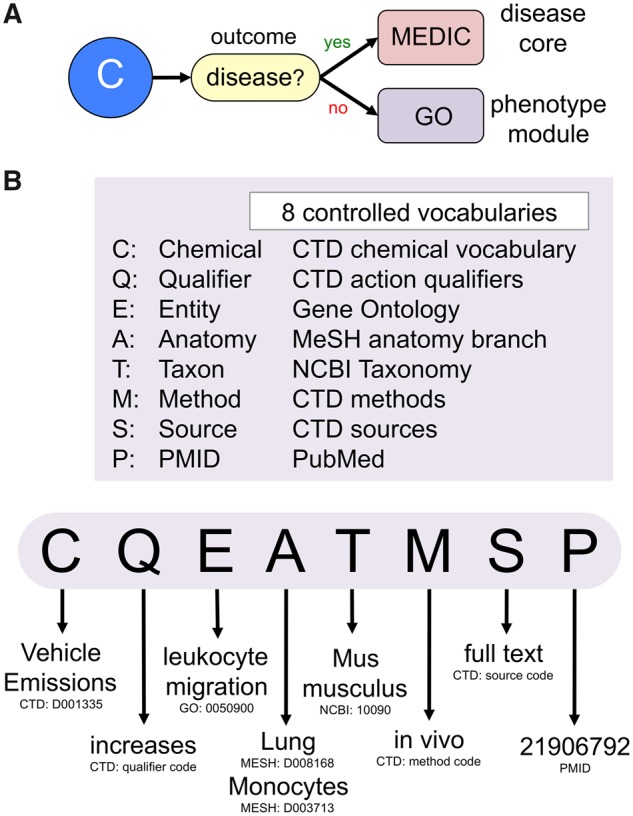
CTD phenotype curation. A, When an article reports that a chemical (C) influences a biological outcome, the biocurator first determines if that outcome exists as a term in the MEDIC disease vocabulary; if yes, then the interaction is curated via disease core; if no, the interaction is curated using the GO vocabulary in the phenotype module. B, CTD biocurators leverage 8 controlled vocabularies to construct a chemical-phenotype statement that must include, at a minimum, a Chemical (C), Qualifier (Q), Entity phenotype (E), Anatomy (A), Taxon (T), Method (M), Source (S), and PubMed identification number (P). An example of terms for a chemical-phenotype statement is shown at the bottom (and its web display is shown in Figure 2B). Currently, source (S) and method (M) data are stored internally at CTD and not displayed on the public website.
A CTD chemical-phenotype interaction statement includes 8 types of data (C-Q-E-A-T-M-S-P) annotated using 8 controlled vocabularies (Figure 1B), including, at a minimum: C, a chemical from the CTD Chemical Vocabulary (Davis et al., 2009); Q, a CTD action qualifier that reflects the direction of the interaction (“increases,” “decreases,” or “affects,” when not specified by the authors); E, the entity phenotype from GO; A, an anatomical term from the MeSH “Anatomy [A]” branch (Coletti and Bleich, 2001); T, an organism from NCBI Taxonomy (Federhen, 2012); M, a CTD method code (in vivo, in vitro); S, the CTD information source code (abstract, full text); and P, the article identifier (PMID) from NCBI PubMed (Agarwala et al., 2018). “Not reported” is allowed for both taxon and anatomy fields if the authors do not provide this information. CTD biocurators are careful to focus on collecting chemical-induced phenotypes, and not gene-associated phenotypes; this helps keep our resources focused on chemical-centric data and avoids duplicating gene-phenotype information that is more appropriately curated at other databases; however, we have found that sometimes a gene needs to be included as part of a complex chemical-phenotype interaction to best reflect the authors’ intentions; when necessary, official gene symbols from NCBI Gene (Maglott et al., 2011) are used in conjunction with the chemical and the phenotype.
CTD’s practice of implementing well-established, community-accepted controlled vocabularies (with definitions and accession identifiers) and having all manually curated interactions traced directly to the source article ensures that the information conforms with the FAIR principle, allowing the data to be Findable, Accessible, Interoperable, and Reusable (Wilkinson et al., 2016).
The data captured in this new module are wide-ranging: over 6400 chemicals and 3900 phenotypes reported in 215 species using 760 anatomy terms, manually curated from more than 19 000 articles published in 1200 scientific journals. To explore the distribution of CTD phenotypes and provide a perspective of the knowledge landscape covered by this module, we analyzed our curated content against the generic GO-slim list developed and maintained by the GO Consortium (Davis et al., 2010). The GO-slim list is a summarized subset of the entire biological process ontology and provides a broad, top-level view of the available information, without the detailed granular terminology that provides the depth and specificity to GO. The top phenotype terms curated with the most number of CTD chemical interactions include cell death, general and specific metabolic processes (including biosynthesis and catabolism), cell proliferation, response to stress, circulatory system processes, transport, and signal transduction (Table 1). Currently, CTD has curated interactions for every term in this GO-slim, except 3 (2 of which are processes found in plants and fungi which are taxa that CTD does not include). This extensive coverage of GO-slim illustrates the breadth of CTD’s phenotype content from the toxicology literature.
Table 1.
CTD Chemical Interactions for Phenotype Terms, as Distributed Across GO-Slim
| No. CTD Chemical Interactions | CTD Phenotype/GO-Slim Term | GO Term ID |
|---|---|---|
| 29 640 | Cell death | GO: 0008219 |
| 14 734 | Biosynthetic process | GO: 0009058 |
| 12 638 | Cellular nitrogen compound metabolic process | GO: 0034641 |
| 12 526 | Lipid metabolic process | GO: 0006629 |
| 12 396 | Cell proliferation | GO: 0008283 |
| 10 031 | Catabolic process | GO: 0009056 |
| 9619 | Response to stress | GO: 0006950 |
| 9111 | Circulatory system process | GO: 0003013 |
| 7233 | Transport | GO: 0006810 |
| 5783 | Signal transduction | GO: 0007165 |
| 5391 | Small molecule metabolic process | GO: 0044281 |
| 5375 | Cofactor metabolic process | GO: 0051186 |
| 4816 | Cellular protein modification process | GO: 0006464 |
| 4688 | Homeostatic process | GO: 0042592 |
| 4356 | Immune system process | GO: 0002376 |
| 4288 | Sulfur compound metabolic process | GO: 0006790 |
| 3948 | Anatomical structure development | GO: 0048856 |
| 3394 | DNA metabolic process | GO: 0006259 |
| 3136 | Cell differentiation | GO: 0030154 |
| 3115 | Locomotion | GO: 0040011 |
| 2907 | Cell motility | GO: 0048870 |
| 2901 | Cell cycle | GO: 0007049 |
| 2345 | Nucleobase-containing compound catabolic process | GO: 0034655 |
| 2181 | Cell-cell signaling | GO: 0007267 |
| 1730 | Transmembrane transport | GO: 0055085 |
| 1460 | Mitotic cell cycle | GO: 0000278 |
| 1448 | Autophagy | GO: 0006914 |
| 1366 | Generation of precursor metabolites and energy | GO: 0006091 |
| 1125 | Carbohydrate metabolic process | GO: 0005975 |
| 1038 | Mitochondrion organization | GO: 0007005 |
| 1019 | Chromosome organization | GO: 0051276 |
| 987 | Reproduction | GO: 0000003 |
| 858 | Cellular component assembly | GO: 0022607 |
| 761 | Growth | GO: 0040007 |
| 758 | Nucleocytoplasmic transport | GO: 0006913 |
| 651 | Cell adhesion | GO: 0007155 |
| 585 | Vesicle-mediated transport | GO: 0016192 |
| 559 | Membrane organization | GO: 0061024 |
| 465 | Nervous system process | GO: 0050877 |
| 348 | Cellular amino acid metabolic process | GO: 0006520 |
| 309 | Anatomical structure formation involved in morphogenesis | GO: 0048646 |
| 302 | Cytoskeleton organization | GO: 0007010 |
| 295 | Protein-containing complex assembly | GO: 0065003 |
| 291 | Embryo development | GO: 0009790 |
| 234 | Symbiont process | GO: 0044403 |
| 192 | Cell morphogenesis | GO: 0000902 |
| 178 | Plasma membrane organization | GO: 0007009 |
| 172 | Secondary metabolic process | GO: 0019748 |
| 146 | Developmental maturation | GO: 0021700 |
| 136 | Protein maturation | GO: 0051604 |
| 125 | Translation | GO: 0006412 |
| 59 | Cytoskeleton-dependent intracellular transport | GO: 0030705 |
| 54 | Extracellular matrix organization | GO: 0030198 |
| 52 | Protein targeting | GO: 0006605 |
| 47 | Cell division | GO: 0051301 |
| 38 | Chromosome segregation | GO: 0007059 |
| 35 | Mitotic nuclear division | GO: 0140014 |
| 34 | Pigmentation | GO: 0043473 |
| 34 | Cell junction organization | GO: 0034330 |
| 33 | Ribonucleoprotein complex assembly | GO: 0022618 |
| 30 | Nitrogen cycle metabolic process | GO: 0071941 |
| 16 | Vacuolar transport | GO: 0007034 |
| 10 | mRNA processing | GO: 0006397 |
| 9 | Protein folding | GO: 0006457 |
| 5 | tRNA metabolic process | GO: 0006399 |
| 1 | Ribosome biogenesis | GO: 0042254 |
| 0 | Cell wall organization or biogenesis | GO: 0071554 |
| 0 | Photosynthesis | GO: 0015979 |
| 0 | Transposition | GO: 0032196 |
Accessing CTD Phenotype Data
Chemical-phenotype content can be accessed using the Keyword Search Box in the upper right hand corner of any CTD page by querying either the “Chemical” or “GO” field (from the drop-down pick-list) with a term-of-interest (Figure 2A). A new data icon (“eye,” for phenotype) identifies the retrieved matching terms that have chemical-phenotype associated data. Clicking the icon, or going to the “Chemical Interactions” tab on a respective GO page, shows all the curated chemical-phenotype interactions in a tabular web-display. Users can sort the information by clicking on any column header, and discover, for example, a report that exposure to vehicle emissions affects leukocyte migration of monocytes in the lungs of mice (Figure 2B). Any comentioned terms (eg, chemicals, genes, and other phenotypes) are hyperlinked to their respective CTD pages, allowing users to easily traverse the database.
Figure 2.

Accessing chemical-phenotype interactions. A, A “Gene Ontology” (GO) Keyword Search Box query with “leukocyte” retrieves 83 results. Clicking the phenotype icon next to “leukocyte migration” opens up the chemical-phenotype interactions. B, The “Chemical Interactions” display is similar to other CTD pages, with data in a table format with sortable columns and hyperlinked terms that go to their respective pages in CTD. Shown is the interaction of how vehicle emissions affect the phenotype of leukocyte migration in mouse lung monocytes. The “Inference Network” lists 79 genes that have both a CTD curated interaction to vehicle emissions and, independently, have a GO-gene annotation to leukocyte migration, creating a chemical-gene-phenotype inference. Clicking the SetAnalyzer tool icon in front of the gene list generates a Pathway View map. A “Download” feature, found at the bottom of all CTD web pages, allows users to export data to their desktop in a variety of formats. For simplicity, all screenshots show an edited subset of actual web display.
In addition to the directly curated interaction between vehicle emissions and leukocyte migration (Figure 2B), CTD also provides inference networks (Davis et al., 2011a, 2013a, 2015). In this example, there are 3 pieces of independently derived information: (1) the chemical vehicle emissions directly affects the phenotype leukocyte migration (from chemical-phenotype module), (2) vehicle emissions have effects on 79 unique genes or proteins (from toxicogenomic core), and (3) independently, these same 79 genes have been (externally) annotated to the GO term leukocyte migration (integrated into CTD from the NCBI Gene database). Thus, these 79 genes provide a potential (inferred) mechanistic link connecting vehicle emissions to leukocyte migration. Clicking on the SetAnalyzer tool icon diagrams an extensive gene/protein interaction module (Figure 2B), quickly providing a starting point for testable molecular-genetic hypotheses for vehicle emission-induced leukocyte migration in mouse lungs.
Furthermore, users can leverage additional curated content in CTD to expand the analysis. Although vehicle emissions and leukocyte migration share 79 genes, there are currently 205 genes in CTD annotated to the GO term “leukocyte migration”, providing an additional 126 genes to test for influence by exposure to vehicle emissions. As well, there are 471 additional chemicals (other than vehicle emissions) that influence leukocyte migration, including 68 that specifically increase this phenotype in lung compartments of mice, including such additional traffic-related air pollutants as soot, ozone, and particulate matter. Having diverse data manually curated from a variety of articles, but harmonized using controlled vocabularies in one database, helps discover information to broaden hypotheses about traffic-related exposure and immune system processes.
Content also can be accessed using the Chemical-Phenotype Interaction Query page (http://ctdbase.org/query.go?type=phenotype). Parameters such as chemical, phenotype, anatomy, or organism can be specified and combined to perform an advanced query, enabling scientists to find data specific for certain taxa or anatomical sites (Figure 3). Because many CTD curation vocabularies (chemicals, phenotypes, anatomy, and organisms) are hierarchical, the query returns associations for the entered term as well as all child/descendant terms, and highlights the matches in the results. Thus, a neurotoxicologist can search with just the word “brain” and immediately retrieve over 12 500 interactions for 1330 chemicals and 710 phenotypes occurring in 115 anatomical parts (from “amygdala” to “white matter”) for 35 organisms, whereas a user searching with “heart” will discover 6100 cardiotoxic events for 910 chemicals, 420 phenotypes, and 18 structures from 21 species.
Figure 3.

Chemical-Phenotype Interaction Query page. CTD's Chemical-Phenotype Interaction Query page allows users to perform advanced searches, combining different parameters. Searching for a high-level phenotype (signaling) in an anatomical category (intestine) in rat retrieves 11 hits. Because many CTD curation vocabularies are hierarchical, the query returns child terms as well, and all matching terms are highlighted to alert the user.
Illuminating the Predisease State
Using CTD’s transitive process, the curated set of chemical-phenotype interactions can be integrated with CTD’s chemical-disease associations from our disease core: if phenotype A interacts with chemical B, and, independently, chemical B is associated with disease C, then phenotype A can be inferred to disease C (via chemical B). These inferences generate potential biological phenotypes that may be modulated by the chemicals during the predisease/presymptomatic state. The heavy metal environmental pollutant cadmium has evidence suggesting a connection to AD; as well, cadmium modulates 131 unique phenotypes in CTD (Figure 4, top and bottom panels). These 131 phenotypes can be inferred to AD using the transitive process to explore potential biological reactions happening in a predisease state. A diversity of phenotypes is seen, including the disruption of subcellular metabolic pathways (eg, fatty acids, triglycerides, vitamin E, phospholipids, amino acids), cellular processes (eg, cell cycle, mitochondrial depolarization, lymphocyte activation, testosterone secretion), cell death phenotypes (eg, apoptosis, cell killing, necrosis, DNA fragmentation), and system level events (eg, renal filtration, olfactory behavior, bone resorption). These phenotypes allow toxicologists, risk assessors, regulatory decision makers, and pharmaceutical drug scientists to explore biological events potentially preceding the clinical manifestation of cadmium-induced AD.
Figure 4.

Prioritizing phenotypes that connect cadmium to Alzheimer's disease (AD). The “Diseases” (top arrow) and “Phenotypes” (bottom arrow) data-tabs for the chemical Cadmium (Cd) are depicted from CTD (edited view). In the top panel, the Inference Network computes a list of 44 genes that directly interact with cadmium and also have a direct association with AD, allowing an inferred relationship (dotted arrow) to be made between Cd and AD: these 44 inference genes are annotated to 1641 GO terms (by external databases). As well, there are 131 unique phenotypes directly associated with Cadmium (bottom panel) that can also be inferred to the disease. A Venn analysis (middle panel) reveals 58 GO terms/phenotypes that are shared between these 2 independently derived data-sets; consequently, these 58 phenotypes could be prioritized as key events (KEs) connecting cadmium exposure to AD.
The 131 phenotypes can be prioritized by comparing them with the GO terms annotated to genes in the inference network. Currently, 44 genes form an inference network between cadmium and AD (Figure 4, top panel). All 44 genes have curated interactions with cadmium (from CTD’s toxicogenomic core), and, independently, have curated associations with AD (from CTD’s disease core). These 44 genes are also annotated to 1641 unique GO biological process terms (annotated by external GO annotators and imported into CTD via a monthly upload from NCBI Gene). A Venn analysis of the 1641 GO biological process terms (derived from external, independent GO curation) with the 131 GO-based phenotypes (from internal CTD chemical-phenotype curation), reveals 58 shared terms, which, because of their derivation from 2 separate, independent data analyses, could potentially prioritize them as key events (KEs) connecting cadmium to AD (Figure 4, middle panel). These prioritized 58 phenotypes are annotated to 35 of the original 44 genes.
Generating Predictive AOPs
Integrating content from all 4 CTD curation modules (toxicogenomic, chemical-phenotype, disease, and exposure) provides an opportunity to generate predictive AOPs. An AOP is a framework that organizes information to construct a biologically plausible explanation for how a toxicant can result in an adverse outcome (AO), such as a disease (Villeneuve et al., 2014a, b). AOPs are useful constructs to organize data across species, identify information gaps, and inform bioassay development (Mortensen et al., 2018; Nymark et al., 2018; Oki et al., 2016; Taboureau and Audouze, 2017; Wittwehr et al., 2017). A generic AOP framework can include 4 components: a molecular initiating event (MIE) that links a toxicant to a gene product, followed by a series of KEs, resulting in an AO that enhances an understanding at the population level (PO). CTD’s 4 curation modules reflect these 4 AOP components (Figure 5).
Figure 5.

Leveraging CTD curation modules for AOP components. An adverse outcome pathway (AOP) is composed of ordered components (top rows): the molecular initiating event (MIE) between a chemical and gene product launches a series of KEs resulting in an adverse outcome (AO), which can have effects at the population level (PO). These components mirror curation modules at CTD (double arrows and middle row): toxicogenomic core, chemical-phenotype module, disease core, and exposure module. The numbers of manually curated interactions, chemicals, genes, phenotypes, anatomy terms, diseases, and taxa (organisms) in each CTD module are listed (note: the exposure module only curates data for humans). n/a, not applicable; n/d, not determined/displayed (data are collected but not yet publicly released).
For cadmium and AD, the prioritized 58 phenotypes first can be sorted into arbitrary KE levels by their mapping in the GO hierarchy. All 58 terms ultimately map to the GO root term “biological process” (GO: 0008150); however, by mapping to their penultimate or antepenultimate root terms, the phenotypes start to segregate into different levels of biological specificity. Using this strategy, the 58 prioritized phenotypes were divided into subcellular, cellular, and system KE levels (Figure 6), and similar biological themes emerged for many GO terms (even in different KE levels), such as neuron-related, cell death, oxidative stress, metabolism, cardiovascular, and mitochondrial. Many of these themes can be corroborated in the literature for AD. To wit, individually querying PubMed for abstracts that contain “AD” plus these words retrieves extensive literature-based co-occurrences for “cell death” (2107 articles), “oxidative stress” (3669 articles), “cardiovascular” (3327 articles), and “mitochondrion” (1432 articles), whereas other phenotypes may be simply coincidental (or not yet realized), such as “spermatogenesis” (only 3 articles).
Figure 6.

Classifying prioritized phenotypes. The 58 prioritized phenotypes were classified to 3 key event levels: KE1 (subcellular), KE2 (cellular), or KE3 (system) based on their mapping in the GO hierarchy. Similar biological themes are coded (legend at bottom). A schematic summary of the meta-data is shown in lower right corner: direct interactions between cadmium (Cd) and 35 genes are reported in CTD's toxicogenomic core, and CTD's disease core reports that these 35 genes are also directly associated with Alzheimer disease, as well as independently annotated by external databases to 58 GO terms; simultaneously, CTD's phenotype module reports manually curated interactions between cadmium and these same 58 prioritized phenotypes; and CTD disease core also describes a connection between cadmium and Alzheimer disease, allowing the 58 prioritized phenotypes to be inferred (dotted arrow).
Three phenotypes were selected from the prioritized 58 (one from each KE level), and used to construct a predictive AOP connecting cadmium to AD (Figure 7). Ten independent MIEs represent a curated interaction between cadmium and 10 genes (IL1B, TNF, APP, CASP3, PRNP, GSK3B, BAX, CRH, BDNF, and PSEN1) from CTD’s toxicogenomic core. Independently, these 10 genes are directly annotated to AD from CTD’s disease core. As well, these 10 genes are annotated to at least 1 of the 3 KEs as a GO-gene annotation (from NCBI Gene), and all 3 KEs have been curated as interacting with cadmium from CTD’s chemical-phenotype module. Although an AOP describes a single toxicant-gene MIE, the fact that CTD’s curated content provides 10 independent MIEs converging upon repeated occurrence of the same 3 KE phenotypes evinces multiple possible lines of support for the model. It should not be construed that all 10 independent MIEs must occur for the AOP to be valid; rather, the model simply provides at least 10 different independent ways for the AOP to be validated. Finally, an article leveraging data from the National Health and Nutrition Examination Survey (NHANES), and curated in CTD’s exposure module, confirms a relationship between cadmium exposure and AD (Min and Min, 2016). This is just one of the several predictive AOPs that can be generated using all 35 genes and 58 prioritized phenotypes connecting cadmium to AD. Recall that cadmium influences 131 phenotypes (Figure 4); we only focused on the 58 that were prioritized based upon them also being annotated to genes associated with AD. This leaves an additional 73 novel phenotypes for constructing additional KEs in cadmium-induced AOPs.
Figure 7.

Integrating CTD content to generate predictive AOPs. Curated content from CTD toxicogenomic core is used to identify 10 molecular initiating events (MIE1-10) relating the toxicant cadmium to 10 genes that are also directly associated with the AO of AD from disease core. CTD's chemical-phenotype curation module fills in the intermediate KEs. Here, just 3 of the 58 prioritized phenotypes (KE1-KE3) are depicted that are directly influenced by cadmium in addition to being independently annotated to the same 10 genes by external GO databases (dotted lines). Phenotypes are organized into 3 KE levels (KE1 subcellular, KE2 cellular, and KE3 system) to generate a predicted AOP (bottom) connecting cadmium to AD. Furthermore, the association of cadmium exposure to AD is confirmed at the PO by CTD's exposure module (top arrow), with a U.S. study correlating cadmium blood levels (0.39-1.14 micrograms per liter) with patients.
Similar analyses can be performed easily with any chemical in CTD. Arsenicals, for example, currently modulate over 600 distinct phenotypes (http://ctdbase.org/detail.go?type=chem&acc=D001152&view=phenotype), including 10 related to glucose metabolism (Table 2). The genes that form the inference networks between arsenical compounds and these 10 phenotypes can be compared with known diabetic genes in CTD. In total, of the 171 unique inference genes that relate arsenicals to a glucose phenotype, 39 (23%) are also independently associated with diabetes (Table 2), allowing researchers to rapidly design predictive AOPs wherein arsenic interacts with the genes (MIEs) to affect glucose metabolism (KE) as potential presymptomatic phenotypes before the onset of diabetes (AO).
Table 2.
Glucose-Related Phenotypes Modulated by Arsenicals in CTD
| Arsenical Compound | Phenotype (ID) | Inference Network Genes | Subset of Inference Network Genes Also Associated With Diabetes |
|---|---|---|---|
| Arsenic trioxide; arsenite; methylarsonite; sodium arsenate; sodium arsenite | Glucose homeostasis (GO: 0042593) | 95 genes: ADGRF5; ADIPOQ; ADRA1B; ADRA2A; AKT1; AKT2; ATG7; BAD; C5; CACNA1A; CACNA1C; CACNA1E; CAV3; CD36; CDKN2A; CEBPA; CNR1; CRH; CRY2; DBH; ERO1B; FABP5; FFAR2; FGFR4; FOXA1; FOXO1; FOXO3; G6PC; GCK; GLIS3; GPI; GPR39; GPRC5B; HIF1A; HNF1A; HNF1BA; HNF4A; IGFBP5; IL6; INS; INSR; IRS1; KCNB1; KLHL42; LEP; LEPR; MAP2K1; MCU; MET; NCOR2; NEUROD1; NMB; NOTCH2; NR1H4; NUCKS1; PARK2; PAX4; PAX6; PCK1; PDK2; PDK4; PDX1; PFK; PGD; PLA2G6; PPARG; PPP3CB; PRCP; PRKAA1; PRKAA2; PTCH1; PTPN11; PYGL; RAB13; RBM4; RPS6; SELENOT; SERPINE1; SESN2; SESN3; SIRT1; SLC16A1; SLC18A2; SLC2A4; SLC37A4; SOX4; SRI; SSTR5; STAT3; TCF7L2; TRPV4; UBA1; USF1; VSNL1; XBP1 | 28 genes: ADIPOQ; AKT2; CAV3; FOXO3; GCK; GLIS3; HIF1A; HNF1A; HNF4A; IL6; INS; INSR; IRS1; LEP; LEPR; NEUROD1; NOTCH2; PAX4; PAX6; PCK1; PDK4; PDX1; PPARG; SERPINE1; SIRT1; SLC2A4; STAT3; TCF7L2 |
| Sodium arsenite | Glucose metabolic process (GO: 0006006) | 43 genes: ADIPOQ; AKR1A1; AKT1; AKT2; CPT1A; CREM; FABP5; G6PD; G6PDX; GALM; GAPDH; GCK; GHRL; HK2; IGF2; IGFBP1; IGFBP5; INS; INS1; IRS2; LEP; MAPK14; MYC; NISCH; PCK1; PDHA2; PDHB; PDHK-2; PDK1; PDK2; PDK3; PDK4; PDX1; PGM1; PIK3CA; PIK3R1; PKM; PRKAA1; SERP1; SERPINA12; SORD; TNF; TPI1 | 13 genes: ADIPOQ; AKT2; CPT1A; CREM; GCK; INS; INS1; IRS2; LEP; PCK1; PDK4; PDX1; TNF |
| Arsenic trioxide | Gluconeogenesis (GO: 0006094) | 21 genes: ALDOA; ALDOC; ATF3; ATF4; FBP1; G6PC3; GAPDH; GOT1; GOT2; GPD1; GPD2; GPI; MDH1; PCK2; PER2; PFKFB4; PGK1; PGM1; PPARGC1A; TAT; TPI1 | 3 genes: ATF3; GPD2; PPARGC1A |
| Sodium arsenite | Canonical glycolysis (GO: 0061621) | 18 genes: ALDOA; ALDOB; ALDOC; BPGM; ENO1; ENO2; ENO3; GAPDH; GCK; GPI; HK2; HK3; PGAM1; PGAM2; PGK1; PKLR; PKM; TPI1 | 2 genes: GCK; PKLR |
| Sodium arsenite | Regulation of glycolytic process (GO: 0006110) | 13 genes: ECD; GCK; HIF1A; NDC1; NUP155; NUP210; NUP62; NUP85; NUP88; NUP93; PGAM1; RAE1; TPR | 2 genes: GCK; HIF1A |
| Arsenic trioxide | Positive regulation of insulin secretion involved in cellular response to glucose stimulus (GO: 0035774) | 10 genes: ATG7; BAD; CRH; HIF1A; PARK2; PLA2G6; PPP3CB; SIRT1; SRI; VSNL1 | 2 genes: HIF1A; SIRT1 |
| Sodium arsenite | Positive regulation of gluconeogenesis (GO: 0045722) | 9 genes: DGAT2; FOXO1; HIF1A; HNF4A; PCK1; PPARGC1A; PPP4R3A; PRKAA1; SIRT1 | 5 genes: HIF1A; HNF4A; PCK1; PPARGC1A; SIRT1 |
| Sodium arsenite | Positive regulation of glucose import in response to insulin stimulus (GO: 2001275) | 9 genes: AGT; AKT2; INS; IRS1; MARCKS; PIK3R1; PIK3R2; PIK3R3; PTPN11 | 4 genes: AGT; AKT2; INS; IRS1 |
| Arsenite; methylarsonite | Positive regulation of glycogen biosynthetic process (GO: 0045725) | 6 genes: AKT1; IGF1; INS; INSR; IRS1; RACK1 | 4 genes: IGF1; INS; INSR; IRS1 |
| Arsenic trioxide | Regulation of glycogen metabolic process (GO: 0070873) | 2 genes: KHK; PHLDA2 | 0 genes |
The seamless integration of CTD content allows users to explore additional information, such as identifying other chemicals (besides cadmium) that influence “learning or memory” by viewing the “Chemical Interactions” tab for this phenotype term (http://ctdbase.org/detail.go?type=go&acc=GO%3a0007611&view=phenotype), or discovering other diseases inferred to this phenotype under the “Diseases” tab (http://ctdbase.org/detail.go?type=go&acc=GO%3a0007611&view=disease), or retrieving the details that describe this phenotype as an exposure outcome at the PO (http://ctdbase.org/detail.go?type=go&acc=GO%3a0007611&view=expConsol). Similar data extensions can be done for any of the other listed phenotypes in the cadmium-AD AOP or the 10 genes forming the MIEs. This helps discover and connect information to grow and extend the predictive AOPs, as well as interrelate other AOPs to generate testable hypotheses about chemical exposures and environmentally influenced diseases. The predictive AOPs easily generated from CTD curated content should help toxicologists review, test, and refine AOPs for official approval (https://aopwiki.org/).
SUMMARY
We present a new chemical-phenotype module at CTD that describes chemical-induced, nondisease biological outcomes that are manually curated from the peer-reviewed scientific literature. These interactions are embellished with taxon and anatomical descriptors, allowing the data to be analyzed comparatively across model organisms and humans. The use of well-known vocabularies (with accession identifiers) enhance database interoperability and provide an easy way for model organism databases to bring their gene-phenotype information into the chemical landscape provided by CTD. This freely available module will help toxicologists better understand the predisease state and generate predictive AOPs for environmental diseases. To our knowledge, this is the first comprehensive set of manually curated, literature-based, contextualized, chemical-induced, nondisease phenotype data provided to the public.
FUNDING
National Institute of Environmental Health Sciences [grant numbers R01ES014065, R01ES023788, P30ES025128]. The content is solely the responsibility of the authors and does not necessarily represent the official views of the National Institutes of Health.
REFERENCES
- Agarwala R., Barrett T., Beck J., Benson D. A., Bollin C., Bolton E., Bourexis D., Brister J. R., Bryant S. H., Canese K., et al. (2018). Database resources of the National Center for Biotechnology Information. Nucleic Acids Res. 46, D8–D13. [DOI] [PMC free article] [PubMed] [Google Scholar]
- Ashburner M., Ball C. A., Blake J. A., Botstein D., Butler H., Cherry J. M., Davis A. P., Dolinski K., Dwight S. S., Eppig J. T., et al. (2000). Gene Ontology: Tool for the unification of biology. Nat. Genet. 25, 25–29. [DOI] [PMC free article] [PubMed] [Google Scholar]
- Bogue M. A., Grubb S. C., Walton D. O., Philip V. M., Kolishovski G., Stearns T., Dunn M. H., Skelly D. A., Kadakkuzha B., TeHennepe G., et al. (2018). Mouse Phenome Database: An integrative database and analysis suite for curated empirical phenotype data from laboratory mice. Nucleic Acids Res. 46, D843–D850. [DOI] [PMC free article] [PubMed] [Google Scholar]
- Celato A., Mitola C., Tolve M., Giannini M. T., De Leo S., Carducci C., Carducci C., Leuzzi V. (2013). A new case of malonic aciduria with a presymptomatic diagnosis and an early treatment. Brain Dev. 35, 675–680. [DOI] [PubMed] [Google Scholar]
- Chatr-Aryamontri A., Oughtred R., Boucher L., Rust J., Chang C., Kolas N. K., O'Donnell L., Oster S., Theesfeld C., Sellam A., et al. (2017). The BioGRID interaction database: 2017 update. Nucleic Acids Res. 45, D369–D379. [DOI] [PMC free article] [PubMed] [Google Scholar]
- Coletti M. H., Bleich H. L. (2001). Medical subject headings used to search the biomedical literature. J. Am. Med. Inform. Assoc. 8, 317–323. [DOI] [PMC free article] [PubMed] [Google Scholar]
- Davis A. P., Grondin C. J., Johnson R. J., Sciaky D., King B. L., McMorran R., Wiegers J., Wiegers T. C., Mattingly C. J. (2017). The Comparative Toxicogenomics Database: Update 2017. Nucleic Acids Res. 45, D972–D978. [DOI] [PMC free article] [PubMed] [Google Scholar]
- Davis A. P., Grondin C. J., Lennon-Hopkins K., Saraceni-Richards C., Sciaky D., King B. L., Wiegers T. C., Mattingly C. J. (2015). The Comparative Toxicogenomics Database’s 10th year anniversary: Update 2015. Nucleic Acids Res. 43, D914–D920. [DOI] [PMC free article] [PubMed] [Google Scholar]
- Davis A. P., Johnson R. J., Lennon-Hopkins K., Sciaky D., Rosenstein M. C., Wiegers T. C., Mattingly C. J. (2012a). Targeted journal curation as a method to improve data currency at the Comparative Toxicogenomics Database. Database (Oxford) 2012, bas051.. [DOI] [PMC free article] [PubMed] [Google Scholar]
- Davis A. P., King B. L., Mockus S., Murphy C. G., Saraceni-Richards C., Rosenstein M., Wiegers T., Mattingly C. J. (2011a). The Comparative Toxicogenomics Database: Update 2011. Nucleic Acids Res. 39, D1067–D1072. [DOI] [PMC free article] [PubMed] [Google Scholar]
- Davis A. P., Murphy C. G., Johnson R., Lay J. M., Lennon-Hopkins K., Saraceni-Richards C., Sciaky D., King B. L., Rosenstein M. C., Wiegers T. C., et al. (2013a). The Comparative Toxicogenomics Database: Update 2013. Nucleic Acids Res. 41, D1104–D1114. [DOI] [PMC free article] [PubMed] [Google Scholar]
- Davis A. P., Murphy C. G., Rosenstein M. C., Wiegers T. C., Mattingly C. J. (2008). The Comparative Toxicogenomics Database facilitates identification and understanding of chemical-gene-disease associations: Arsenic as a case study. BMC Med. Genom. 1, 48.. [DOI] [PMC free article] [PubMed] [Google Scholar]
- Davis A. P., Murphy C. G., Saraceni-Richards C. A., Rosenstein M. C., Wiegers T. C., Mattingly C. J. (2009). Comparative Toxicogenomics Database: A knowledgebase and discovery tool for chemical-gene-disease networks. Nucleic Acids Res. 37, D786–D792. [DOI] [PMC free article] [PubMed] [Google Scholar]
- Davis A. P., Wiegers T. C., Johnson R. J., Lay J. M., Lennon-Hopkins K., Saraceni-Richards C., Sciaky D., Murphy C. G., Mattingly C. J. (2013b). Text mining effectively scores and ranks the literature for improving chemical-gene-disease curation at the comparative toxicogenomics database. PLoS One 8, e58201.. [DOI] [PMC free article] [PubMed] [Google Scholar]
- Davis A. P., Wiegers T. C., King B. L., Wiegers J., Grondin C. J., Sciaky D., Johnson R. J., Mattingly C. J. (2016). Generating gene ontology-disease inferences to explore mechanisms of human disease at the Comparative Toxicogenomics Database. PLoS One 11, e0155530.. [DOI] [PMC free article] [PubMed] [Google Scholar]
- Davis A. P., Wiegers T. C., Roberts P. M., King B. L., Lay J. M., Lennon-Hopkins K., Sciaky D., Johnson R., Keating H., Greene N., et al. (2013c). A CTD-Pfizer collaboration: Manual curation of 88, 000 scientific articles text mined for drug-disease and drug-phenotype interactions. Database (Oxford) 2013, bat080.. [DOI] [PMC free article] [PubMed] [Google Scholar]
- Davis A. P., Wiegers T. C., Rosenstein M. C., Mattingly C. J. (2012b). MEDIC: A practical disease vocabulary used at the Comparative Toxicogenomics Database. Database (Oxford) 2012, bar065.. [DOI] [PMC free article] [PubMed] [Google Scholar]
- Davis A. P., Wiegers T. C., Rosenstein M. C., Murphy C. G., Mattingly C. J. (2011b). The curation paradigm and application tool used for manual curation of the scientific literature at the Comparative Toxicogenomics Database. Database (Oxford) 2011, bar034.. [DOI] [PMC free article] [PubMed] [Google Scholar]
- Davis M. J., Sehgal M. S., Ragan M. A. (2010). Automatic, context-specific generation of Gene Ontology slims. BMC Bioinformatics 11, 498.. [DOI] [PMC free article] [PubMed] [Google Scholar]
- Deans A. R., Lewis S. E., Huala E., Anzaldo S. S., Ashburner M., Balhoff J. P., Blackburn D. C., Blake J. A., Burleigh J. G., Chanet B., et al. (2015). Finding our way through phenotypes. PLoS Biol. 13, e1002033.. [DOI] [PMC free article] [PubMed] [Google Scholar]
- Federhen S. (2012). The NCBI taxonomy database. Nucleic Acids Res 40, D13–D143. [DOI] [PMC free article] [PubMed] [Google Scholar]
- Gohlke J. M., Thomas R., Zhang Y., Rosenstein M. C., Davis A. P., Murphy C., Becker K. G., Mattingly C. J., Portier C. J. (2009). Genetic and environmental pathways to complex diseases. BMC Syst. Biol. 3, 46.. [DOI] [PMC free article] [PubMed] [Google Scholar]
- Grondin C. J., Davis A. P., Wiegers T. C., King B. L., Wiegers J. A., Reif D. M., Hoppin J. A., Mattingly C. J. (2016). Advancing exposure science through chemical data curation and integration in the Comparative Toxicogenomics Database. Environ. Health Perspect. 124, 1592–1599. [DOI] [PMC free article] [PubMed] [Google Scholar]
- Grondin C. J., Davis A. P., Wiegers T. C., Wiegers J. A., Mattingly C. J. (2018). Accessing an expanded exposure science module at the Comparative Toxicogenomics Database. Environ. Health Perspect. 126, 014501.. [DOI] [PMC free article] [PubMed] [Google Scholar]
- Howe D. G., Bradford Y. M., Eagle A., Fashena D., Frazer K., Kalita P., Mani P., Martin R., Moxon S. T., Paddock H., et al. (2017). The Zebrafish Model Organism Database: New support for human disease models, mutation details, gene expression phenotypes and searching. Nucleic Acids Res. 45, D758–D768. [DOI] [PMC free article] [PubMed] [Google Scholar]
- Laulederkind S. J., Liu W., Smith J. R., Hayman G. T., Wang S. J., Nigam R., Petri V., Lowry T. F., de Pons J., Dwinell M. R., et al. (2013). PhenoMiner: Quantitative phenotype curation at the rat genome database. Database (Oxford) 2013, bat015.. [DOI] [PMC free article] [PubMed] [Google Scholar]
- Maglott D., Ostell J., Pruitt K. D., Tatusova T. (2011). Entrez Gene: Gene-centered information at NCBI. Nucleic Acids Res. 39, D52–D57. [DOI] [PMC free article] [PubMed] [Google Scholar]
- Mattingly C. J., Rosenstein M. C., Davis A. P., Colby G. T., Forrest J. N., Boyer J. L. (2006). The Comparative Toxicogenomics Database: A cross-species resource for building chemical-gene interaction networks. Toxicol. Sci. 92, 587–595. [DOI] [PMC free article] [PubMed] [Google Scholar]
- McHale C. M., Zhang L., Hubbard A. E., Smith M. T. (2010). Toxicogenomic profiling of chemically exposed humans in risk assessment. Mutat. Res. 705, 172–183. [DOI] [PMC free article] [PubMed] [Google Scholar]
- Min J. Y., Min K. B. (2016). Blood cadmium levels and Alzheimer's disease mortality risk in older US adults. Environ. Health 15, 69.. [DOI] [PMC free article] [PubMed] [Google Scholar]
- Mortensen H. M., Chamberlin J., Joubert B., Angrish M., Sipes N., Lee J. S., Euling S. Y. (2018). Leveraging human genetic and adverse outcome pathway (AOP) data to inform susceptibility in human health risk assessment. Mamm. Genome 29, 190–204. [DOI] [PMC free article] [PubMed] [Google Scholar]
- Mungall C. J., McMurry J. A., Köhler S., Balhoff J. P., Borromeo C., Brush M., Carbon S., Conlin T., Dunn N., Engelstad M., et al. (2017). The Monarch Initiative: An integrative data and analytic platform connecting phenotypes to genotypes across species. Nucleic Acids Res. 45, D712–D722. [DOI] [PMC free article] [PubMed] [Google Scholar]
- Nymark P., Rieswijk L., Ehrhart F., Jeliazkova N., Tsiliki G., Sarimveis H., Evelo C. T., Hongisto V., Kohonen P., Willighagen E., et al. (2018). A data fusion pipeline for generating and enriching adverse outcome pathway descriptions. Toxicol. Sci. 162, 264–275. [DOI] [PubMed] [Google Scholar]
- Oki N. O., Nelms M. D., Bell S. M., Mortensen H. M., Edwards S. W. (2016). Accelerating adverse outcome pathway development using publicly available data sources. Curr. Environ. Health Rep. 3, 53–63. [DOI] [PubMed] [Google Scholar]
- Pelletier D., Wiegers T. C., Enayetallah A., Kibbey C., Gosink M., Koza-Taylor P., Mattingly C. J., Lawton M. (2016). ToxEvaluator: An integrated computational platform to aid the interpretation of toxicology study-related findings. Database (Oxford) 2016, baw062.. [DOI] [PMC free article] [PubMed] [Google Scholar]
- Planchart A., Green A., Hoyo C., Mattingly C. J. (2018). Heavy metal exposure and metabolic syndrome: Evidence from human and model system studies. Curr. Environ. Health Rep. 5, 110–124. [DOI] [PMC free article] [PubMed] [Google Scholar]
- Sakai N., Otomo T. (2016). Challenge of phenotype estimation for optimal treatment of Krabbe disease. J. Neurosci. Res. 94, 1025–1030. [DOI] [PubMed] [Google Scholar]
- Taboureau O., Audouze K. (2017). Human Environmental Disease Network: A computational model to assess toxicology of contaminants. ALTEX 34, 289–300. [DOI] [PubMed] [Google Scholar]
- Villeneuve D. L., Crump D., Garcia-Reyero N., Hecker M., Hutchinson T. H., LaLone C. A., Landesmann B., Lettieri T., Munn S., Nepelska M., et al. (2014a). Adverse outcome pathway (AOP) development I: Strategies and principles. Toxicol. Sci. 142, 312–320. [DOI] [PMC free article] [PubMed] [Google Scholar]
- Villeneuve D. L., Crump D., Garcia-Reyero N., Hecker M., Hutchinson T. H., LaLone C. A., Landesmann B., Lettieri T., Munn S., Nepelska M., et al. (2014b). Adverse outcome pathway development II: Best practices. Toxicol. Sci. 142, 321–330. [DOI] [PMC free article] [PubMed] [Google Scholar]
- Wilkinson M. D., Dumontier M., Aalbersberg I. J., Appleton G., Axton M., Baak A., Blomberg N., Boiten J. W., da Silva Santos L. B., Bourne P. E., et al. (2016). The FAIR Guiding Principles for scientific data management and stewardship. Sci. Data 3, 160018.. [DOI] [PMC free article] [PubMed] [Google Scholar]
- Wittwehr C., Aladjov H., Ankley G., Byrne H. J., de Knecht J., Heinzle E., Klambauer G., Landesmann B., Luijten M., MacKay C., et al. (2017). How adverse outcome pathways can aid the development and use of computational prediction models for regulatory toxicology. Toxicol. Sci. 155, 326–336. [DOI] [PMC free article] [PubMed] [Google Scholar]
- Yu X., Zhang J., Sun S., Zhou X., Zeng T., Chen L. (2017). Individual-specific edge-network analysis for disease prediction. Nucleic Acids Res. 45, e170.. [DOI] [PMC free article] [PubMed] [Google Scholar]