Abstract
The global gene expression profiles for 67 human lung tumors representing 56 patients were examined by using 24,000-element cDNA microarrays. Subdivision of the tumors based on gene expression patterns faithfully recapitulated morphological classification of the tumors into squamous, large cell, small cell, and adenocarcinoma. The gene expression patterns made possible the subclassification of adenocarcinoma into subgroups that correlated with the degree of tumor differentiation as well as patient survival. Gene expression analysis thus promises to extend and refine standard pathologic analysis.
Four main histologic subtypes of lung cancer are regularly distinguished by tumor morphology under the light microscope. Squamous and small cell tumors account for roughly 30% and 18% of all lung cancers, respectively. They are thought to derive mainly from epithelial cells that line the larger airways. Adenocarcinomas (ACs) comprise 30% of all lung cancers; these tumors are thought to derive from epithelial cells that line the peripheral small airways. Finally, 10% of lung tumors are classified as large cell, a poorly differentiated subtype usually diagnosed by exclusion of the other three types of lung cancer. Like ACs, large cell tumors are preferentially located in the periphery of the lung.
Patients with nonsmall cell lung tumors (squamous, AC, and large cell) are treated differently from those with small cell tumors. The pathological distinction between small cell lung cancer (SCLC) and nonsmall cell lung cancer is, therefore, very important. There is relative consensus among pathologists on the diagnosis of small cell cancer. These tumors progress along a typical clinical course that is characterized by an excellent initial response to chemotherapy and is often associated with several months of complete regression. This short-term regression is followed by recurrence, development of chemo-resistance, and finally death caused by systemic dissemination. In contrast, the morphological subtyping of nonsmall cell lung cancer is more difficult and far less reliable in predicting patient outcome. Approximately 50% of patients die from metastatic disease even after complete surgical removal of the primary tumor. The initial tumor pathologic diagnosis is based on small bronchoscopic biopsy specimens and may change when surgically removed specimens are re-examined. Lung tumor heterogeneity is well documented and is reflected in the morphological classification of mixed tumors such as adenosquamous carcinoma or combined SCLC containing both small cell and nonsmall cell components (1, 2).
The biology of tumors, including morphology, is determined in large part by gene expression programs in the cells comprising the tumor. Comprehensive analysis of gene expression patterns in individual tumors should, therefore, provide detailed molecular portraits that can facilitate tumor classification. For example, molecularly distinct subtypes, with significant differences in clinical behavior, can be recognized on the basis of differences in gene expression patterns for morphologically indistinguishable, diffuse large B cell lymphoma (3). Gene expression patterns also were used to classify at the molecular level sporadic breast tumors (4, 5), hereditary breast tumors (6), and leukemias (7).
Here we present evidence that analysis of gene expression patterns can provide a basis for classification of lung cancer that recapitulates and extends the conventional division of lung tumors into four morphological subtypes. We identified subsets of genes whose expression is characteristic of each morphological subtype. In addition, analysis of gene expression patterns permitted the further division of the ACs into subgroups with significant differences in patient survival.
Materials and Methods
The methods follow closely those used previously to study breast cancer (4, 5). RNA was extracted from frozen normal or crudely dissected tumor tissue and examined on cDNA microarrays by using a common reference RNA derived from a panel of cell lines. Hierarchical clustering (8) and Kaplan–Meier survival analysis were done essentially as described (4, 5). The nonparametric t test, with estimates for missing values (24), and all other details are published as supporting information on the PNAS web site, www.pnas.org.
Results
We determined the gene expression profiles for 67 lung tumors from patients whose clinical course was followed for up to 5 years. Based on visual examination in the light microscope by a single pathologist, the tumors comprised 41 ACs, 16 squamous cell carcinomas (SCCs), five large cell lung cancers (LCLCs), and five SCLCs. Five normal lung specimens were studied; these were derived from morphologically normal lung tissue in the periphery of the lobe from which the primary tumor was resected. Finally, a sample of fetal lung tissue was included for comparison. Eleven of the tumors were sampled twice, either as a primary tumor/metastatic lymph node pair, a primary tumor/intrapulmonary metastasis pair, a pair of metastases from the same patient (see below), or a central/peripheral biopsy pair from same primary tumor. There were four SCC tumor pairs, six AC tumor pairs, and one SCLC tumor pair. Only the large cell subtype was not represented by at least one pair.
Hierarchical clustering was used to interpret the patterns of expression. The implementation we used (8) organizes gene expression data tables so that the genes (rows) and tissue samples (columns) are rearranged according to the degree of similarity in the pattern of gene expression. Clustering of tumor samples was based on the patterns of expression of 23,100 cDNA clones representing 17,108 unique genes. An efficient way to use clustering to discriminate tumor subtypes is to derive a gene list consisting of a subset of genes whose expression was most similar within tumor pairs yet varied widely among the other tumor samples (4). The gene list derived in this way from our lung tumor data comprises 918 cDNA clones representing 835 unique genes (see Materials and Methods, which is published as supporting information on the PNAS web site).
Overview of the Gene Expression Patterns.
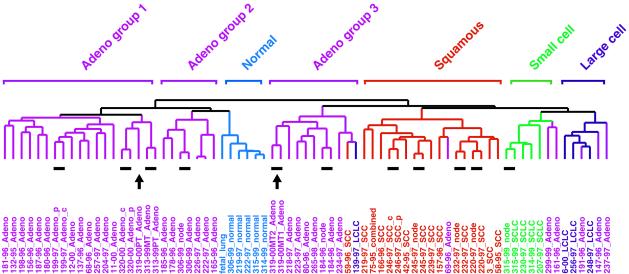
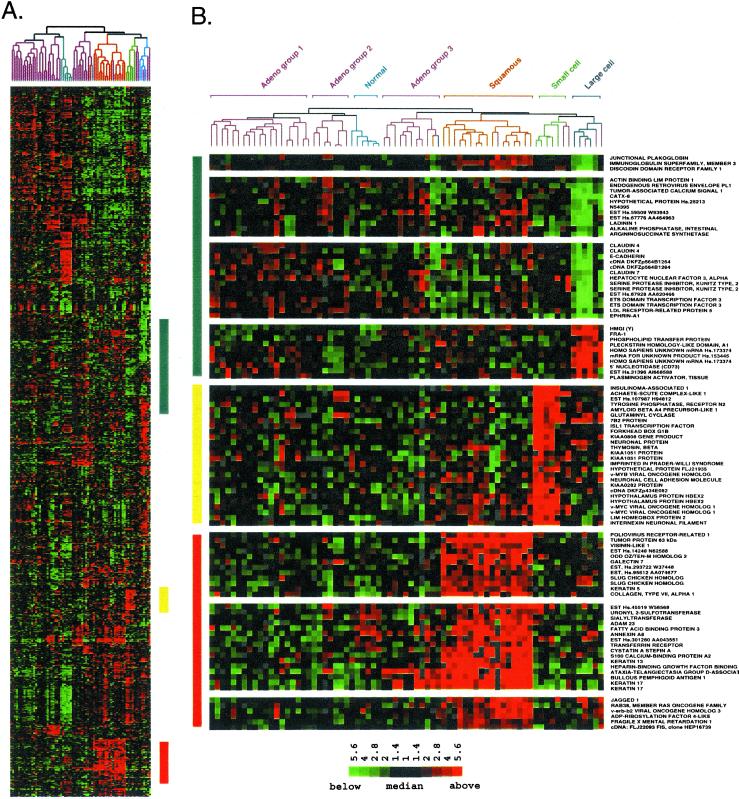
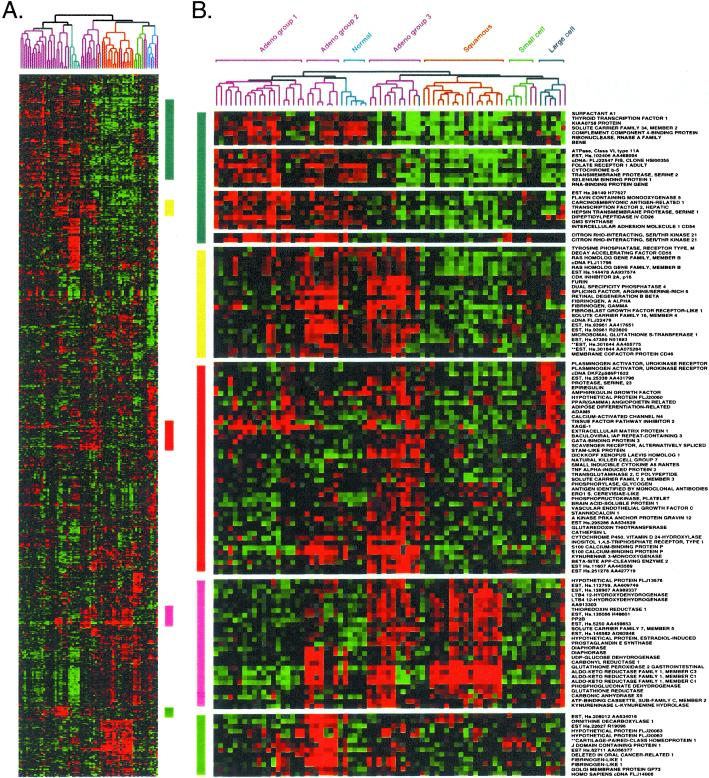
The tissue and tumor sample dendrogram, summarizing the degree of similarity in gene expression among the 73 samples, is shown in Fig. 1, which also shows the 11 pairs that were used to generate the lung tumor gene list. The entire cluster diagram is shown in Fig. 2A. One can see that SCC tumors clustered together, indicating that these tumors share a common expression pattern. Genes that were characteristically and strongly expressed in SCC tumors are shown in Fig. 2B. Similarly, the morphologically classified SCLC, AC, and LCLC tumors, as well as the normal tissues (including the fetal lung), also clustered with their respective subtypes; gene clusters are shown in Figs. 2A and 3A and characteristic gene subsets in Figs. 2B (SCLC and LCLC) and 3B (AC). It is clear, at this level of resolution, that molecular classification of human lung tumors using gene expression profiling followed very closely the prior purely morphological classification.
Figure 1.
Patterns of gene expression correspond to the major morphological classes of lung tumors. A total of 73 lung tissues were sorted by hierarchical clustering based on similarity in gene expression. AC groups 1, 2, and 3 clustered separately, as indicated above the branches. Patient identification number, the year in which the tumor was resected, and the classification of the tumor by the pathologist (color-coded for simplicity) are shown directly below the corresponding branch of the dendogram. Patient 75–95 was diagnosed with combined LCLC/SCLC (combined). Where indicated, tumor pairs corresponded to primary tumor/lymph node (node), central (c)/peripheral (p) biopsy from the same primary tumor, or primary tumor (PT)/intrapulmonary metastases (MT), all taken from the same patient at the same time. Resected human lung cancer tissue was derived from untreated patients at Charite hospital in Berlin. Only four patients, identified as 3, 6, 11, and 12, were obtained from Stanford Medical Center. The 11 tumor pairs (short lines) and the primary tumor/intrapulmonary metastases from patient 319 (arrows) are indicated immediately below the dendogram branches.
Figure 2.
Squamous, small cell, and large cell lung tumors express a unique set of genes. (A) Hierarchical clustering sorted 918 cDNA clones and 73 lung tissues based on similarity in gene expression. Gene clusters relevant to lung tumor types were extracted from the larger cluster of 918 clones in the regions indicated by the colored bars and expanded on the right to include gene names. A row in the cluster indicates expression of a specific gene across all 73 lung tissues. A column indicates the tissue in which the gene is expressed. Red, green, and black squares indicate that expression of the gene is greater than, less than, or equal to the median level of expression across all 73 lung tissues, respectively. Gray represents missing or poor quality data. (B) (Top) Gene clusters relevant to large cell tumors (blue bar). (Middle) Gene clusters relevant to small cell tumors (yellow bar). (Bottom) Gene clusters relevant to squamous lung tumors (red bar). The scale bar reflects the fold increase (red) or decrease (green) for any given gene relative to the median level of expression across all samples.
Figure 3.
The three AC subgroups express a characteristic set of genes. (A) Cluster of 73 lung tissues and 918 cDNA clones, exactly as shown in Fig. 2A. (B) Gene clusters relevant to AC subgroups were extracted from the larger cluster as described in Fig. 2.
AC, unlike SCC or SCLC, showed striking heterogeneity in the expression pattern of the 918 cDNA clones (Fig. 3B). The overall cluster dendogram suggests that AC can be subclassified into three groups. Group 1 consisted of 16 patients. Group 2 contained only six patients and clustered on the same branch as normal lung. Group 3 contained nine patients, including one SCC and one LCLC. A sample within AC group 1 (319–00PT) was the presumed primary tumor from a patient with a pair of intrapulmonary metastases (319–00MT) that clustered together in group 3 (arrows in Fig. 1). This case is discussed in more detail below.
Gene Expression Patterns Characteristic of the Morphological Subtypes.
LCLC showed strong expression of a cluster of genes including HMGI(Y), FOS-related antigen 1, and tissue plasminogen activator (Fig. 2B Top). Several clusters of genes were poorly represented in the large cell tumors, including E-cadherin and junction plakoglobin (gamma catenin), which interact with one another to regulate epithelial cell adhesion. Additional genes whose expression is enriched in epithelial cells were also consistently expressed at lower levels in LCLC relative to the other tumor types. These included ladinin, discoidin domain receptor 1, CATX-8, tumor-associated calcium signal transducer 1, epithelial-specific ets transcription factor, and claudins 4 and 7. The overall picture that emerges from the gene expression program for LCLC strongly suggests an epithelial-mesenchymal transition (9–11). PAX-8 was expressed at low levels in LCLC, and its pattern of expression in these cancers was very similar to that of E-cadherin (data not shown). PAX-8 was shown previously to correlate with the mesenchyme to epithelial transition in the developing kidney (12). The loss of PAX-8 is consistent with a mesenchymal phenotype for LCLC. Dickkopf-1, strongly expressed in LCLC and AC group 3 tumors, may play a key role in the transition from an epithelial to mesenchymal phenotype (13). Although poorly differentiated morphologically, the large cell tumors analyzed here expressed a number of potential differentiation markers that may be useful for future characterization of LCLC.
The highly aggressive SCLC expressed many genes consistent with neuroendocrine differentiation. Strong expression of insulinoma-associated 1, which serves as a marker for tumors of neuroendocrine differentiation, was unique to the four small cell tumors analyzed (Fig. 2B Middle). The gene encoding 7B2 was expressed strongly in both small cell and large cell tumors. Within endocrine secretory cells, 7B2 was shown to localize to secretory granules containing peptide hormones (14). The expression of glutaminyl cyclase, an enzyme responsible for the posttranslational modification of neuropeptide precursors, was similar to that of 7B2. L-myc and the neuronal differentiation marker achaete-scute homolog were expressed in all tumors within the small cell branch, including several AC tumors.
SCC of the lung showed characteristics of a squamous epithelium. Morphologically, well-differentiated SCC shows extensive keratinization and, as expected, genes strongly expressed in SCC included cytokeratins 5, 13, and 17 (Fig. 2B Bottom). Gene knockout studies have shown that tumor protein p63, strongly expressed in SCC, is responsible for the maintenance of all squamous epithelium in the mouse (15, 16). Amplification of p63 may contribute to squamous lung tumors (17). Immunohistochemistry showed that p63 was expressed in SCC and was not expressed in other lung tumor types (17) (Yong-Wei Yu and I.P., unpublished work).
Gene Expression Patterns Characteristic of the AC Subgroups.
The three AC subgroups differentially expressed a broad range of genes (Fig. 3). Surfactant A1 was expressed in AC groups 1 and 2, but was poorly expressed by AC group 3 and the other types of lung tumors (Fig. 3B, blue bar). Thyroid transcription factor (TTF1), implicated in the regulation of surfactant gene expression, is used as a marker to distinguish primary AC of the lung (18, 19). Expression of surfactant proteins B and C, in addition to pronapsin A, a protease involved in surfactant pro-protein processing (20), correlated very strongly with expression of TTF1 and surfactant A1 in AC groups 1 and 2 (Fig. 3B, and data not shown).
AC group 3 tumors shared with AC group 2 tumors strong expression of a cluster of genes that included cyclin-dependent kinase inhibitor p16 (Fig. 3B, yellow bar). The gene expression profile for AC group 3 was of particular interest because many of these tumors were metastatic (see below). AC group 3 shared with LCLC the strong expression of genes involved in tissue remodeling (Fig. 3B). Specifically, plasminogen activator urokinase receptor and cathepsin L are involved in extracellular proteolysis. Vascular endothelial growth factor C, stanniocalcin 1, and peroxisome proliferator-activated receptor γ angiopoietin-related may regulate the induction of new blood vessels. AC group 3 and LCLC also strongly expressed dickkopf homolog 1, a secreted wnt signaling inhibitor in Xenopus (21–23).
AC group 3 shared with SCC the expression of an entire cluster of genes encoding metabolic enzymes (Fig. 3, pink bar). Although the precise role of these proteins in lung cancer is not known, carbonyl reductase, prostaglandin E synthase, leukotriene B4 12-dehydrogenase, thioredoxin reductase, glutathione peroxidase, and aldo-keto reductase family 1 have been implicated in eicosinoid metabolism and/or inflammation. Cell lines derived from the tumors analyzed here retained expression of many of these genes, strongly suggesting that they are expressed in the tumor cells and not infiltrating inflammatory cells (data not shown). Immunohistochemistry using antibodies specific to each of these proteins will ultimately be required to resolve this issue.
Survival of Patients with Different AC Subgroups.
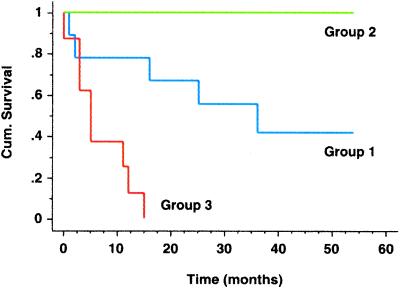
The subdivision of AC based on gene expression patterns raised the possibility that clinical outcomes may be different for the three AC subgroups, as had been shown for other types of cancer (3). According to Kaplan–Meier analysis, there was a large difference in survival between patients whose tumors were classified as AC group 1 and those with AC group 3 tumors (Fig. 4). This difference was statistically significant, with a P value of 0.002. Because all six patients in AC group 2 were alive at the time of last follow-up, it is not possible to assess significance for this group. The substantial result is that gene expression subdivided lung AC into subgroups that were clinically different on the basis of survival. Any further clinical implication must be made with caution because, as emphasized below, the sample of tumors was heterogeneous.
Figure 4.
Kaplan–Meier curves show differences in survival for AC subgroups. AC groups 1–3 were defined by hierarchical clustering (see Fig. 1). Cumulative survival, plotted on the y axis, represents percentage of patients living for the indicated times.
Clinicopathological Properties of AC Subgroups.
We looked for possible relationships between the three groups of AC, as defined by gene expression patterns, and two classical parameters: tumor stage, which indicates tumor size and distribution, and tumor grade, which reflects degree of morphological differentiation. Clinical follow-up and tumor stage/grade for all patients in the three AC subgroups can be obtained from Table 1, which is published as supporting information on the PNAS web site, www.pnas.org. We found that 12 of the 16 tumors in AC group 1 were moderately (grade 2) or well differentiated (grade 1). In contrast, seven of the nine tumors in AC group 3 had a tumor grade of 3, which is indicative of poor differentiation. The distinction of AC groups 1 and 3 was, therefore, consistent with tumor grade.
AC group 2 tumors had good survival, although this group was more heterogeneous, containing both low- and high-grade tumors. Although the sample size is small, it is nevertheless important to note that the cluster analysis of gene expression patterns segregated the tumors with good survival but poor tumor grade into AC group 2. For these tumors, grade was not indicative of patient survival.
Half of the patients in AC group 1 had no detectable lymph node metastases, consistent with a well-differentiated tumor. Hematogenous metastases were noted in only six patients with tumors that fell into AC group 1. This finding contrasts with AC group 3, where the clinical records noted a very high incidence of lymph node or hematogenous metastases.
Morphological Differences Among the AC Subgroups.
Histological images of the primary tumor for patient 319, which clustered with the good prognosis AC group 1, revealed mainly glandular differentiation (see Fig. 6, which is published as supporting information on the PNAS web site, www.pnas.org). The two putative intrapulmonary metastases from the same patient, MT1 and MT2, both clustered not with AC group 1 but instead fell into AC group 3. MT1 looked similar morphologically to MT2 (Fig. 6), with poor tumor differentiation and partial solid tumor growth. MT1 and MT2 approached morphologically a grade 3 large cell carcinoma. Additional pathological evidence (see Fig. 6 legend) as well as a comparative genomic hybridization (CGH) analysis (data available at CGH online tumor database at http://amba.charite.de/cgh) suggested that these were indeed metastases derived from the same primary tumor. Thus, one might view this case as an example of tumor progression and metastasis formation. This finding also suggests the possibility that differences in pattern of gene expression and survival between AC groups 1 and 3 may be related to progression and/or metastasis.
Expression of Individual Genes Correlated with AC Subgroups.
Many of the tumors within the good prognosis AC group 1 looked very similar morphologically to the primary tumor for patient 319, yet, unlike 319, many of these patients showed no evidence of metastasis. It would be helpful to know whether the more aggressive cells that invade the blood vessel or the cartilage within primary tumor 319 express a characteristic set of genes that distinguish them from the other less-invasive tumor cells generally characteristic of AC group 1. To this end, we looked for individual genes that were differentially expressed in the three groups of AC.
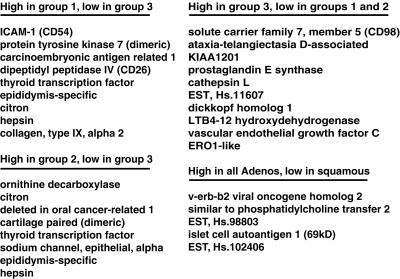
We compiled a list of genes that best distinguished the three groups of AC tumors as defined by hierarchical clustering. From the 918 cDNA clones used to cluster the lung tumor data, we selected individual genes by using a nonparametric t test (see Materials and Methods, which is published as supporting information). The following three selection criteria were used in the analysis: minimal variation in expression within each tumor subtype, maximal difference in mean level of expression between subtypes, and increased expression relative to normal lung tissues. We found a subset of genes whose strong expression was specific to each of the three AC groups. Fig. 5 lists a subset of genes that were strongly expressed in the following four categories: AC group 1 but not group 3; AC group 2 but not group 3; AC group 3 but not groups 1 or 2; all AC, but not in SCC (for a complete list of genes that satisfies these criteria, see Table 2, which is published as supporting information on the PNAS web site, www.pnas.org). In particular, AC group 3 (which contains mainly metastatic tumors) expressed a characteristic set of genes that may provide insight into the aggressive behavior of these tumors.
Figure 5.
Tumor-specific markers correlate with the three AC subgroups as defined by hierarchical clustering. Selection criteria were based on strong expression (high) in one group yet poor expression (low) in other AC or squamous tumors (see Materials and Methods, which is published as supporting information), as indicated above the list.
Discussion
The data show that patterns of gene expression obtained from DNA microarray studies of crudely dissected lung tumors can be used to detect tumor subtypes that correlate with biological and clinical phenotypes. Specifically, patterns of gene expression were found that correspond to the major morphological classes of lung tumors. In addition, we were able to define three subgroups of AC that differed not only in gene expression patterns, but also in clinical and pathological properties, including patient survival.
The survival differences we found among the AC tumors corresponded only in part to differences in stage and grade. In particular, AC group 2 included a number of high-grade tumors that nevertheless did not result in poor survival. For these cases, tumor morphology was not indicative of patient survival. In general, it is important to note that histological grading of lung cancer is biased by interobserver variability and does not influence the course of therapy. The genes that correlate with the different AC subgroups may, however, be used as markers to standardize morphological tumor grading. Future studies will be required to determine whether such markers have the potential to stratify patients according to their risk of dying from the disease.
In past studies (3–5, 7), profound differences in the pattern of gene expression have been attributable to differences in the cell type that gave rise to the tumor. At this point, we cannot definitively say whether or not AC group 1 and group 3 tumors come from a common epithelial precursor in the lung. If they do, one could suppose that AC becomes invasive when cells acquire the ability to strongly express the genes characteristic of AC group 3 tumors. AC group 1 would, in this model, simply represent an intermediate point on the path to the invasive phenotype. Such a model for AC tumor progression and consequent acquisition of metastatic potential is supported by the observation that the primary tumor for patient 319 clustered with good prognosis AC group 1 and the two putative intrapulmonary metastases clustered with the invasive, poor prognosis AC group 3 tumors.
If, on the other hand, AC group 1 and 3 tumors derive from different epithelial precursors, then genes that distinguish AC group 3 from group 1 may result simply from different cell types and may not contribute directly to the metastatic phenotype. At the present level of analysis we cannot distinguish among these possibilities. It will be interesting, in future studies, to discover whether metastatic AC group 3 tumors share with metastatic SCC or SCLC the characteristic expression of a common subset of genes.
Three AC tumors clustered not with the AC subgroups but instead clustered with LCLC (see Fig. 1). Poorly differentiated AC is difficult to distinguish morphologically from LCLC. It is, therefore, reasonable to assume that there will be some confusion about the morphological diagnosis of LCLC. Although the number of LCLC tumors analyzed here were too small to draw strong conclusions, molecular markers for LCLC provided in this study may contribute to a more detailed classification of LCLC. In addition, we observed that two AC tumors clustered with SCLC. These tumors expressed several genes associated with neuroendocrine differentiation (see Fig. 2). A larger cohort of patients will be necessary to determine whether an additional lung AC subgroup displays neuroendocrine differentiation. The relationship of AC tumors with neuroendocrine differentiation and SCLC remains to be determined.
Because our cohort contained many more ACs than other morphological tumor types, it remains to be seen whether biologically and clinically significant subgroups can be defined by gene expression pattern in the other morphological types of lung tumors.
In summary, we provided extensive and detailed support for the idea that gene expression-based classification of tumors will soon become clinically useful for cancer of the lung.
Supplementary Material
Acknowledgments
We thank Mike Fero for microarray production, John Matese for the web site, and Gavin Sherlock, Sandrine Dudoit, Anatoly Urisman, and Joshua Stuart for helpful advice. The research was supported by National Cancer Institute Grants CA77097 and CA85129 (to P.O.B and D.B.) and Deutsche Forschungsgemeinschaft Grant Pe602/1 (to I.P.). O.G.T. is a Howard Hughes Medical Institute Predoctoral Fellow and a Stanford Graduate Fellow.
Abbreviations
- AC
adenocarcinoma
- SCC
squamous cell carcinoma
- LCLC
large cell lung cancer
- SCLC
small cell lung cancer
References
- 1.Travis W, Colby T, Corrin B, Shimosato Y, Brambilla E. WHO International Histological Classification of Tumors: Histological Typing of Lung and Pleural Tumors. Heidelberg: Springer; 1999. [Google Scholar]
- 2.Colby T V, Koss M N, Travis W D. Atlas of Tumor Pathology (3rd Series Fascicle 13): Tumors of the Lower Respiratory Tract. under the auspices of Universities Associated for Research and Education in Pathology, Washington, DC: Armed Forces Institute of Pathology; 1995. [Google Scholar]
- 3.Alizadeh A A, Eisen M B, Davis R E, Ma C, Lossos I S, Rosenwald A, Boldrick J C, Sabet H, Tran T, Yu X, et al. Nature (London) 2000;403:503–511. doi: 10.1038/35000501. [DOI] [PubMed] [Google Scholar]
- 4.Perou C M, Sorlie T, Eisen M B, van de Rijn M, Jeffrey S S, Rees C A, Pollack J R, Ross D T, Johnsen H, Akslen L A, et al. Nature (London) 2000;406:747–752. doi: 10.1038/35021093. [DOI] [PubMed] [Google Scholar]
- 5.Sorlie T, Perou C M, Tibshirani R, Aas T, Geisler S, Johnsen H, Hastie T, Eisen M B, van De Rijn M, Jeffrey S S, et al. Proc Natl Acad Sci USA. 2001;98:10869–10874. doi: 10.1073/pnas.191367098. [DOI] [PMC free article] [PubMed] [Google Scholar]
- 6.Hedenfalk I, Duggan D, Chen Y, Radmacher M, Bittner M, Simon R, Meltzer P, Gusterson B, Esteller M, Kallioniemi O P, et al. N Engl J Med. 2001;344:539–548. doi: 10.1056/NEJM200102223440801. [DOI] [PubMed] [Google Scholar]
- 7.Golub T R, Slonim D K, Tamayo P, Huard C, Gaasenbeek M, Mesirov J P, Coller H, Loh M L, Downing J R, Caligiuri M A, et al. Science. 1999;286:531–537. doi: 10.1126/science.286.5439.531. [DOI] [PubMed] [Google Scholar]
- 8.Eisen M B, Spellman P T, Brown P O, Botstein D. Proc Natl Acad Sci USA. 1998;95:14863–14868. doi: 10.1073/pnas.95.25.14863. [DOI] [PMC free article] [PubMed] [Google Scholar]
- 9.Kustikova O, Kramerov D, Grigorian M, Berezin V, Bock E, Lukanidin E, Tulchinsky E. Mol Cell Biol. 1998;18:7095–7105. doi: 10.1128/mcb.18.12.7095. [DOI] [PMC free article] [PubMed] [Google Scholar]
- 10.Reichmann E, Schwarz H, Deiner E M, Leitner I, Eilers M, Berger J, Busslinger M, Beug H. Cell. 1992;71:1103–1116. doi: 10.1016/s0092-8674(05)80060-1. [DOI] [PubMed] [Google Scholar]
- 11.Reeves R, Edberg D D, Li Y. Mol Cell Biol. 2001;21:575–594. doi: 10.1128/MCB.21.2.575-594.2001. [DOI] [PMC free article] [PubMed] [Google Scholar]
- 12.Stark K, Vainio S, Vassileva G, McMahon A P. Nature (London) 1994;372:679–683. doi: 10.1038/372679a0. [DOI] [PubMed] [Google Scholar]
- 13.Monaghan A P, Kioschis P, Wu W, Zuniga A, Bock D, Poustka A, Delius H, Niehrs C. Mech Dev. 1999;87:45–56. doi: 10.1016/s0925-4773(99)00138-0. [DOI] [PubMed] [Google Scholar]
- 14.Mbikay M, Seidah N G, Chretien M. Biochem J. 2001;357:329–342. doi: 10.1042/0264-6021:3570329. [DOI] [PMC free article] [PubMed] [Google Scholar]
- 15.Yang A, Schweitzer R, Sun D, Kaghad M, Walker N, Bronson R T, Tabin C, Sharpe A, Caput D, Crum C, et al. Nature (London) 1999;398:714–718. doi: 10.1038/19539. [DOI] [PubMed] [Google Scholar]
- 16.Mills A A, Zheng B, Wang X J, Vogel H, Roop D R, Bradley A. Nature (London) 1999;398:708–713. doi: 10.1038/19531. [DOI] [PubMed] [Google Scholar]
- 17.Hibi K, Trink B, Patturajan M, Westra W H, Caballero O L, Hill D E, Ratovitski E A, Jen J, Sidransky D. Proc Natl Acad Sci USA. 2000;97:5462–5467. doi: 10.1073/pnas.97.10.5462. [DOI] [PMC free article] [PubMed] [Google Scholar]
- 18.Ordonez N G. Adv Anat Pathol. 2000;7:123–127. doi: 10.1097/00125480-200007020-00007. [DOI] [PubMed] [Google Scholar]
- 19.Pelosi G, Fraggetta F, Pasini F, Maisonneuve P, Sonzogni A, Iannucci A, Terzi A, Bresaola E, Valduga F, Lupo C, et al. Am J Surg Pathol. 2001;25:363–372. doi: 10.1097/00000478-200103000-00011. [DOI] [PubMed] [Google Scholar]
- 20.Chuman Y, Bergman A, Ueno T, Saito S, Sakaguchi K, Alaiya A A, Franzen B, Bergman T, Arnott D, Auer G, et al. FEBS Lett. 1999;462:129–134. doi: 10.1016/s0014-5793(99)01493-3. [DOI] [PubMed] [Google Scholar]
- 21.Glinka A, Wu W, Delius H, Monaghan A P, Blumenstock C, Niehrs C. Nature (London) 1998;391:357–362. doi: 10.1038/34848. [DOI] [PubMed] [Google Scholar]
- 22.Schneider V A, Mercola M. Genes Dev. 2001;15:304–315. doi: 10.1101/gad.855601. [DOI] [PMC free article] [PubMed] [Google Scholar]
- 23.Marvin M J, Di Rocco G, Gardiner A, Bush S M, Lassar A B. Genes Dev. 2001;15:316–327. doi: 10.1101/gad.855501. [DOI] [PMC free article] [PubMed] [Google Scholar]
- 24.Troyanskaya O, Cantor M, Sherlock G, Brown P, Hastie T, Tibshirani R, Botstein D, Altman R B. Bioinformatics. 2001;17:520–525. doi: 10.1093/bioinformatics/17.6.520. [DOI] [PubMed] [Google Scholar]
Associated Data
This section collects any data citations, data availability statements, or supplementary materials included in this article.


